Education.
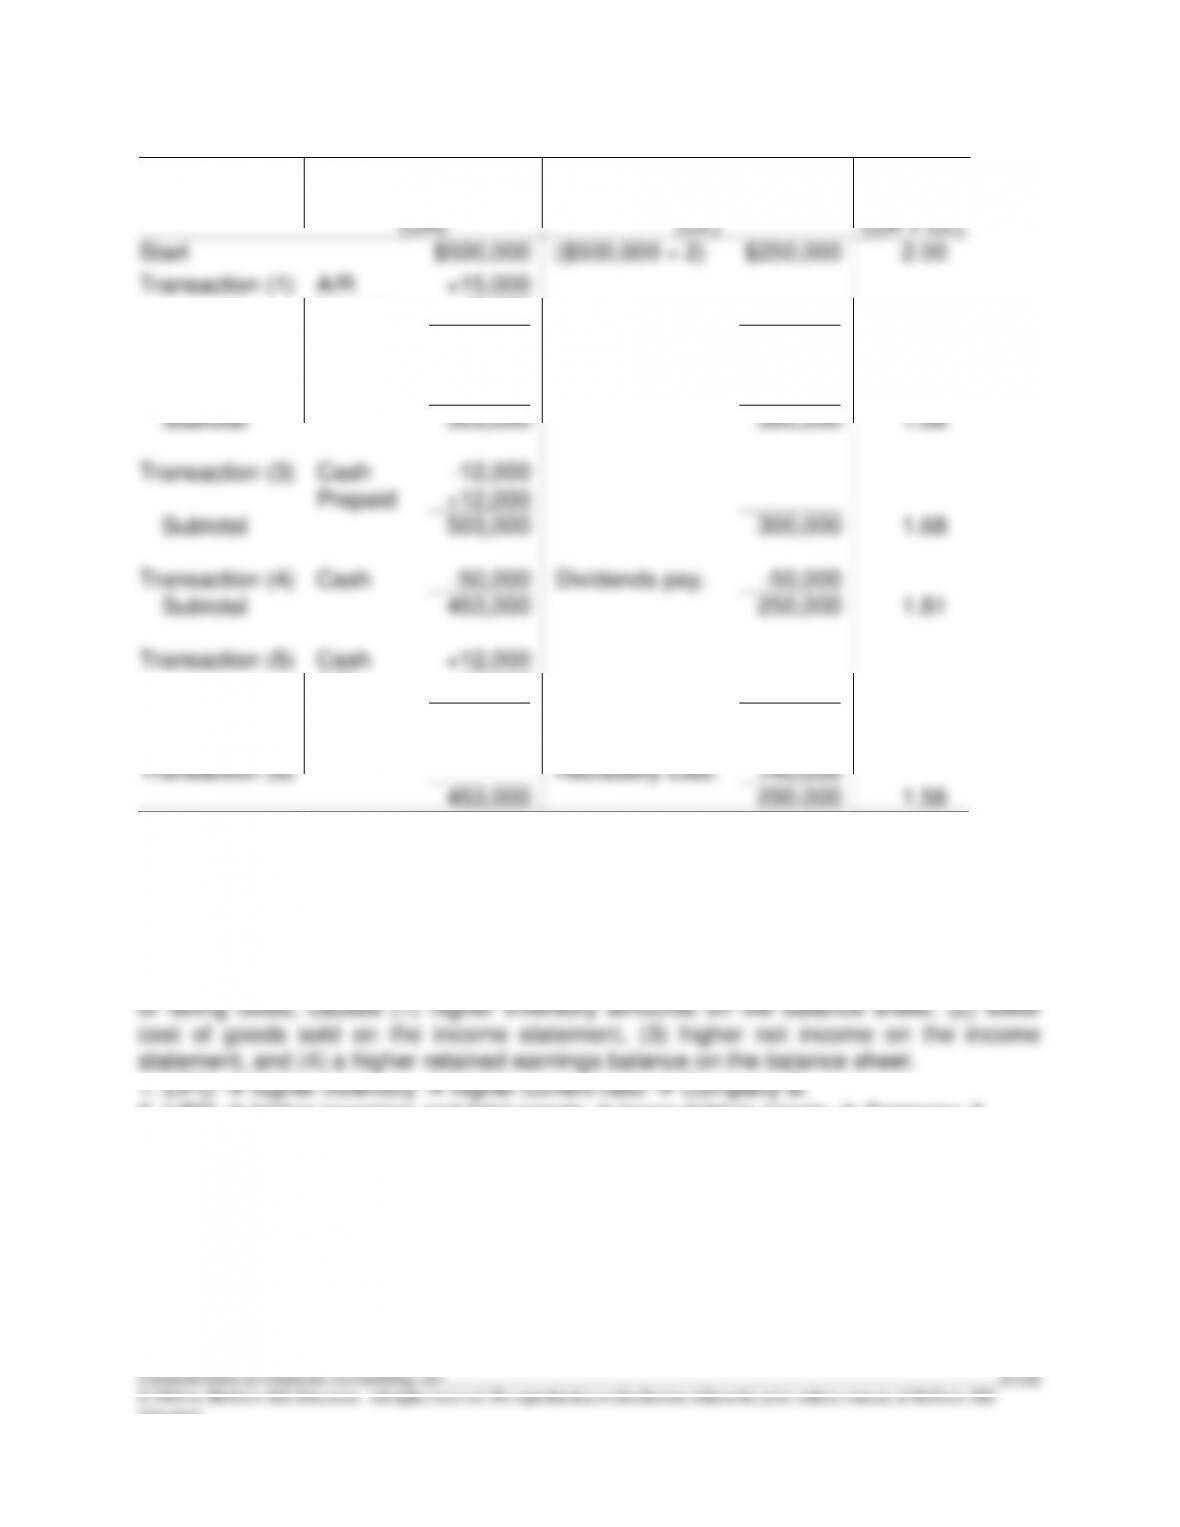
E13–14
Current Assets
(CA)
Current Liabilities
(CL)
Current
Ratio
(CA ÷ CL)
Start
$500,000
($500,000 ÷ 2)
$250,000
2.00
Transaction (1)
A/R
+15,000
Inventory
-12,000
Subtotal
503,000
250,000
2.01
Transaction (2)
Dividends pay.
+50,000
Subtotal
503,000
300,000
1.68
Transaction (3)
Cash
Prepaid
-12,000
+12,000
Subtotal
503,000
300,000
1.68
Transaction (4)
Cash
-50,000
Dividends pay.
-50,000
Subtotal
453,000
250,000
1.81
Transaction (5)
Cash
+12,000
-12,000
A/R
Subtotal
453,000
250,000
1.81
Transaction (6)
Reclassify Liab.
+40,000
453,000
290,000
1.56
E13–15
The exercise states that both companies are exactly alike except for the impact of the
alternative methods to cost inventory. Use of LIFO (compared to FIFO), during a period
2. LIFO → higher inventory and total assets → lower debt-to-assets → Company A.
3. LIFO → lower cost of goods sold → higher EPS → Company B.
13-22 Solutions Manual
© 2016 by McGraw-Hill Education. All rights reserved. No reproduction or distribution without the prior written consent of McGraw-Hill
Education.
ANSWERS TO COACHED PROBLEMS
CP13–1
Req. 1
Golden Corporation
Horizontal Analysis
Increase (Decrease)
in the current year (versus
previous year)
Amount
Percentage
Income statement:
Sales revenue……………………………………………………….
$15,000
9.1
Cost of goods sold ………………………………………..…………..
10,000
10.0
Gross profit ………………………………………………….……
5,000
7.7
Operating expenses ……………………………………..…………..
2,900
5.8
Interest expense …………………………..…………………………..
100
3.8
Income before income taxes…………………………..…………..
2,000
16.7
Income tax expense ……………………………………..…………..
1,000
33.3
Net income ………………………………………………….……
$ 1,000
11.1
Balance sheet:
Cash …………………………………………………………..…………..
$ (4,000
)
(50.0
)
Accounts receivable (net) …………………………………………..
(4,000
)
(17.4
)
Inventory ……………………………………………………....
5,000
14.3
Property & equipment (net)…………………………….…………..
7,000
18.4
$ 4,000
3.8
Current liabilities …………………………………………..…………..
$ (3,000
)
(15.8
)
Note payable (long-term) ……………………………….…………..
–0–
–0–
Common stock ($5 par) ……………………………………………..
–0–
–0–
Additional paid-in capital ………………………………..…………..
–0–
–0–
Retained earnings ………………………………………..…………..
7,000
140.0
$ 4,000
3.8
=
=
CP13–1 (continued)
Req. 2
(a) The percentage change in Cash (50%) is big but it results from a small dollar
by 9.1%, accounts receivable decreased by 17.4%. Typically, an increase in sales
would be accompanied by an increase in accounts receivable. One potential
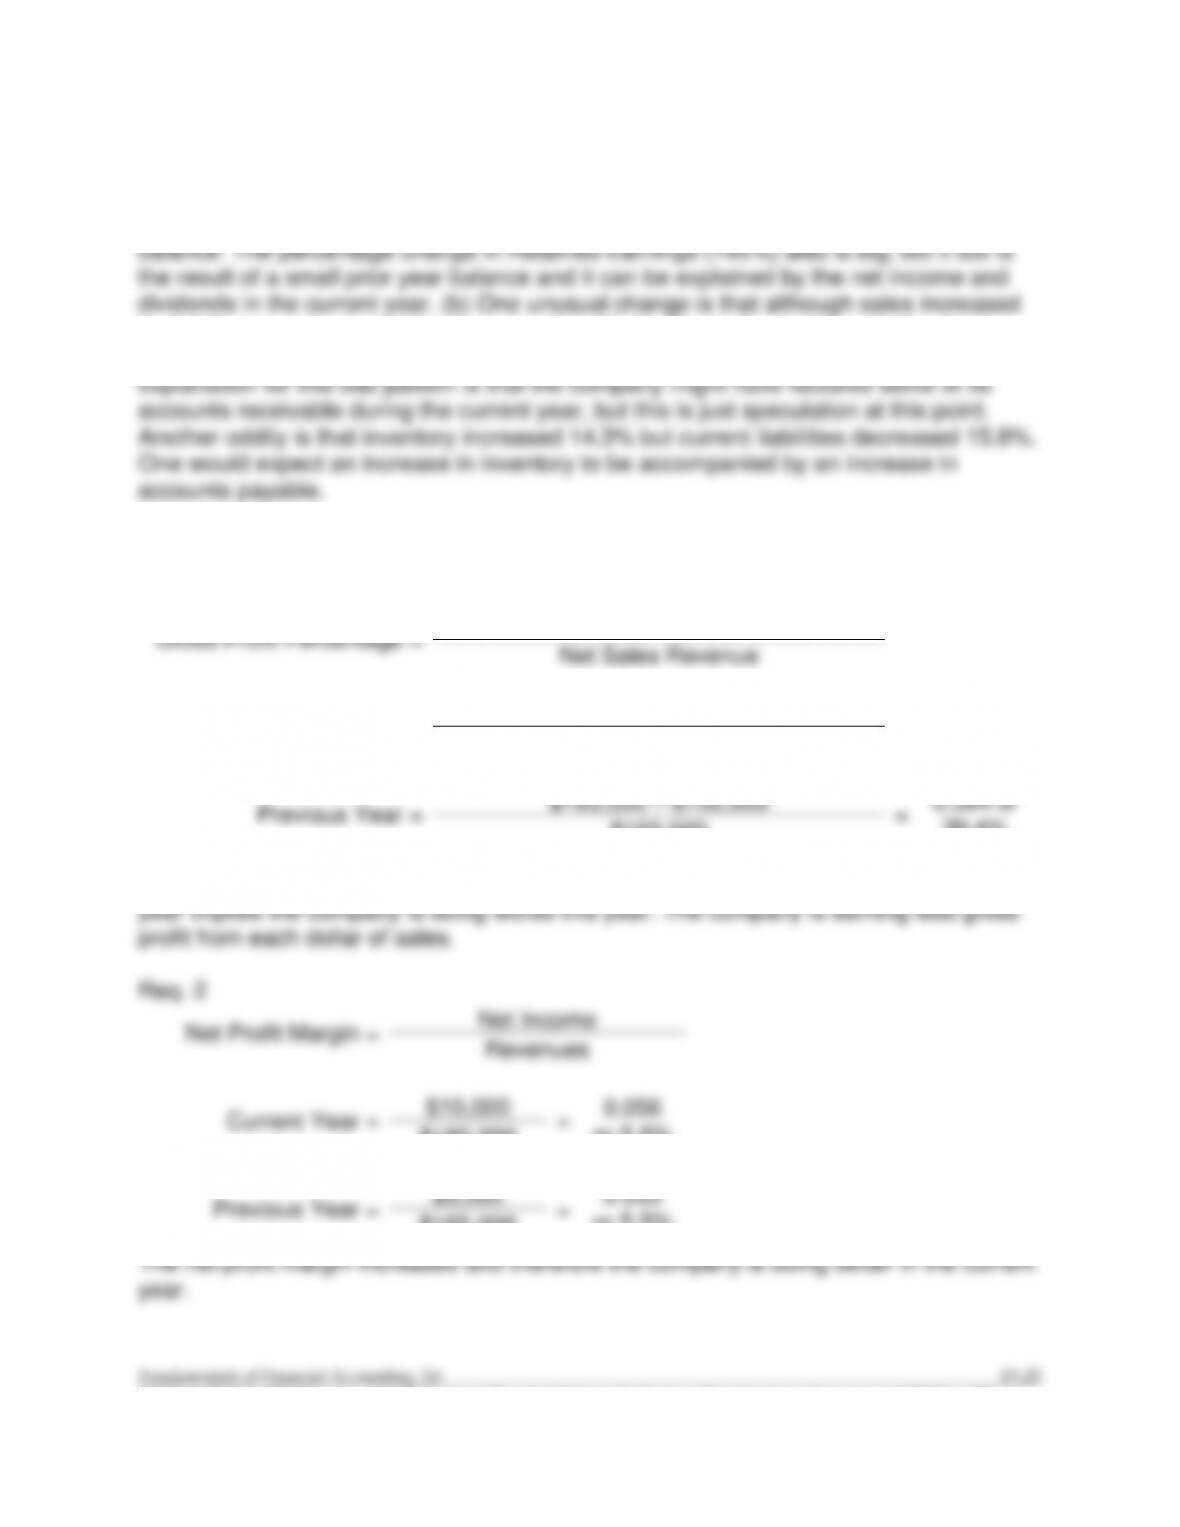
CP13–2
Req. 1
Gross Profit Percentage =
Net Sales Revenue – Cost of Goods Sold
Net Sales Revenue
Current Year =
$180,000 – $110,000
=
0.389 or
38.9%
$180,000
Previous Year =
$165,000 – $100,000
=
0.394 or
39.4%
$165,000
The slight decrease in the Gross Profit Percentage from the prior year to the current
CP13–2 (continued)
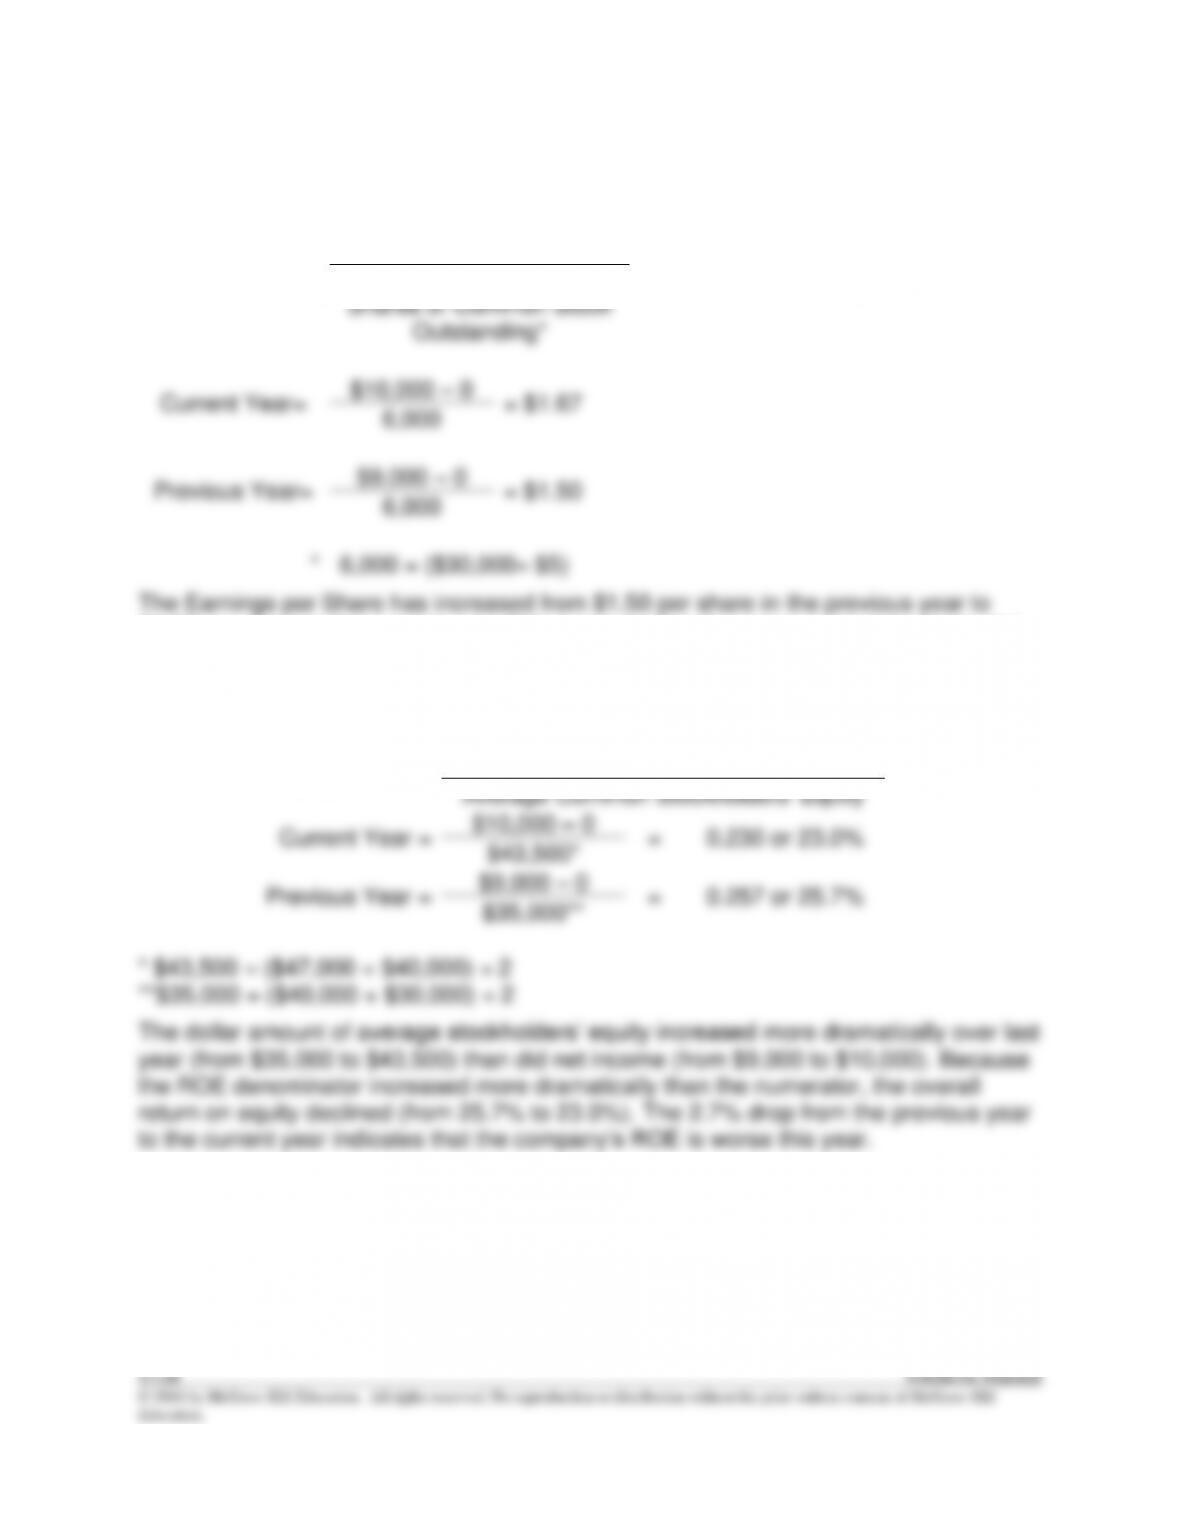
Req. 3
EPS =
Net Income – Preferred
Dividends
Average Number of
Shares of Common Stock
Outstanding*
Current Year=
$10,000 – 0
= $1.67
6,000
Previous Year=
$9,000 – 0
= $1.50
6,000
*
6,000 = ($30,000÷ $5)
The Earnings per Share has increased from $1.50 per share in the previous year to
$1.67 per share in the current year. This suggests that the company is doing better this
year and the improvement looks good for the stockholders.
Req. 4
Return on Equity (ROE) =
Net Income – Preferred Dividends
Average Common Stockholders‘ Equity
Current Year =
$10,000 – 0
=
0.230 or 23.0%
$43,500*
Previous Year =
$9,000 – 0
=
0.257 or 25.7%
$35,000**
* $43,500 = ($47,000 + $40,000) ÷ 2
**$35,000 = ($40,000 + $30,000) ÷ 2
The dollar amount of average stockholders’ equity increased more dramatically over last
year (from $35,000 to $43,500) than did net income (from $9,000 to $10,000). Because
the ROE denominator increased more dramatically than the numerator, the overall
return on equity declined (from 25.7% to 23.0%). The 2.7% drop from the previous year
to the current year indicates that the company’s ROE is worse this year.
© 2016 by McGraw-Hill Education. All rights reserved. No reproduction or distribution without the prior written consent of McGraw-Hill
Education.
CP13–2 (continued)
Req. 5
Fixed Asset Turnover =
Net Revenue
Average Net Fixed Assets
Current Year =
$180,000
=
4.34
($38,000 + $45,000) ÷ 2
Previous Year =
$165,000
=
4.52
($35,000 + $38,000) ÷ 2
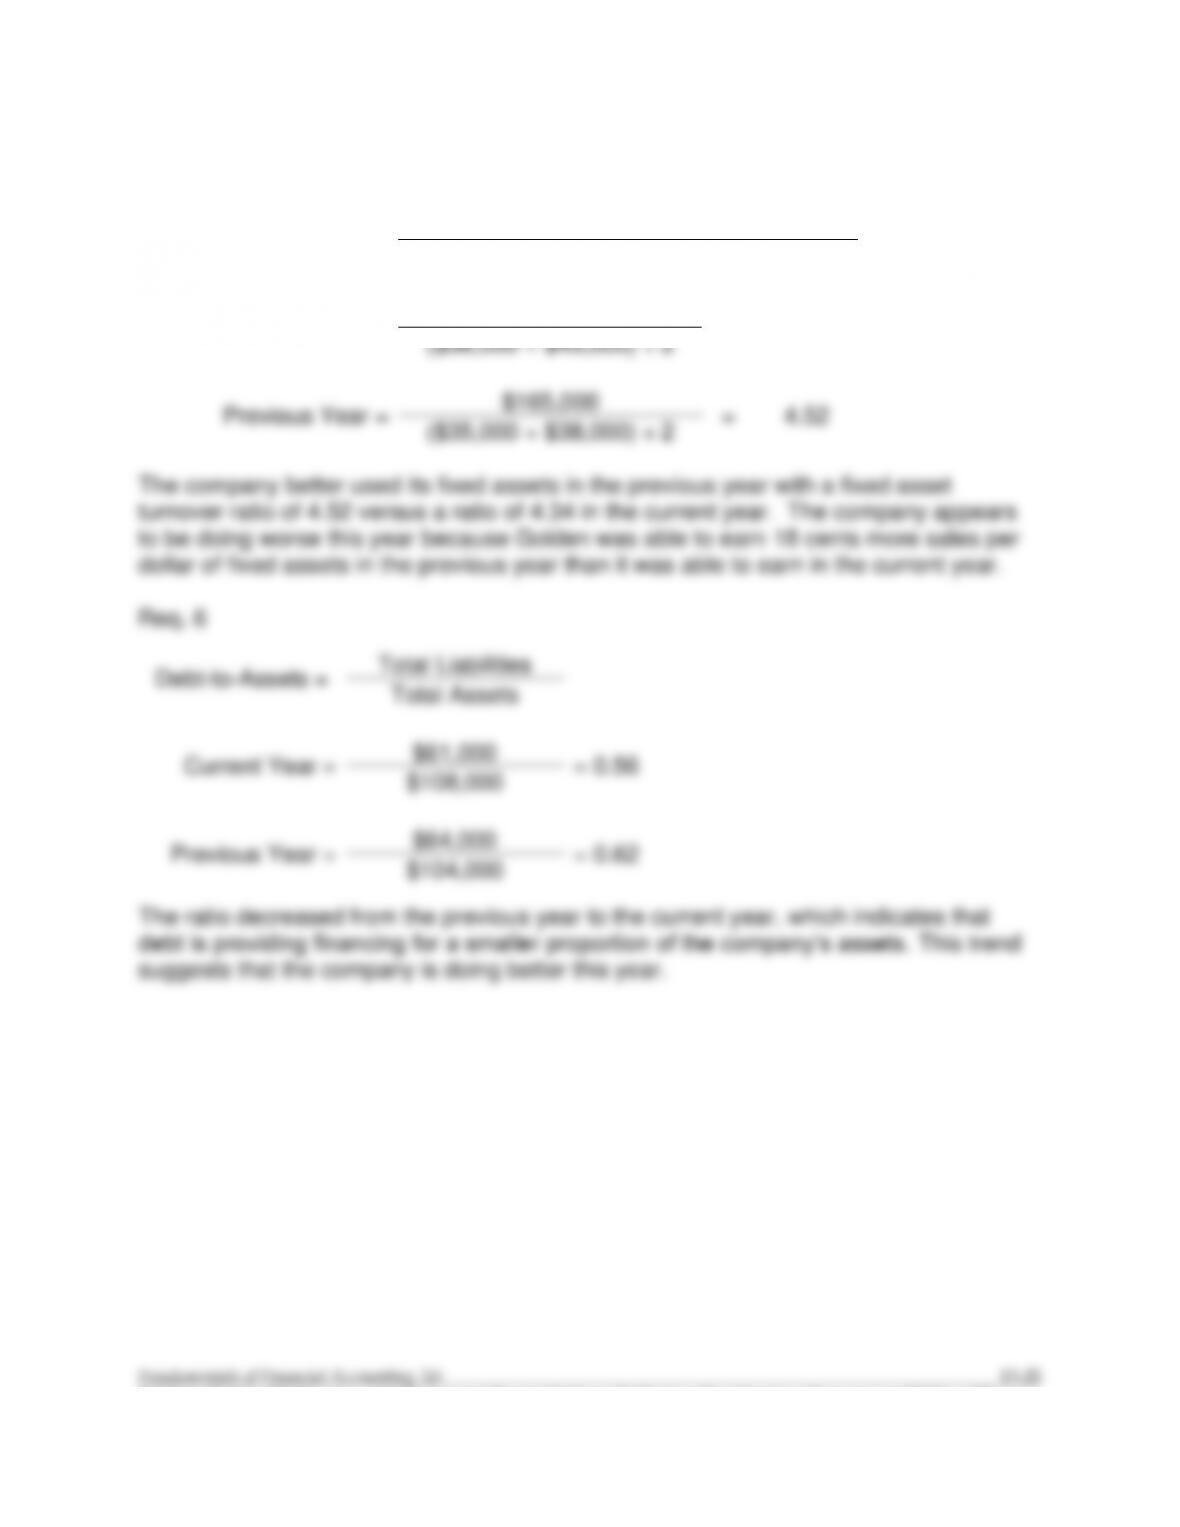
The company better used its fixed assets in the previous year with a fixed asset
turnover ratio of 4.52 versus a ratio of 4.34 in the current year. The company appears
to be doing worse this year because Golden was able to earn 18 cents more sales per
dollar of fixed assets in the previous year than it was able to earn in the current year.
Req. 6
Debt-to–Assets =
Total Liabilities
Total Assets
Current Year =
$61,000
= 0.56
$108,000
Previous Year =
$64,000
= 0.62
$104,000
The ratio decreased from the previous year to the current year, which indicates that
debt is providing financing for a smaller proportion of the company’s assets. This trend
suggests that the company is doing better this year.
CP13–2 (continued)
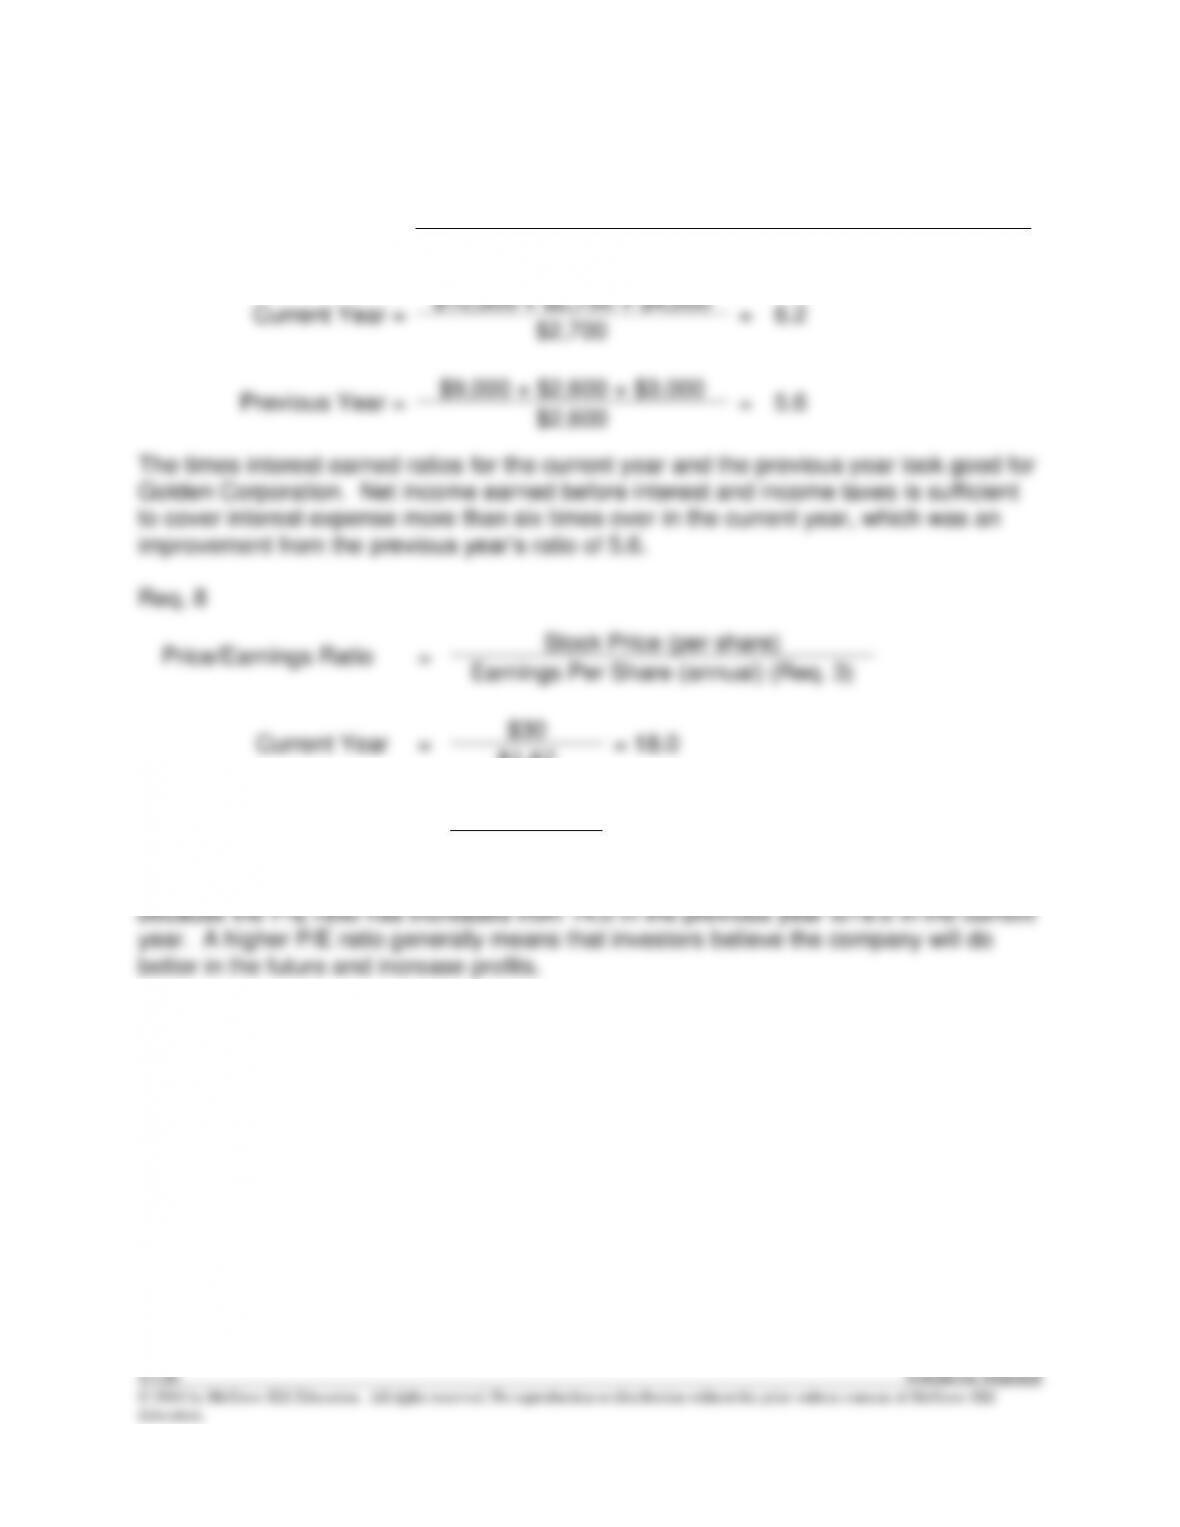
Req. 7
Times Interest Earned =
Net Income + Interest Expense + Income Tax Expense
Interest Expense
Current Year =
$10,000 + $2,700 + $4,000
=
6.2
$2,700
Previous Year =
$9,000 + $2,600 + $3,000
=
5.6
$2,600
The times interest earned ratios for the current year and the previous year look good for
Golden Corporation. Net income earned before interest and income taxes is sufficient
to cover interest expense more than six times over in the current year, which was an
improvement from the previous year’s ratio of 5.6.
Req. 8
Price/Earnings Ratio
=
Stock Price (per share)
Earnings Per Share (annual) (Req. 3)
Current Year
=
$30
= 18.0
$1.67
Previous Year
=
$21
= 14.0
$1.50
It appears that investors have become more optimistic about Golden’s future success
© 2016 by McGraw-Hill Education. All rights reserved. No reproduction or distribution without the prior written consent of McGraw-Hill
Education.
CP13–3
Req. 1
a.
Other current assets
=
$291
=
6%
Total assets
$5,070
b.
Intangibles
=
$1,974
=
39%
Total assets
$5,070
c.
Property and equipment
=
$548
=
11%
Total assets
$5,070
d.
Accrued liabilities
=
$658
=
13%
Total assets
$5,070
e.
Total liabilities
=
$2,803
=
55%
Total assets
$5,070
CP13–4
Req. 1
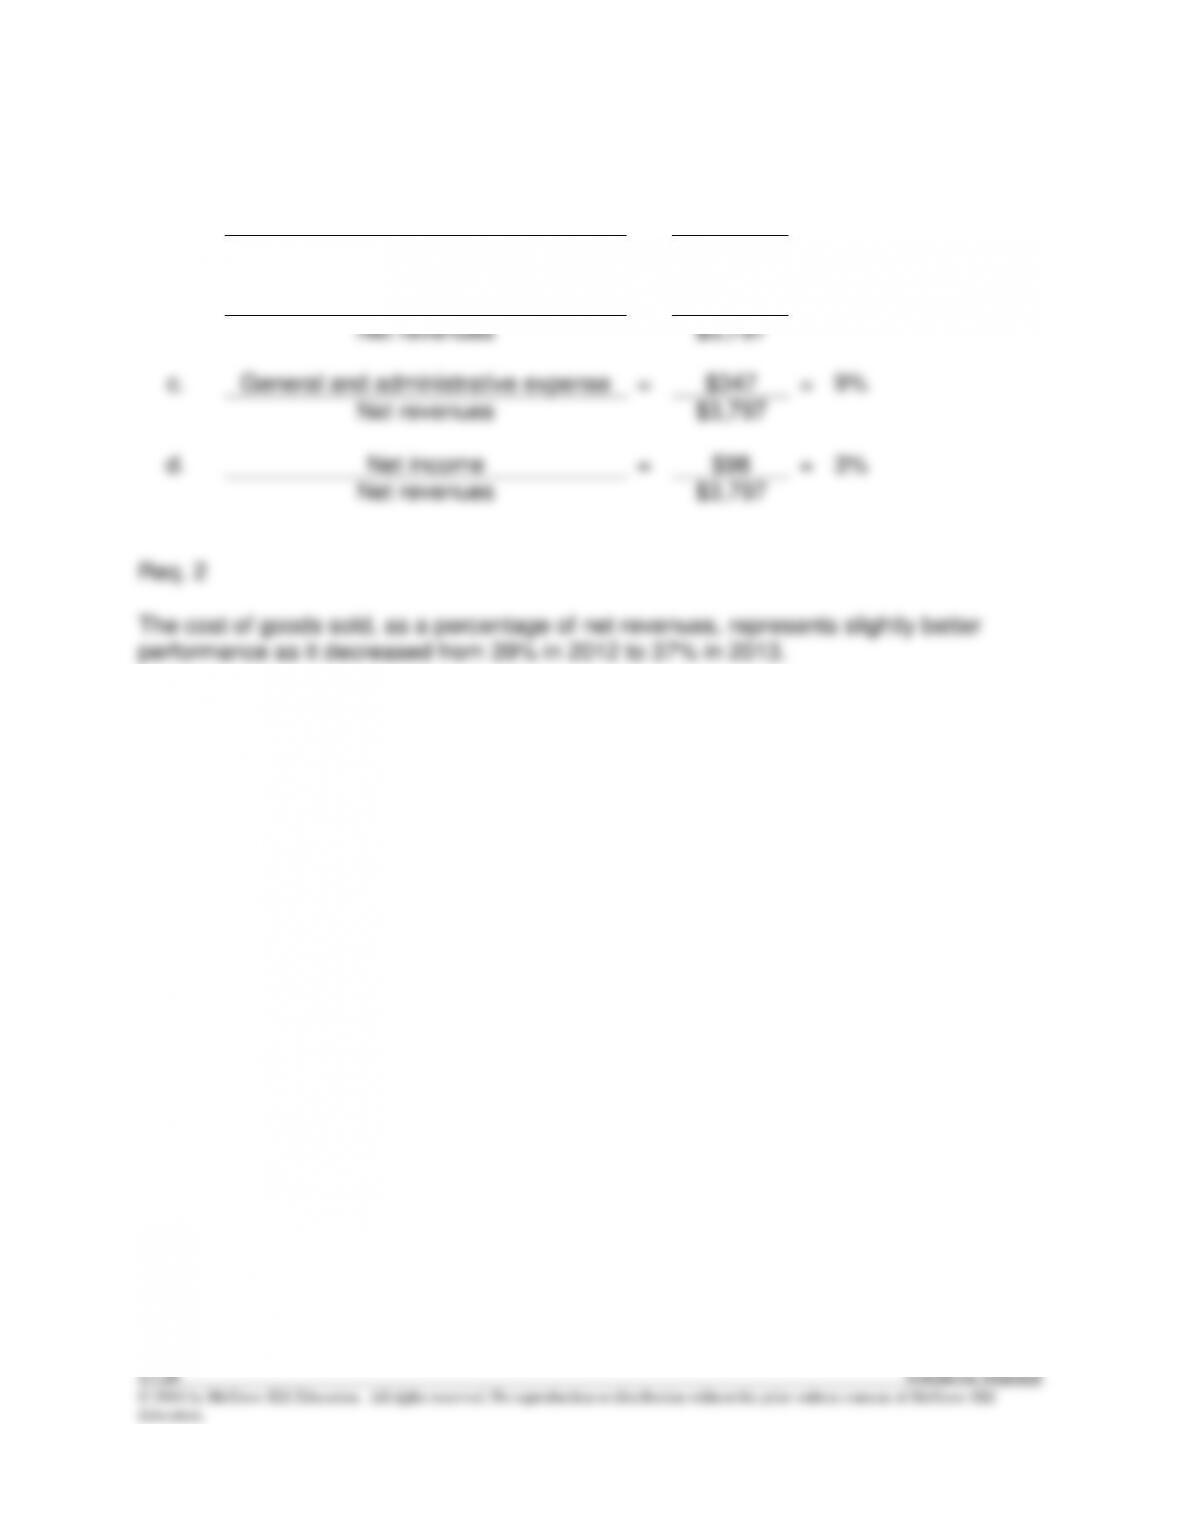
a.
Research and development expense
=
$1,153
=
30%
Net revenues
$3,797
b.
Sales and marketing expense
=
$788
=
21%
Net revenues
$3,797
c.
General and administrative expense
=
$347
=
9%
Net revenues
$3,797
d.
Net income
=
$98
=
3%
Net revenues
$3,797
© 2016 by McGraw-Hill Education. All rights reserved. No reproduction or distribution without the prior written consent of McGraw-Hill
Education.
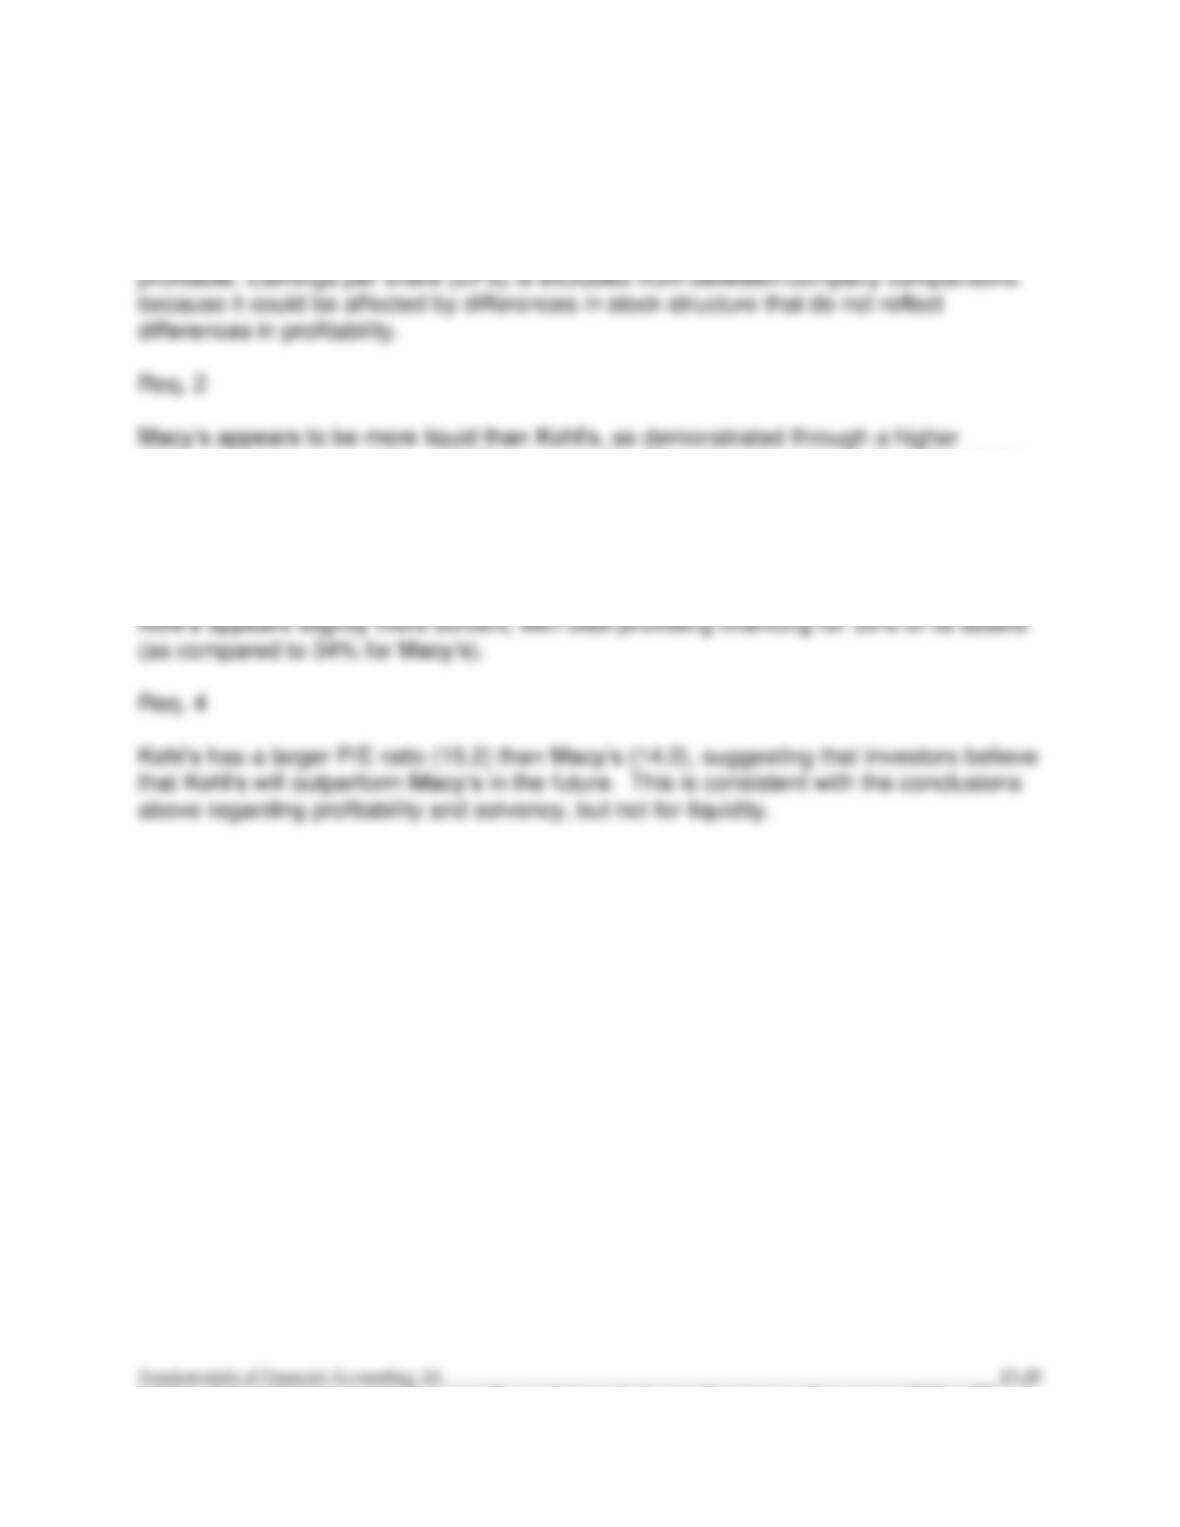
CP13–5
Req. 1
Kohl’s has a higher gross profit percentage, net profit margin and return on equity in
comparison to Macy’s. Thus, it appears on an overall basis that Kohl’s is more
(1) inventory turnover ratio, and (2) current ratio. Therefore, it suggests that Macy’s has
a better ability to generate cash to be used in paying current liabilities.
Req. 3
Only the debt-to-assets ratio is available to evaluate solvency. Based on this ratio alone,
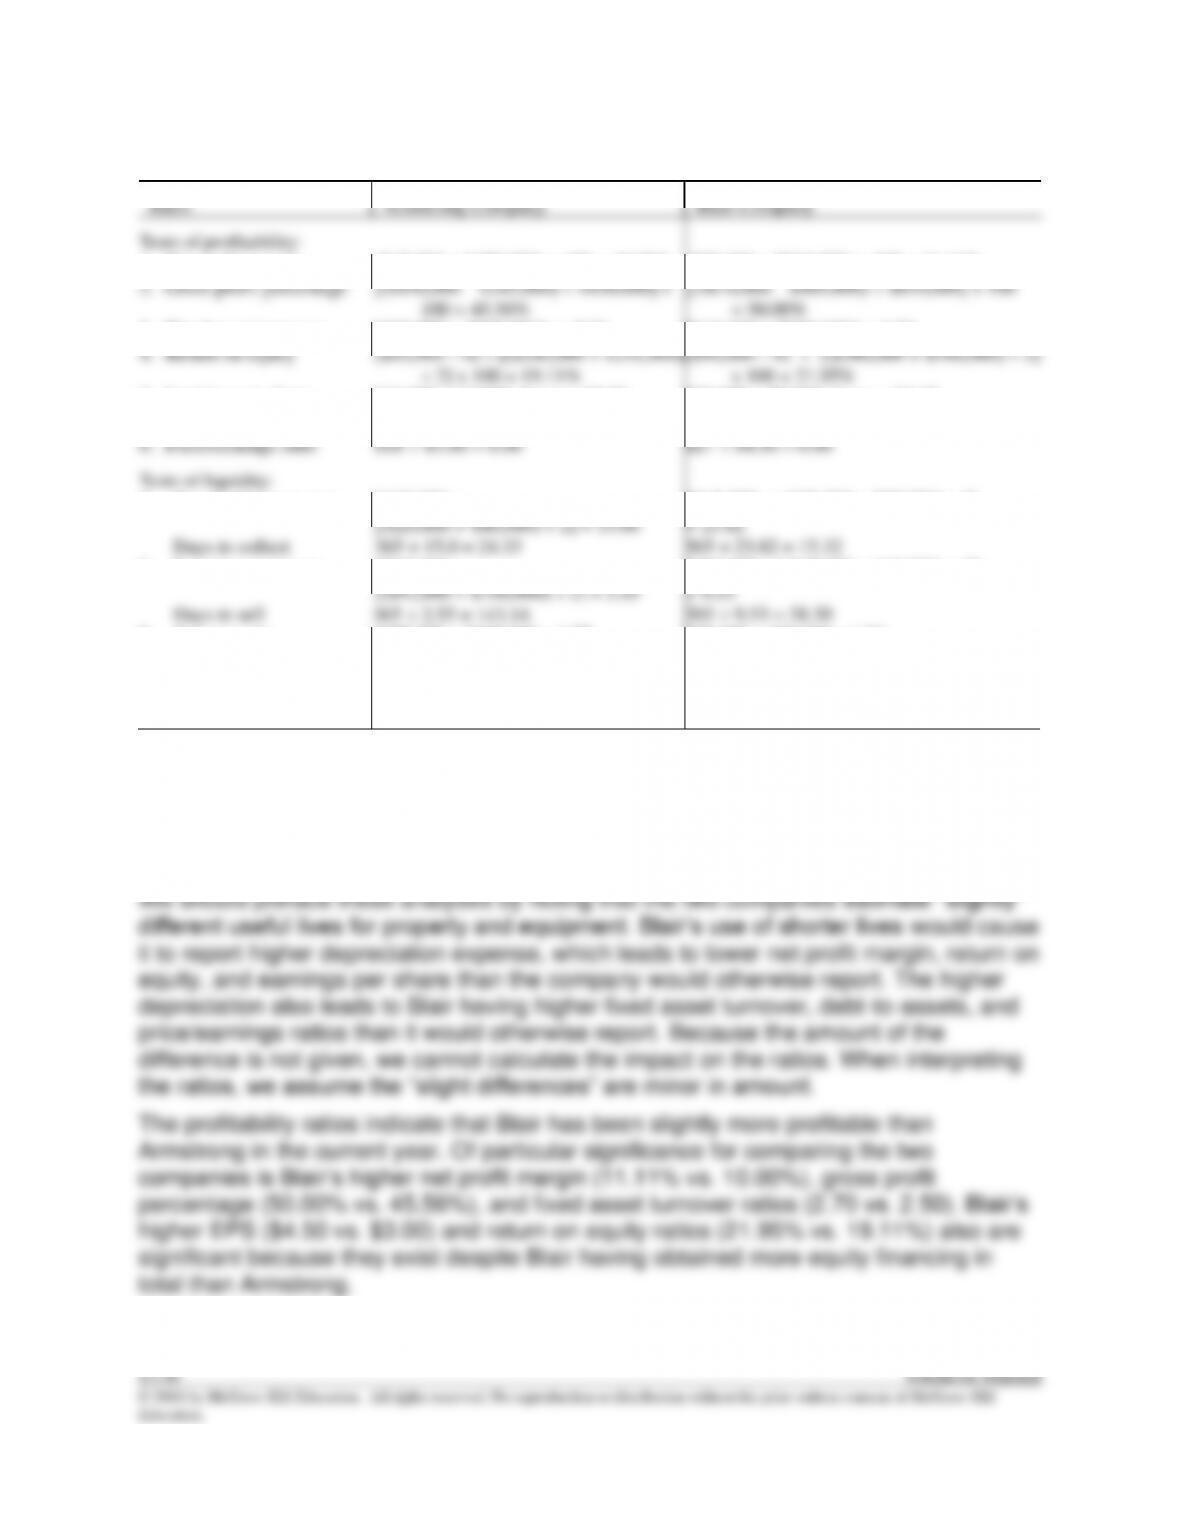
CP13–6
Req. 1
Ratio
Armstrong Company
Blair Company
Tests of profitability:
1.
Net profit margin
($45,000 ÷ $450,000) x 100 = 10.00%
($90,000 ÷ $810,000) x 100 = 11.11%
2.
Gross profit percentage
[($450,000 – $245,000) ÷ $450,000] x
100 = 45.56%
[($810,000 – $405,000) ÷ $810,000] x 100
= 50.00%
3.
Fixed asset turnover
$450,000 ÷ $180,000* = 2.50
$810,000 ÷ $300,000* = 2.70
4.
Return on equity
($45,000 – 0) ÷ [($240,000 + $231,000)
÷ 2] x 100 = 19.11%
($90,000 – 0) ÷ [($380,000 + $440,000) ÷ 2]
x 100 = 21.95%
5.
Earnings per share
$45,000 ÷ 15,000 shares = $3.00
$90,000 ÷ 20,000 shares = $4.50
6.
Price/earnings ratio
$18 ÷ $3.00 = 6.00
$27 ÷ $4.50 = 6.00
Tests of liquidity:
7.
Receivables turnover
$450,000 ÷
[($20,000 + $40,000) ÷ 2] = 15.00
$810,000 ÷ [($38,000 + $30,000) ÷ 2]
= 23.82
Days to collect
365 ÷ 15.0 = 24.33
365 ÷ 23.82 = 15.32
8.
Inventory turnover
$245,000 ÷
[($92,000 + $100,000) ÷ 2] = 2.55
$405,000 ÷ [($45,000 + $40,000) ÷ 2]
= 9.53
Days to sell
365 ÷ 2.55 = 143.14
365 ÷ 9.53 = 38.30
9.
Current ratio
$175,000 ÷ $100,000 = 1.75
$92,000 ÷ $50,000 = 1.84
Tests of solvency:
10.
Debt-to-assets
$160,000 ÷ $400,000 = 0.40
$420,000 ÷ $800,000 = 0.53
* The problem indicates that the end–of-year ending balance approximates the average
for the year.
Note: Data are not available for calculating the Times Interest Earned Ratio.
Req. 2