© 2016 by McGraw-Hill Education. All rights reserved. No reproduction or distribution without the prior written consent of McGraw-Hill
Education.
E13–2
Req. 1
Gross Profit Percentage =
Net Sales Revenue – Cost of Goods Sold
Net Sales Revenue
2013 =
$220 – $143
=
0.350 or
35.0%
$220
2012 =
$231 – $149
=
0.355 or
35.5%
$231
The gross profit percentage of 35.0% means that the company generated 35.0 cents of
gross profit on each dollar of sales in 2013, which was a decrease of 0.5 cents from
2012. If this trend continues, the company could be expected to generate less gross
profit from each dollar of sales in 2014.
Req. 2
Net Profit Margin =
Net Income
Net Sales Revenue
2013 =
$21
=
0.095 or
9.5%
$220
2012 =
$26
=
0.113 or
11.3%
$231
Chevron did a worse job of controlling expenses in 2013 relative to 2012 because the
net profit margin decreased 1.8% (11.3 – 9.5), of which only 0.5% was attributable to
E13–2 (continued)
Req. 3
Fixed Asset Turnover =
Net Revenue
Average Net Fixed Assets
2013 =
$220 billion
=
1.47
$150 billion
2012 =
$231 billion
=
1.78
$130 billion
Return on Equity (ROE) =
=
=
E13–3
Req. 1
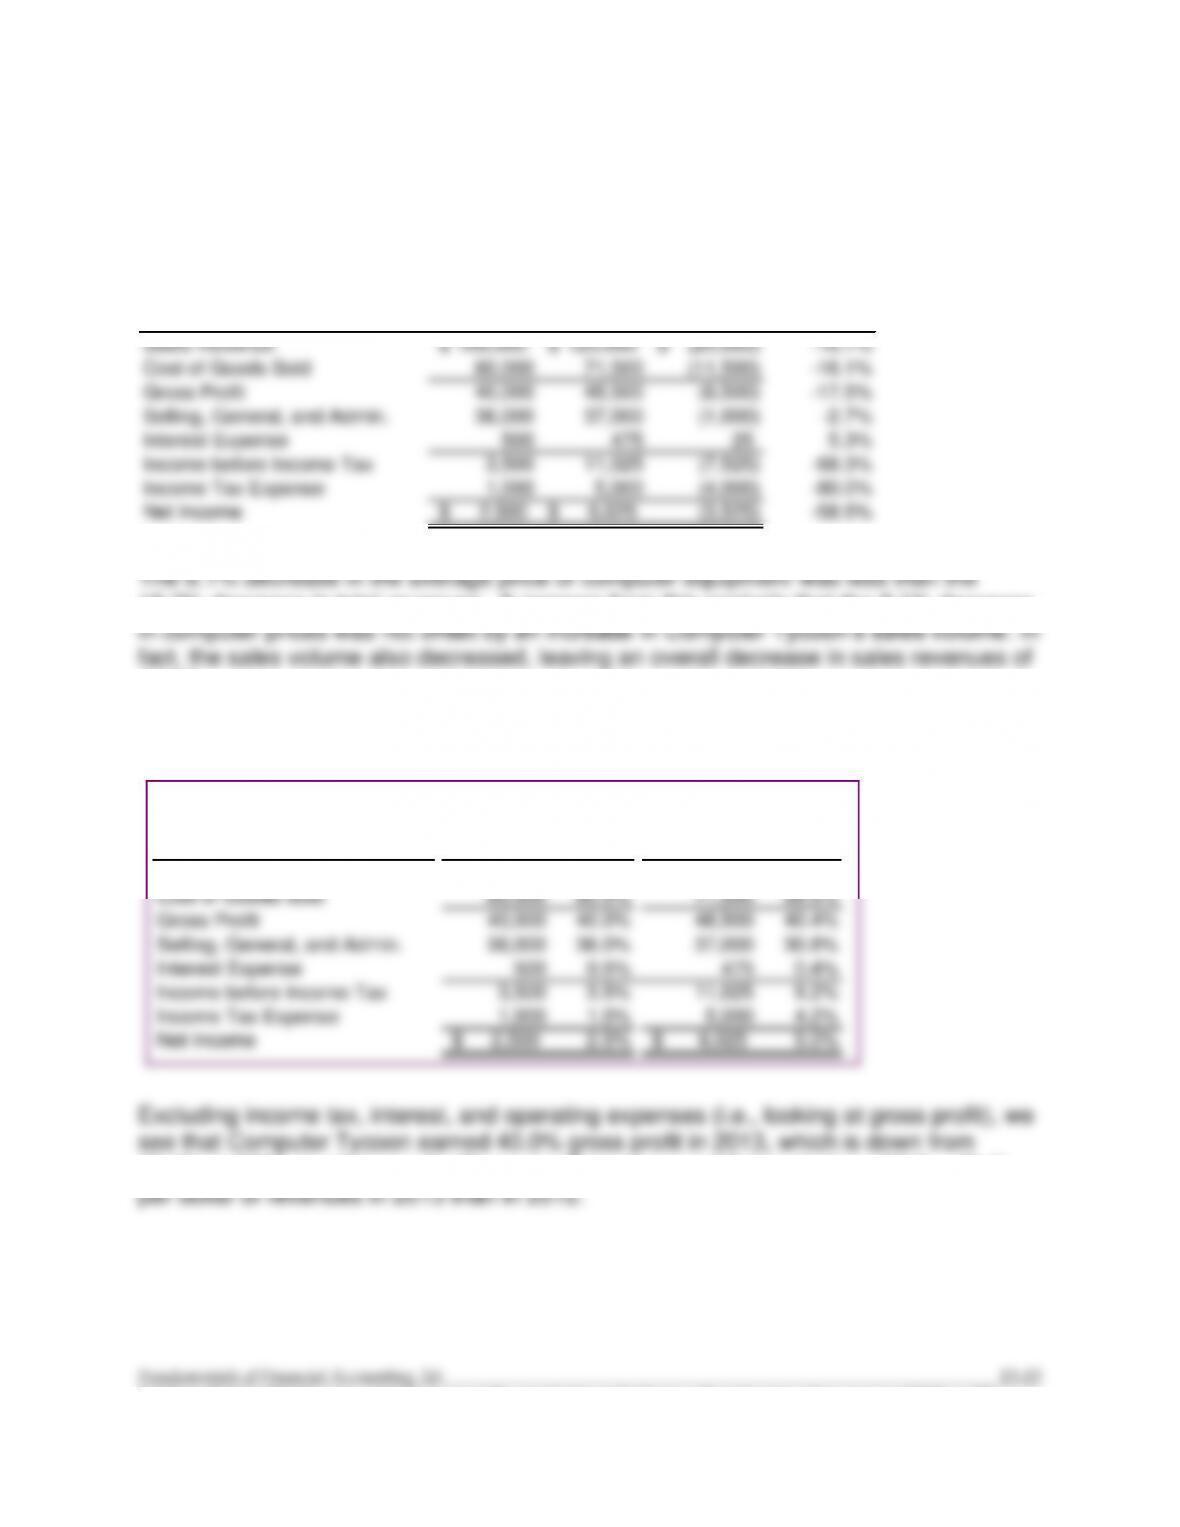
2013 2012 Dollars Percentage
Sales Revenue 100,000$ 120,000$ (20,000)$ -16.7%
Cost of Goods Sold 60,000 71,500 (11,500) -16.1%
Gross Profit 40,000 48,500 (8,500) -17.5%
Selling, General, and Admin. 36,000 37,000 (1,000) -2.7%
Interest Expense 500 475 25 5.3%
Income before Income Tax 3,500 11,025 (7,525) -68.3%
Income Tax Expense 1,000 5,000 (4,000) -80.0%
Net Income 2,500$ 6,025$ (3,525) -58.5%
Income Statements
Year Ended December 31
COMPUTER TYCOON, INC.
Change in
16.7% decrease in total revenues. It appears from this analysis that the 8.1% decrease
16.7%.
Req. 2
Sales Revenue 100,000$ 100.0% 120,000$ 100.0%
Cost of Goods Sold 60,000 60.0% 71,500 59.6%
Gross Profit 40,000 40.0% 48,500 40.4%
Selling, General, and Admin. 36,000 36.0% 37,000 30.8%
Interest Expense 500 0.5% 475 0.4%
Income before Income Tax 3,500 3.5% 11,025 9.2%
Income Tax Expense 1,000 1.0% 5,000 4.2%
Net Income 2,500$ 2.5% 6,025$ 5.0%
COMPUTER TYCOON, INC.
2013
2012
Income Statements
Year Ended December 31
40.4% in 2012. In other words, Computer Tycoon earned 0.4 cents less (40.0 – 40.4)
E13–4
Req. 1
Gross Profit Percentage =
Net Sales Revenue – Cost of Goods Sold
Net Sales Revenue
2012 =
$120,000 – $71,500
=
0.404 or
40.4%
$120,000
2013 =
$100,000 – $60,000
=
0.40 or
40.0%
$100,000
The gross profit percentage of 40.0% means that the company generated 40.0 cents of
=
=
© 2016 by McGraw-Hill Education. All rights reserved. No reproduction or distribution without the prior written consent of McGraw-Hill
Education.
E13–4 (continued)
Req. 3
Fixed Asset Turnover =
Net Revenue
Average Net Fixed Assets
2012 =
$120,000
=
2.66
$45,100
2013 =
$100,000
=
1.85
$54,200
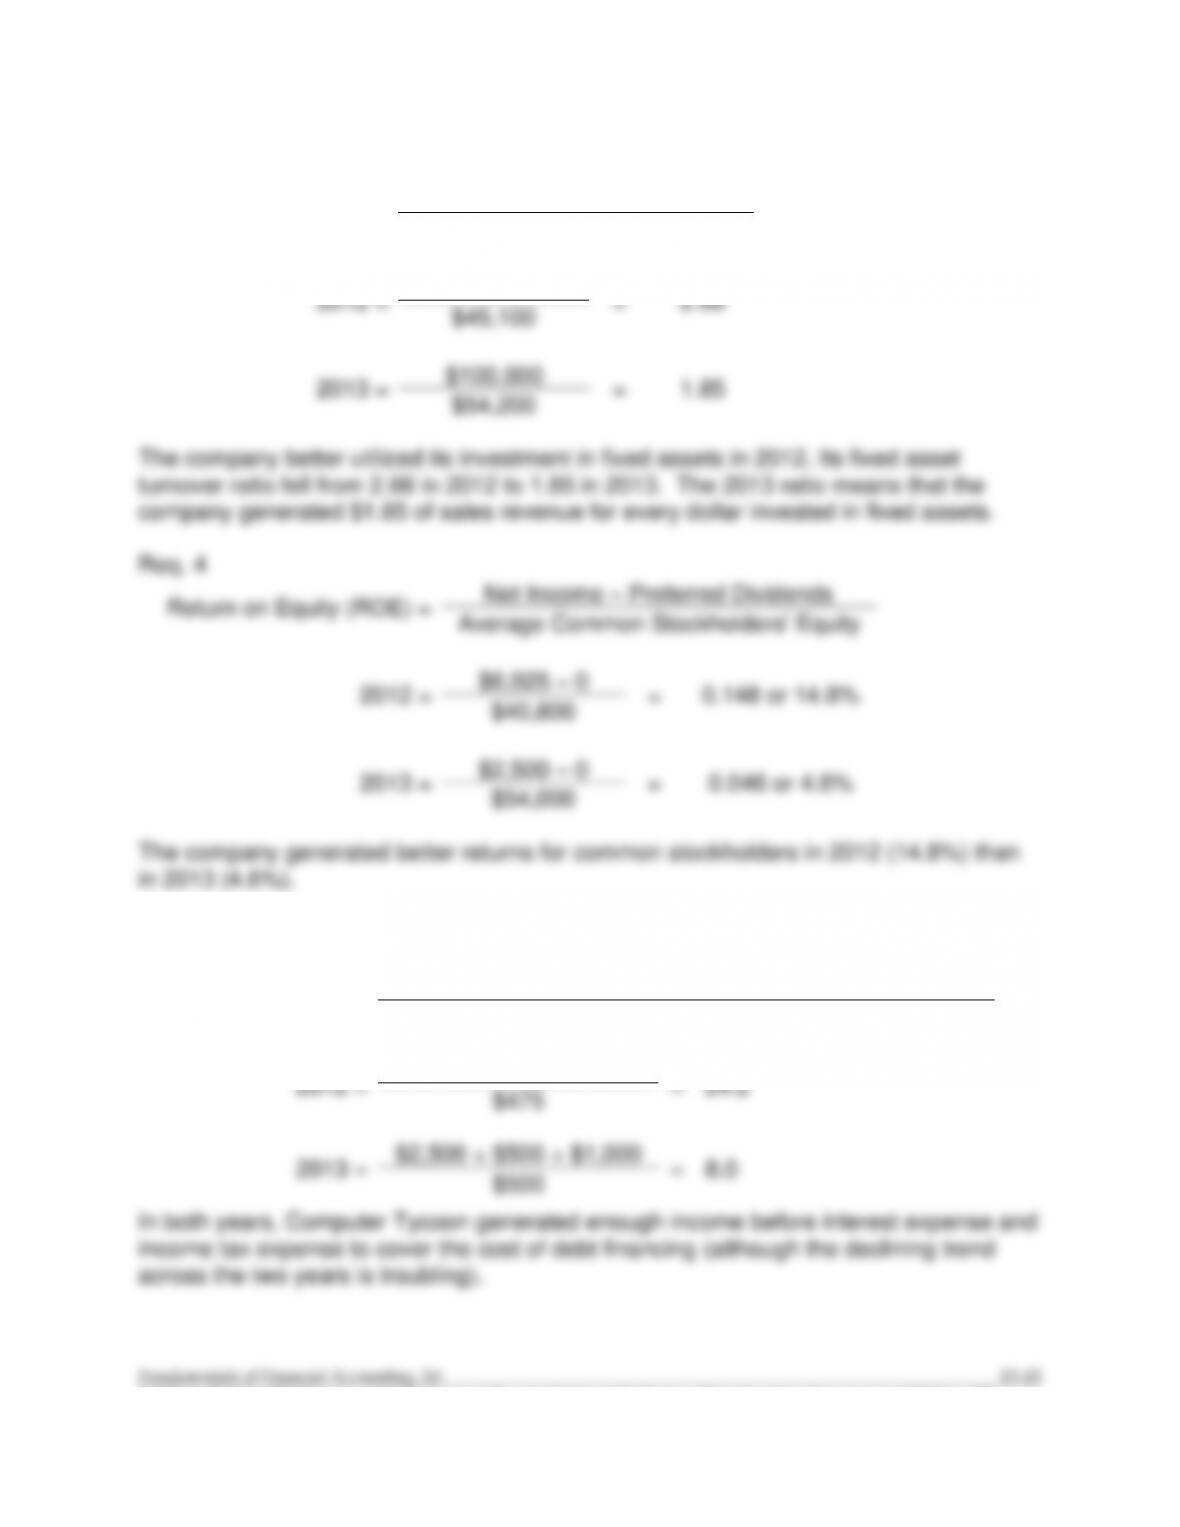
The company better utilized its investment in fixed assets in 2012. Its fixed asset
turnover ratio fell from 2.66 in 2012 to 1.85 in 2013. The 2013 ratio means that the
company generated $1.85 of sales revenue for every dollar invested in fixed assets.
Req. 4
Return on Equity (ROE) =
Net Income – Preferred Dividends
Average Common Stockholders‘ Equity
2012 =
$6,025 – 0
=
0.148 or 14.8%
$40,800
2013 =
$2,500 – 0
=
0.046 or 4.6%
$54,000
The company generated better returns for common stockholders in 2012 (14.8%) than
in 2013 (4.6%).
E13–5
Times Interest
Earned =
Net Income + Interest Expense + Income Tax Expense
Interest Expense
2012 =
$6,025 + $475 + $5,000
=
24.2
$475
2013 =
$2,500 + $500 + $1,000
=
8.0
$500
In both years, Computer Tycoon generated enough income before interest expense and
income tax expense to cover the cost of debt financing (although the declining trend
across the two years is troubling).
E13–6
1)
C
7)
H
2)
A
8)
G
3)
D
9)
I
4)
B
10)
E
5)
K
11)
F
6)
J
E13–7
Req. 1
Receivables turnover ratio = Net credit sales ÷ Average accounts receivable
= $300,000 ÷ [($45,000 + $55,000) ÷ 2]
= 6.0
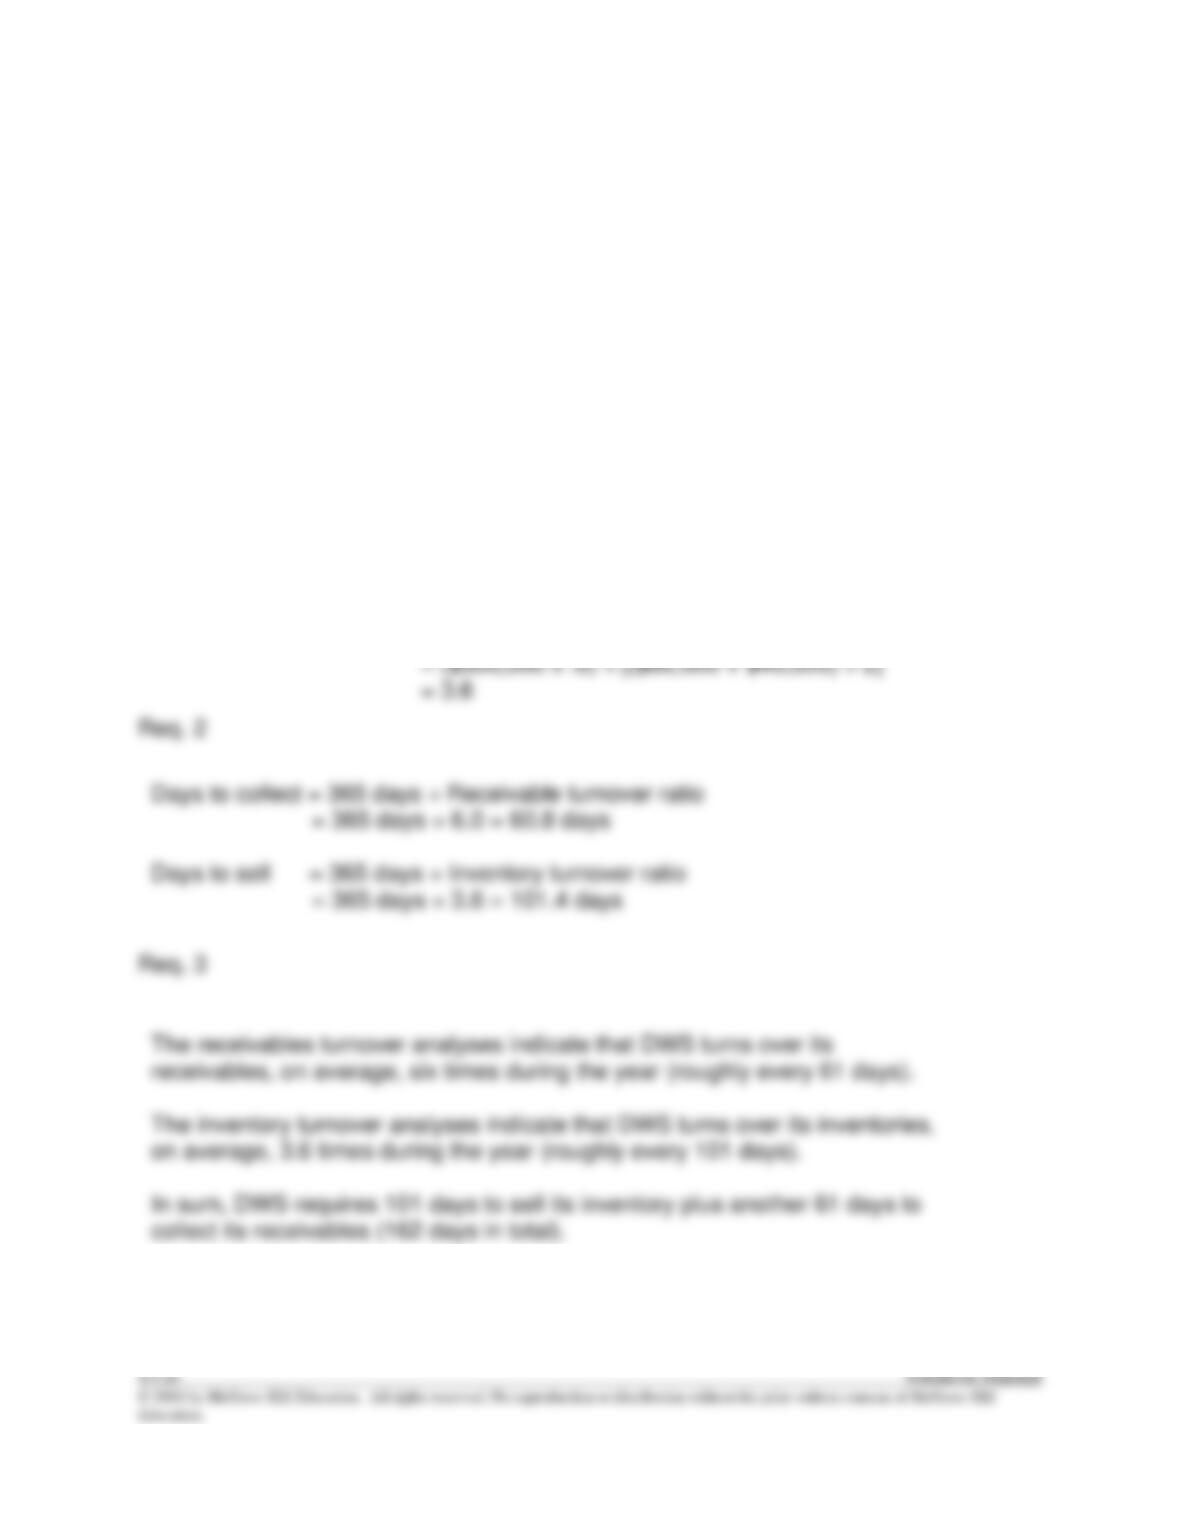
Inventory turnover ratio = Cost of goods sold ÷ average inventory
= ($300,000 x .6) ÷ [($60,000 + $40,000) ÷ 2]
= 3.6
© 2016 by McGraw-Hill Education. All rights reserved. No reproduction or distribution without the prior written consent of McGraw-Hill
Education.
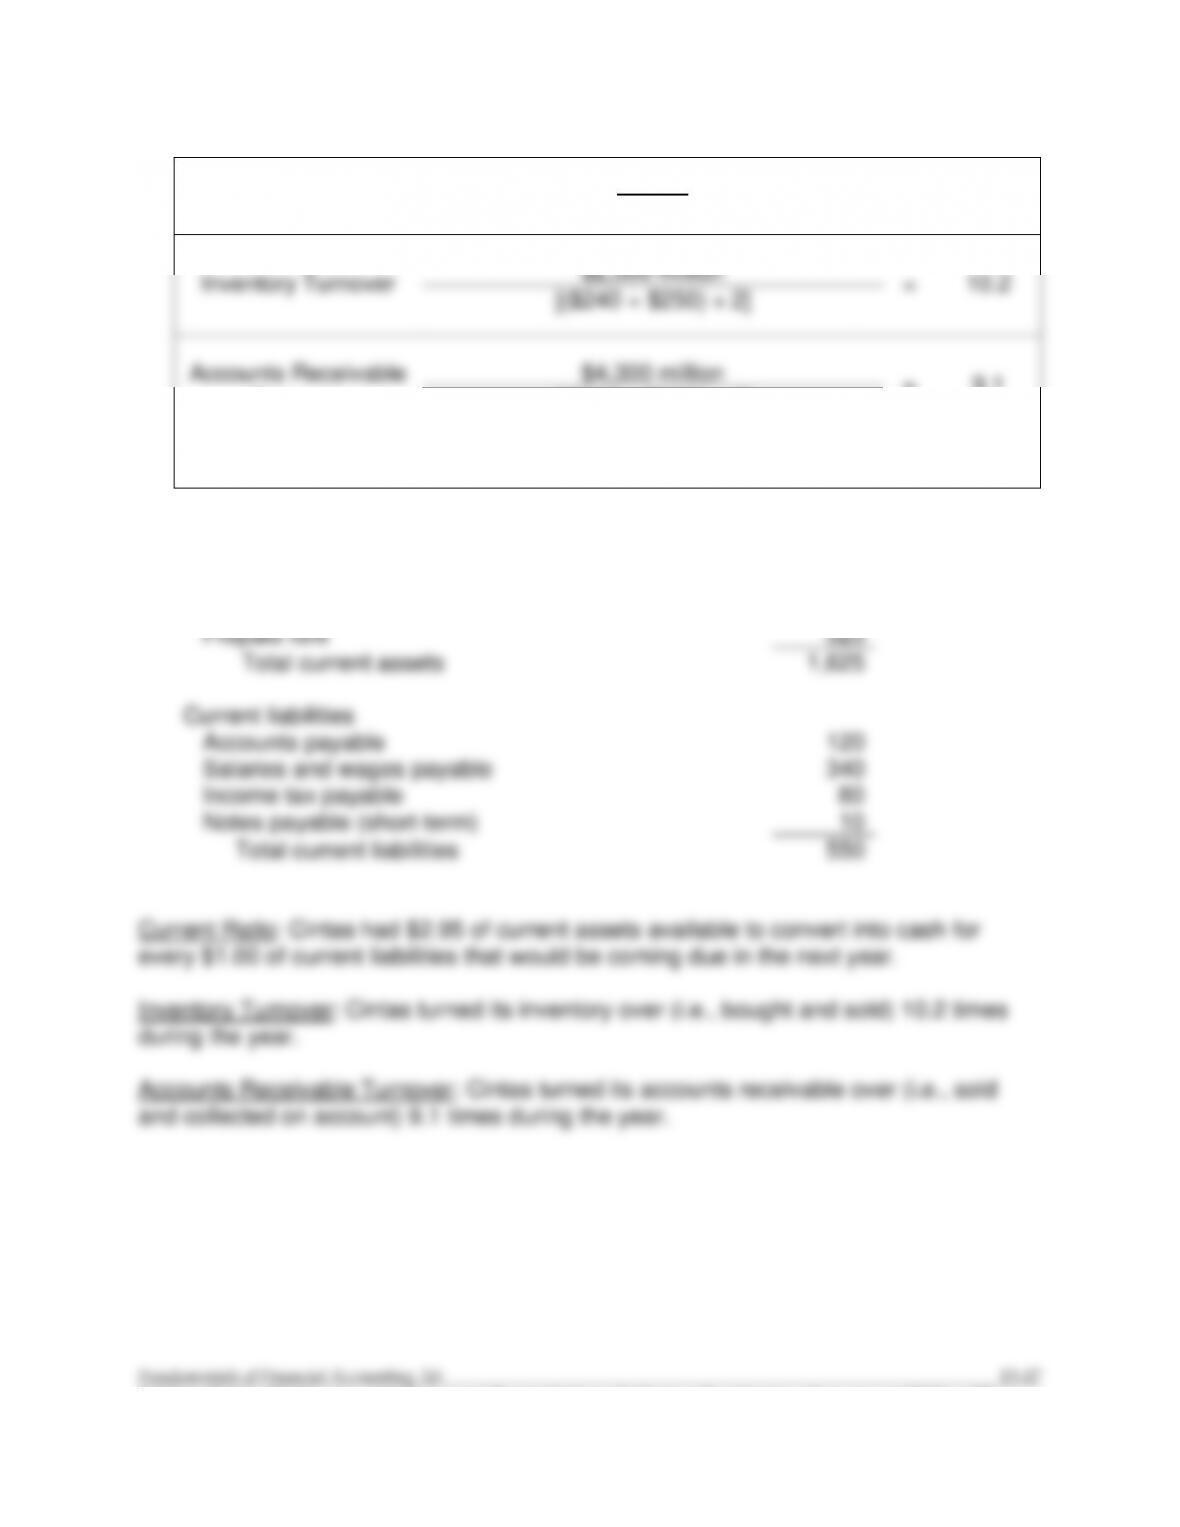
E13–8
Current Ratio
$1,625
$550
=
2.95
Inventory Turnover
$2,500 million
=
10.2
[($240 + $250) ÷ 2]
Accounts Receivable
Turnover
$4,300 million
=
9.1
[($500 + $450) ÷ 2]
Current Assets:
Cash
$ 360
Accounts receivable
500
Inventory
240
Prepaid rent
525
Total current assets
1,625
Current liabilities
Accounts payable
120
Salaries and wages payable
340
Income tax payable
80
Notes payable (short-term)
10
Total current liabilities
550
(See below)
E13–9
Req. 1
Receivables turnover ratio = Net credit sales ÷ Average accounts receivable
= $84,000 ÷ [($6,100 + $6,500) ÷ 2]
= 13.3
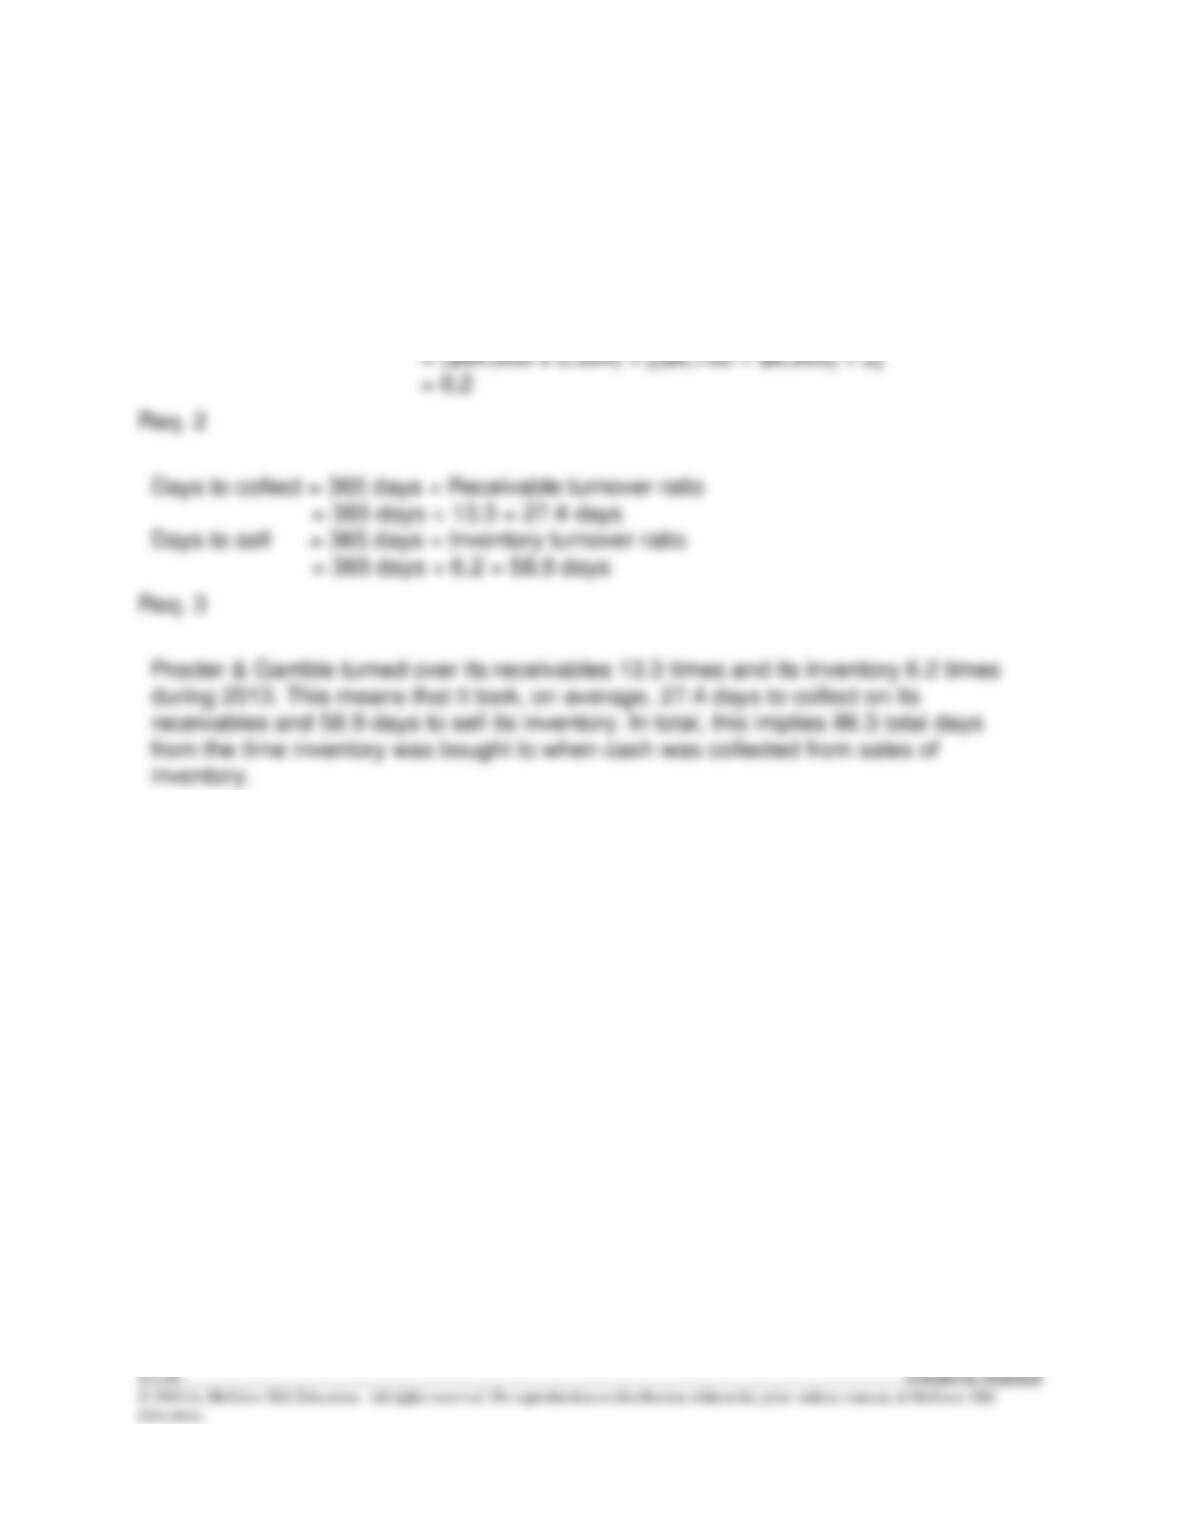
Inventory turnover ratio = Cost of goods sold ÷ Average inventory
= ($84,000 x 0.504) ÷ [($6,700 + $6,900) ÷ 2]
= 6.2
Days to collect = 365 days ÷ Receivable turnover ratio
= 365 days ÷ 13.3 = 27.4 days
Days to sell = 365 days ÷ Inventory turnover ratio
= 365 days ÷ 6.2 = 58.9 days
Req. 3
Procter & Gamble turned over its receivables 13.3 times and its inventory 6.2 times
during 2013. This means that it took, on average, 27.4 days to collect on its
receivables and 58.9 days to sell its inventory. In total, this implies 86.3 total days
from the time inventory was bought to when cash was collected from sales of
inventory.
© 2016 by McGraw-Hill Education. All rights reserved. No reproduction or distribution without the prior written consent of McGraw-Hill
Education.
E13–10
Req. 1
Gross profit percentage = (Net sales – Cost of goods sold) ÷ Net sales
8.41 x $2,080,000,000 = Net sales
4.89 = Cost of goods sold ÷ $2,475,000,000
4.89 x $2,475,000,000 = Cost of goods sold
$12,102,750,000 = Cost of goods sold
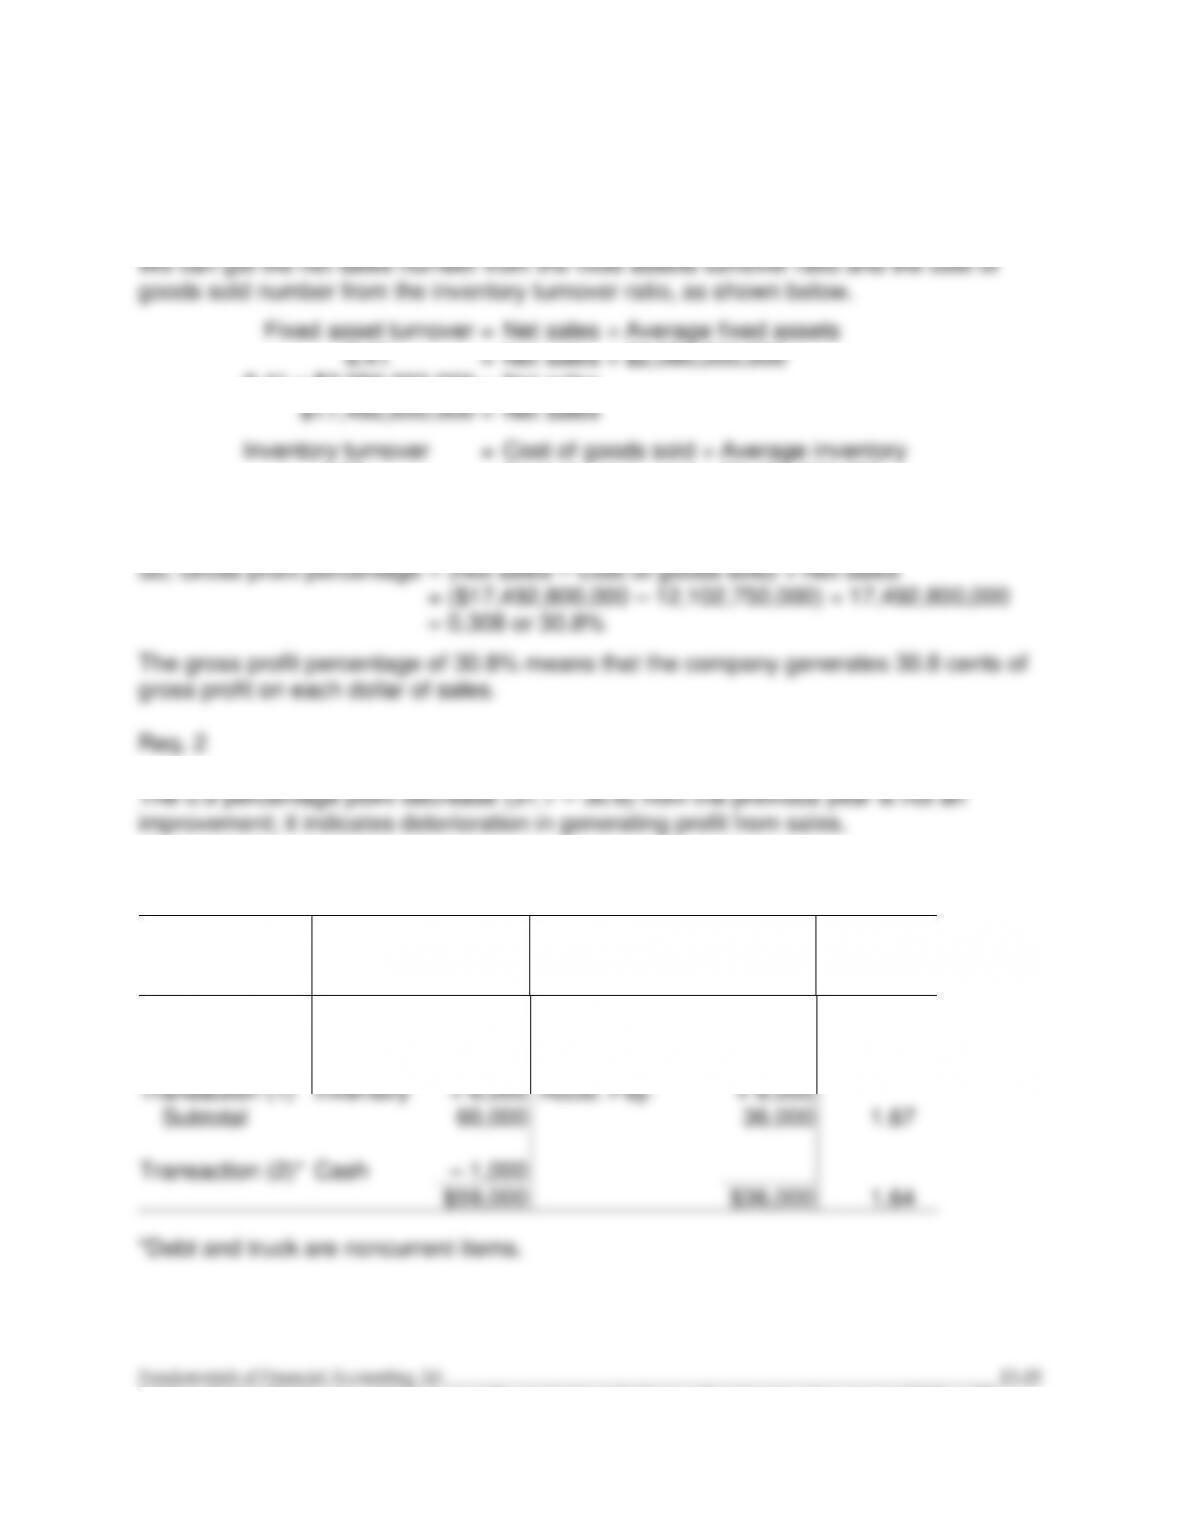
E13–11
Current Assets
(CA)
Current Liabilities
(CL)
Current
Ratio
(CA ÷ CL)
Start
$54,000
($54,000 ÷ 1.8)
$30,000
1.80
Transaction (1)
Inventory
+ 6,000
Accts. Pay.
+ 6,000
Subtotal
60,000
36,000
1.67
Transaction (2)*
Cash
– 1,000
$59,000
$36,000
1.64
*Debt and truck are noncurrent items.
E13–12
Effect on:
Current Assets
Current Liabilities
Current Ratio
1.
Increase
No change
Increase
2.
No change
Increase
Decrease
3.
Decrease
No change
Decrease
4.
Increase
No change
Increase
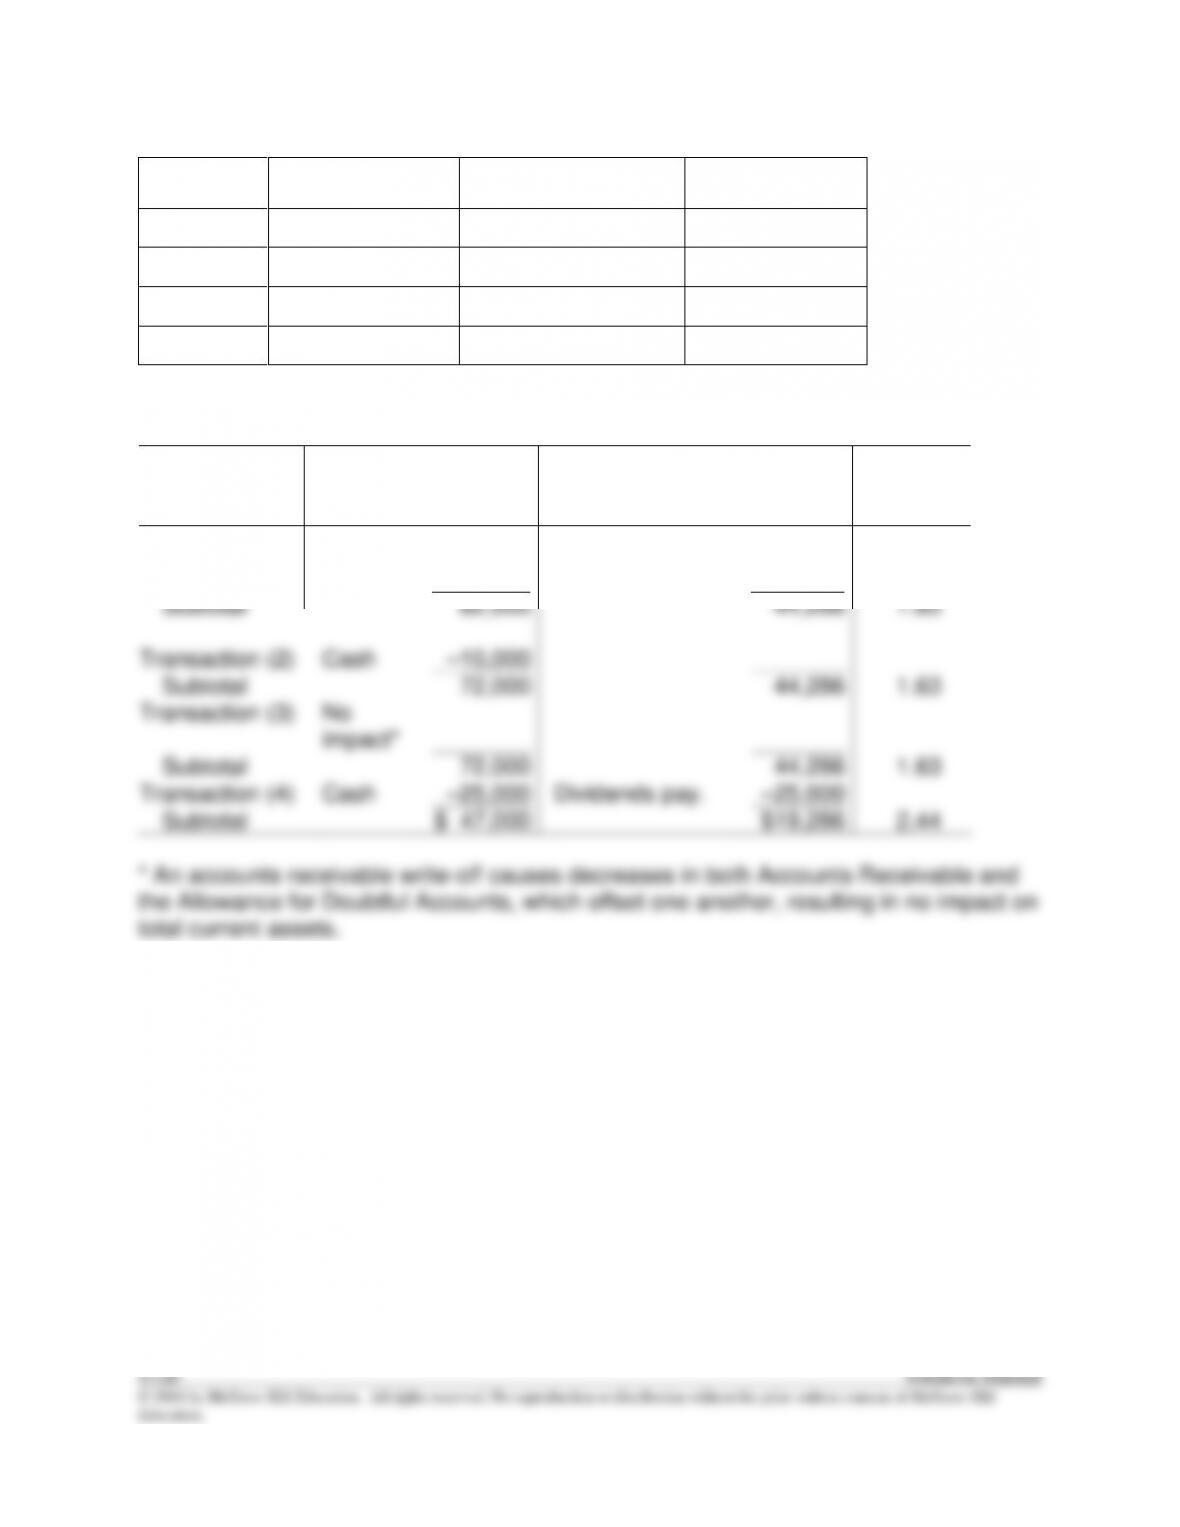
E13–13
Current Assets
(CA)
Current Liabilities
(CL)
Current
Ratio
(CA ÷ CL)
Start
$88,000
($88,000 ÷ 1.75)
$50,286
1.75
Transaction (1)
Cash
–6,000
Accts. pay.
–6,000
Subtotal
82,000
44,286
1.85
Transaction (2)
Cash
–10,000
Subtotal
72,000
44,286
1.63
Transaction (3)
No
impact*
Subtotal
72,000
44,286
1.63
Transaction (4)
Cash
–25,000
Dividends pay.
–25,000
Subtotal
$ 47,000
$19,286
2.44
* An accounts receivable write-off causes decreases in both Accounts Receivable and
the Allowance for Doubtful Accounts, which offset one another, resulting in no impact on
total current assets.