© 2016 by McGraw-Hill Education. All rights reserved. No reproduction or distribution without the prior written consent of McGraw-Hill
Education.
Chapter 13
1. Trend analysis compares individual financial statement line items over time, with the
2. A year-over-year percentage simply expresses the change in the current year as a
percentage of the prior year total, using the following calculation:
Year-over-
year
change (%)
=
Change this year
x
100
=
(Current year’s total – prior year’s total)
x
100
Prior year’s total
Prior year’s total
3. Ratio analysis is conducted to understand relationships among various items
reported in the financial statements. It involves comparing an amount for one or
5. The three categories of performance into which most financial ratios are reported
include:
(2) Liquidity – relates to the company’s short-term survival. The specific focus is
(3) Solvency – relates to the company’s long–run survival. The specific focus is
6. The names “horizontal” and “vertical” represent the direction to which a financial
statement item is compared. Horizontal analyses involve comparing an item
7. A favorable interpretation of an increase in the current ratio is that the company has
8. The decrease in inventory turnover and increase in the current ratio suggests a
9. An increase in Gross Profit could be caused by either (or both) an increase in sales
volume and an increase in gross profit per sale. This year, net Sales increased by
$100,000 ($400,000 – $300,000), which is an increase of 33.3 percent ($100,000 ÷
10. The following explanations are based on typical circumstances: (a) an increase in
gross profit percentage would be favorable because it implies greater profit per
dollar of sales, (b) a decrease in the inventory turnover ratio would be unfavorable
11. The two essential characteristics of useful financial information are relevance and
12. The primary objective of financial reporting is to provide useful financial information
about a business to help external users make decisions.
13. The principle of full disclosure is that financial reports should present all information
that is needed to properly interpret the results of the company’s business activities.
14. The going-concern assumption states that a business is assumed capable of
continuing its operations long enough to meet its obligations. A going-concern
problem arises if a company runs into severe financial difficulty, casting substantial
doubt on the ability of the company to continue its operations long enough to meet
15. If reported, the financial results of discontinued operations appear on the income
16. The inventory costing method will differ because IFRS prohibits LIFO, but since
GAAP allows LIFO, Techgear has chosen to use LIFO. Differences between
inventory costing methods affect Inventory, Cost of Goods Sold, Gross Profit, and
Net Income. Consequently, the following ratios will be affected: net profit margin,
gross profit percentage, return on equity, earnings per share, price/earnings,
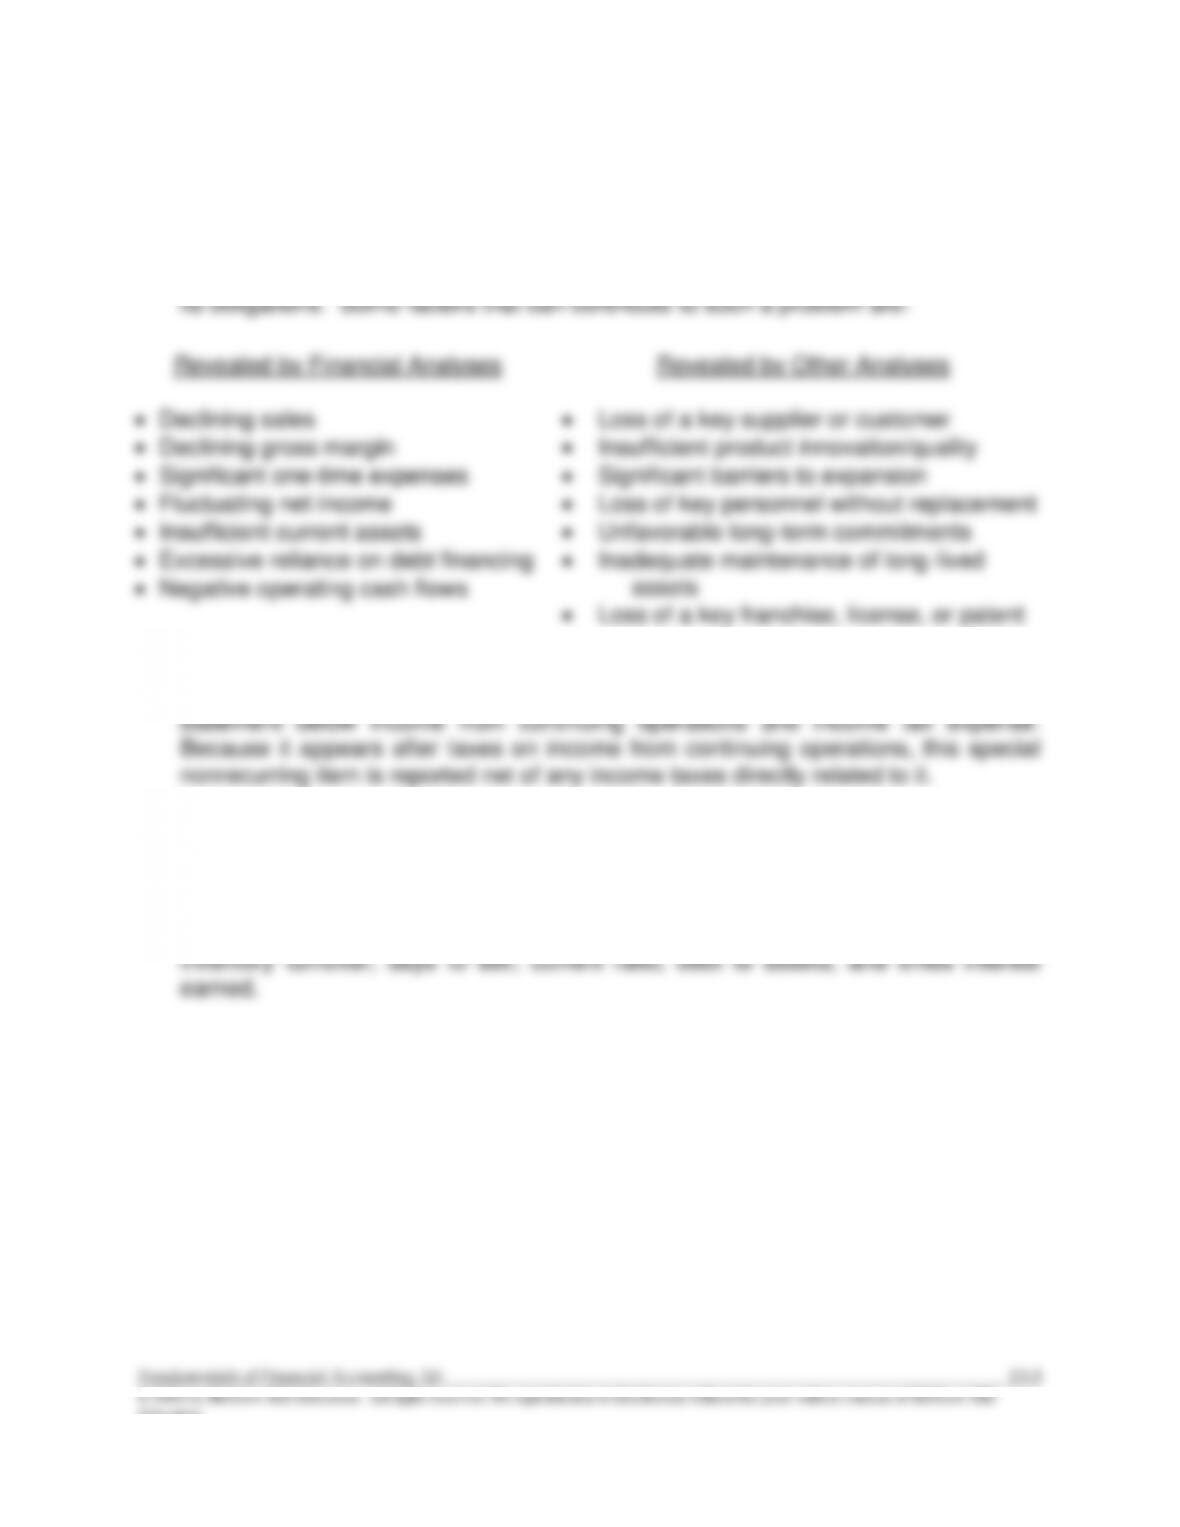
Revealed by Financial Analyses
Revealed by Other Analyses
• Declining sales
• Declining gross margin
• Significant one-time expenses
• Fluctuating net income
• Insufficient current assets
• Excessive reliance on debt financing
• Negative operating cash flows
• Loss of a key supplier or customer
• Insufficient product innovation/quality
• Significant barriers to expansion
• Loss of key personnel without replacement
• Unfavorable long-term commitments
• Inadequate maintenance of long-lived
assets
• Loss of a key franchise, license, or patent
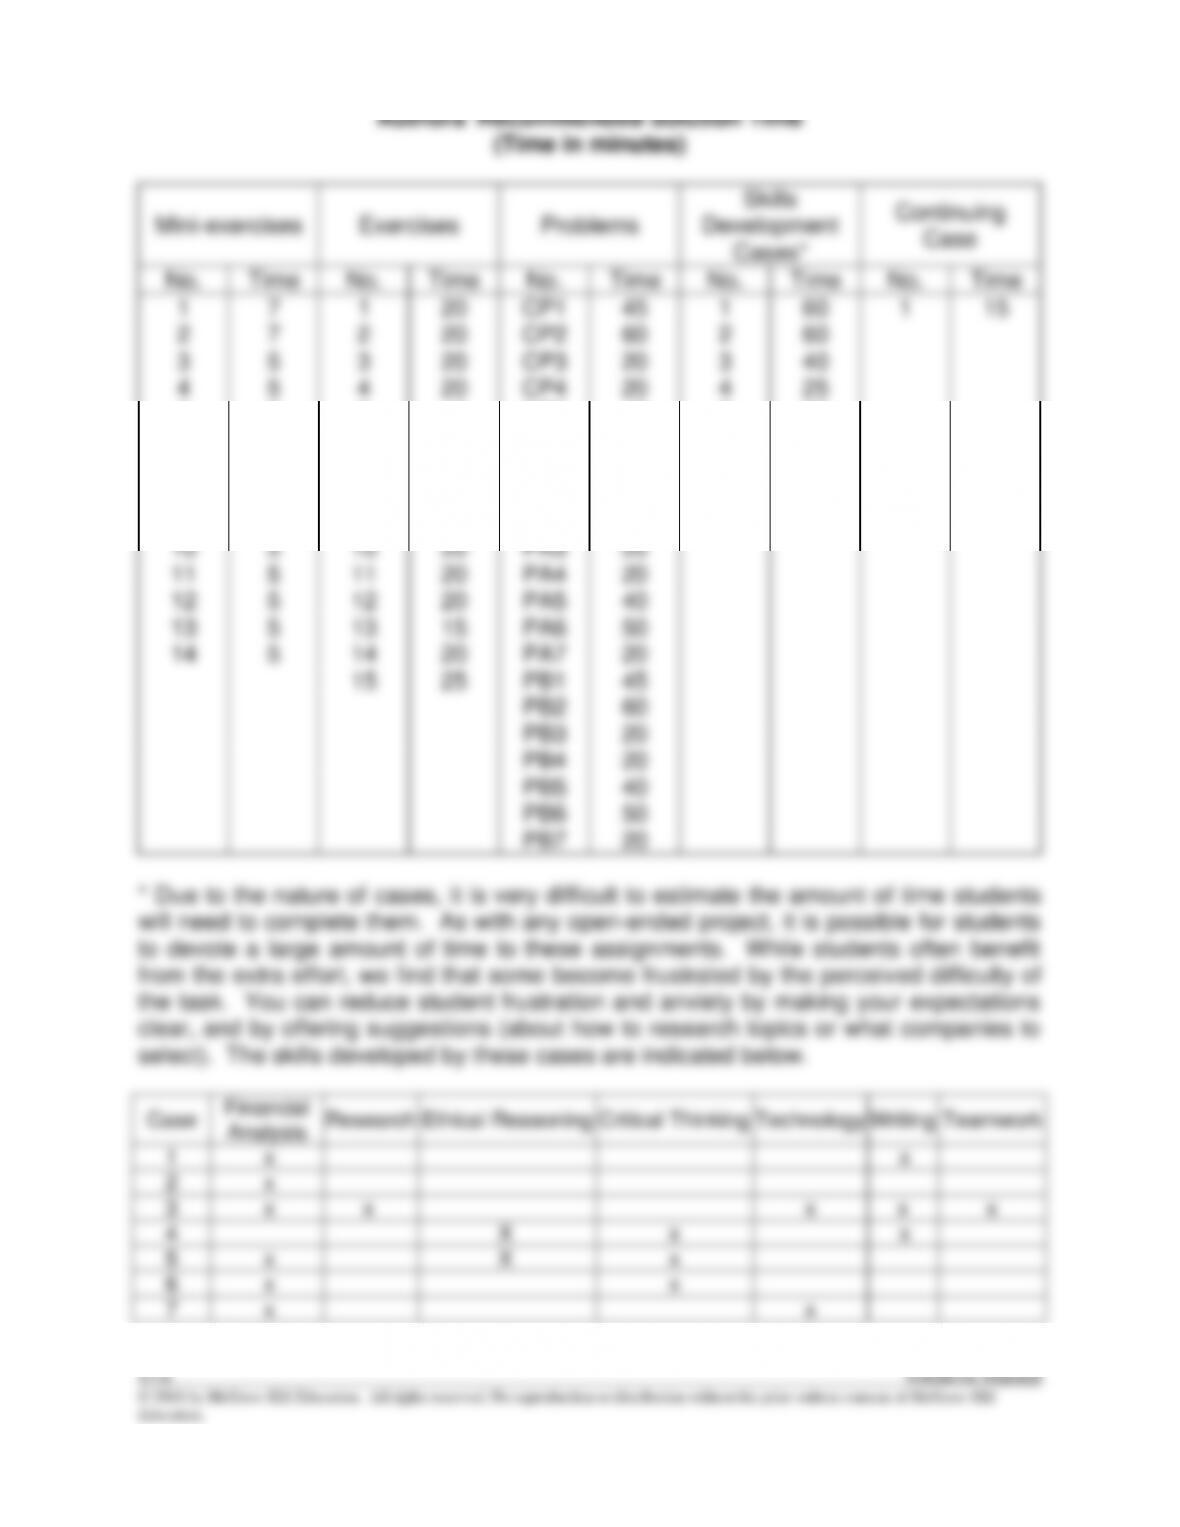
Authors’ Recommended Solution Time
(Time in minutes)
Mini-exercises
Exercises
Problems
Skills
Development
Cases*
Continuing
Case
No.
Time
No.
Time
No.
Time
No.
Time
No.
Time
1
7
1
20
CP1
45
1
60
1
15
2
7
2
20
CP2
60
2
60
3
5
3
20
CP3
20
3
40
4
5
4
20
CP4
20
4
25
5
5
5
10
CP5
40
5
25
6
5
6
10
CP6
50
6
25
7
5
7
10
CP7
20
7
20
8
5
8
20
PA1
45
9
5
9
10
PA2
60
10
5
10
20
PA3
20
11
5
11
20
PA4
20
12
5
12
20
PA5
40
13
5
13
15
PA6
50
14
5
14
20
PA7
20
15
25
PB1
45
PB2
60
PB3
20
PB4
20
PB5
40
PB6
50
PB7
20
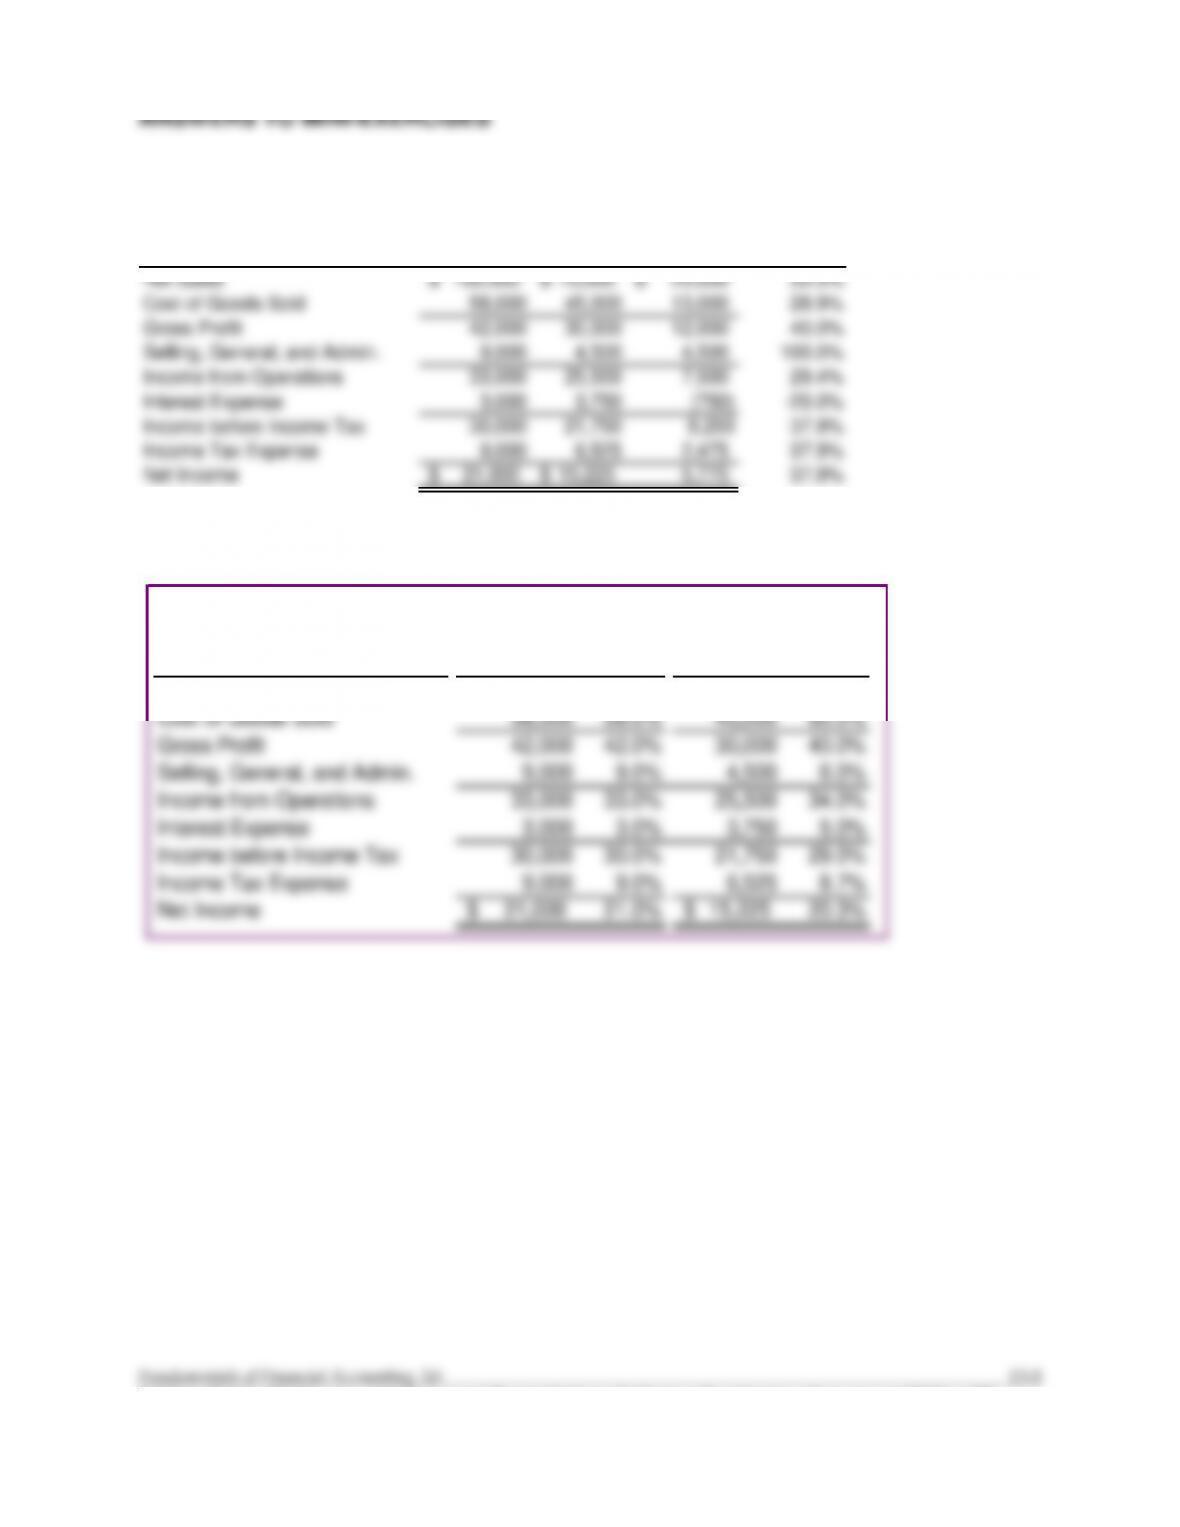
M13–1
Current Previous Dollars Percentage
Net Sales 100,000$ 75,000$ 25,000$ 33.3%
Cost of Goods Sold 58,000 45,000 13,000 28.9%
Gross Profit 42,000 30,000 12,000 40.0%
Selling, General, and Admin. 9,000 4,500 4,500 100.0%
Income from Operations 33,000 25,500 7,500 29.4%
Interest Expense 3,000 3,750 (750) -20.0%
Income before Income Tax 30,000 21,750 8,250 37.9%
Income Tax Expense 9,000 6,525 2,475 37.9%
Net Income 21,000$ 15,225$ 5,775 37.9%
Income Statements
Year Ended December 31
LOCKEY FENCING CORPORATION
Change in
M13–2
Net Sales 100,000$ 100.0% 75,000$ 100.0%
Cost of Goods Sold 58,000 58.0% 45,000 60.0%
Gross Profit 42,000 42.0% 30,000 40.0%
Selling, General, and Admin. 9,000 9.0% 4,500 6.0%
Income from Operations 33,000 33.0% 25,500 34.0%
Interest Expense 3,000 3.0% 3,750 5.0%
Income before Income Tax 30,000 30.0% 21,750 29.0%
Income Tax Expense 9,000 9.0% 6,525 8.7%
Net Income 21,000$ 21.0% 15,225$ 20.3%
LOCKEY FENCING CORPORATION
Current
Previous
Income Statements
Year Ended December 31
M13–3
The two most significant year-over-year changes, in terms of dollar amounts, are the
increase in net sales (+$25,000) and increase in cost of goods sold (+$13,000). In terms
of percentages, the two most significant changes are the increases in gross profit
(+40%) and selling, general, and administrative expenses (+100%).
M13–4
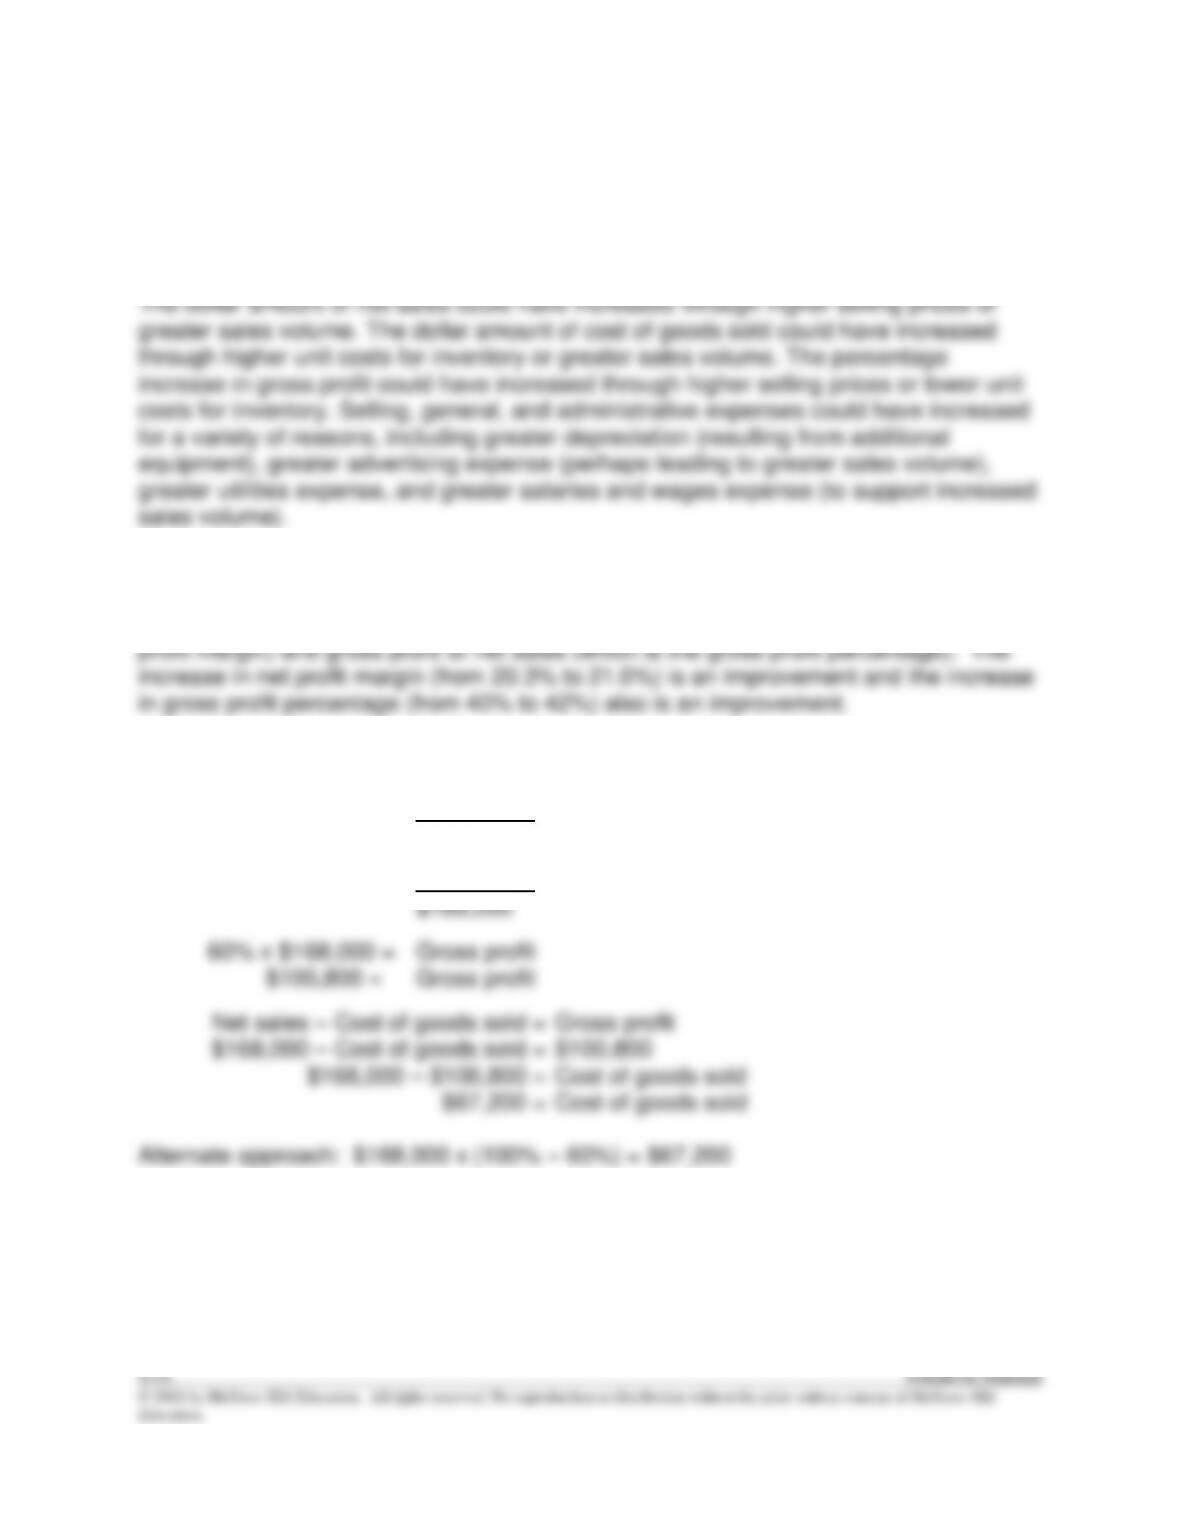
The vertical analyses include comparisons of net income to net sales (which is the net
M13–5
Gross profit percentage = Gross profit
Net sales
So, 60% = Gross profit
© 2016 by McGraw-Hill Education. All rights reserved. No reproduction or distribution without the prior written consent of McGraw-Hill
Education.
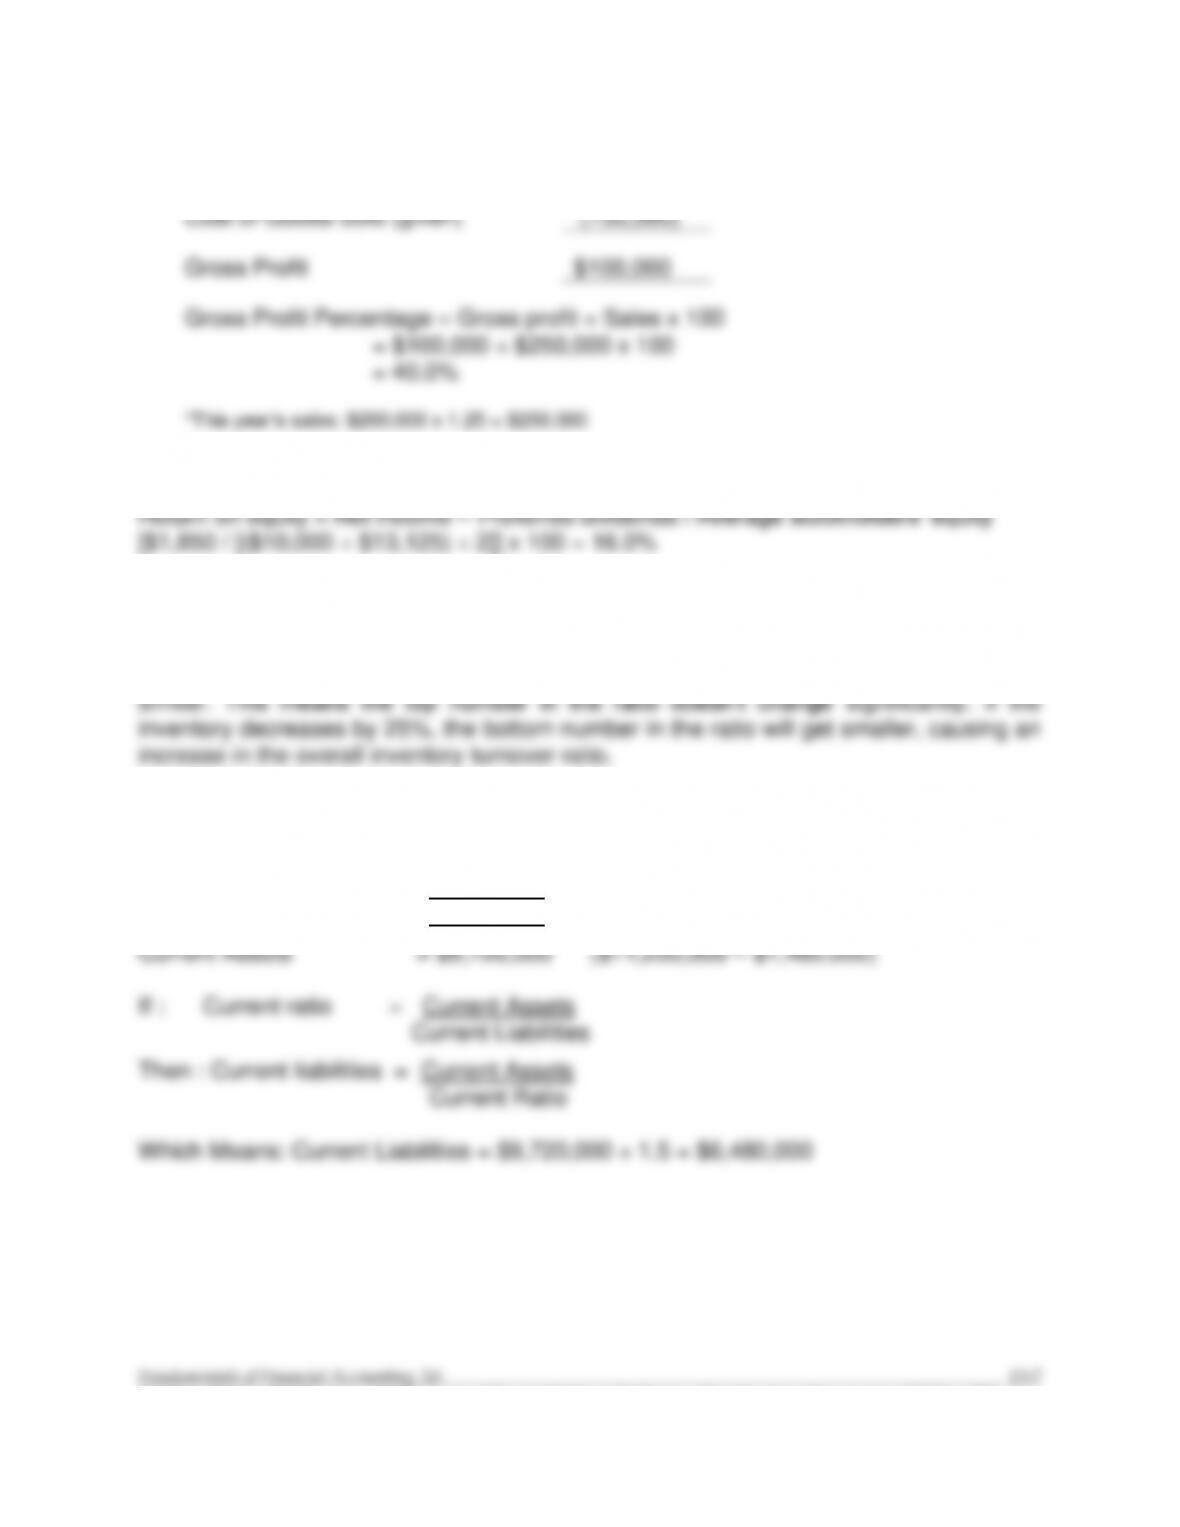
M13–6
Sales
$250,000 *
Cost of Goods Sold (given)
(150,000)
Gross Profit
$100,000
Gross Profit Percentage = Gross profit ÷ Sales x 100
= $100,000 ÷ $250,000 x 100
= 40.0%
*This year’s sales: $200,000 x 1.25 = $250,000
M13–7
M13–8
The inventory turnover ratio is calculated as cost of goods sold divided by average
inventory. If the sales volume remains the same, then the cost of goods sold will also be
M13–9
Current Assets $ X
+ Noncurrent Assets + 1,480,000
Total Assets =11,200,000
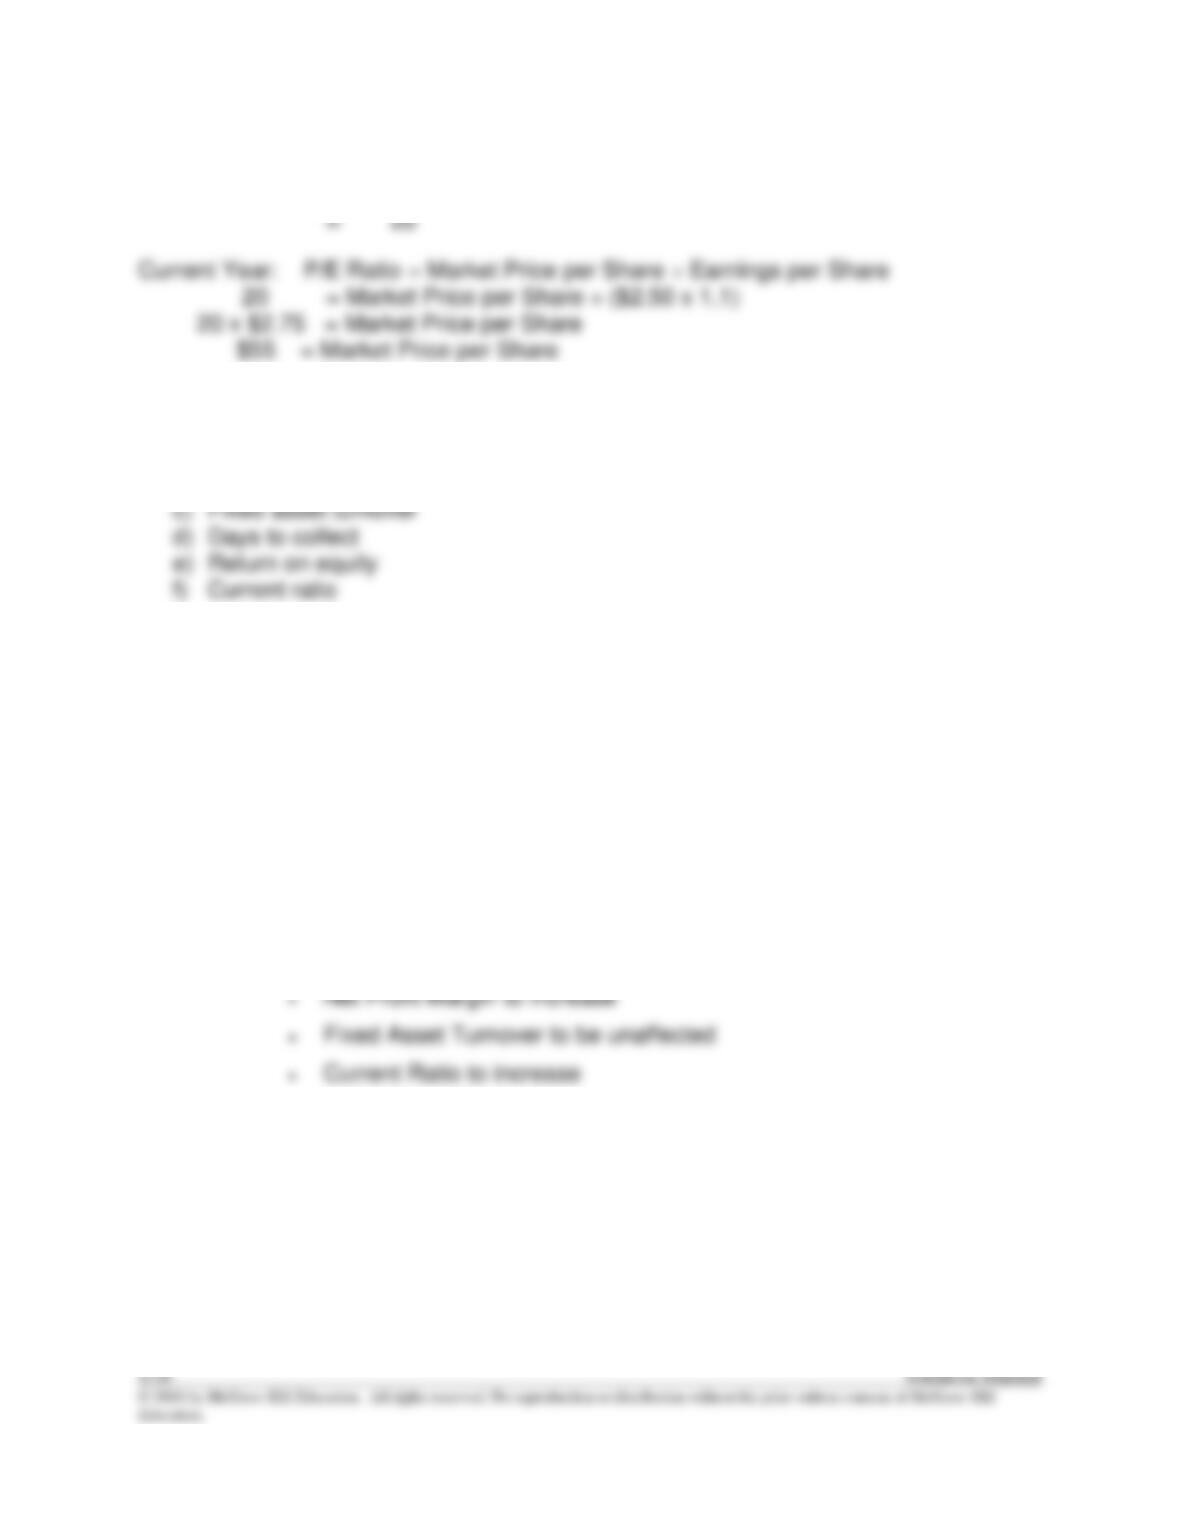
M13–10
Previous Year: P/E Ratio = Market Price per Share ÷ Earnings per Share
= $50.00 ÷ $2.50
M13–11
a) Net profit margin
b) Debt-to-assets ratio
M13–12
a) Good
b) Good
c) Good
d) Bad
e) Good
M13–13
In most circumstances when costs are falling, a change from FIFO to LIFO will cause
inventory to increase and cost of good sold to decrease. These changes cause:
• Net Profit Margin to increase
• Fixed Asset Turnover to be unaffected
• Current Ratio to increase
Education.
M13–14
1. a) straight-line yields lower depreciation, which yields higher net income and net
2. a) FIFO yields lower cost of goods sold when costs and inventory levels are
3. a) 7-year useful life yields lower depreciation, which yields higher net income and
net profit margin
13-10 Solutions Manual
© 2016 by McGraw-Hill Education. All rights reserved. No reproduction or distribution without the prior written consent of McGraw-Hill
ANSWERS TO EXERCISES
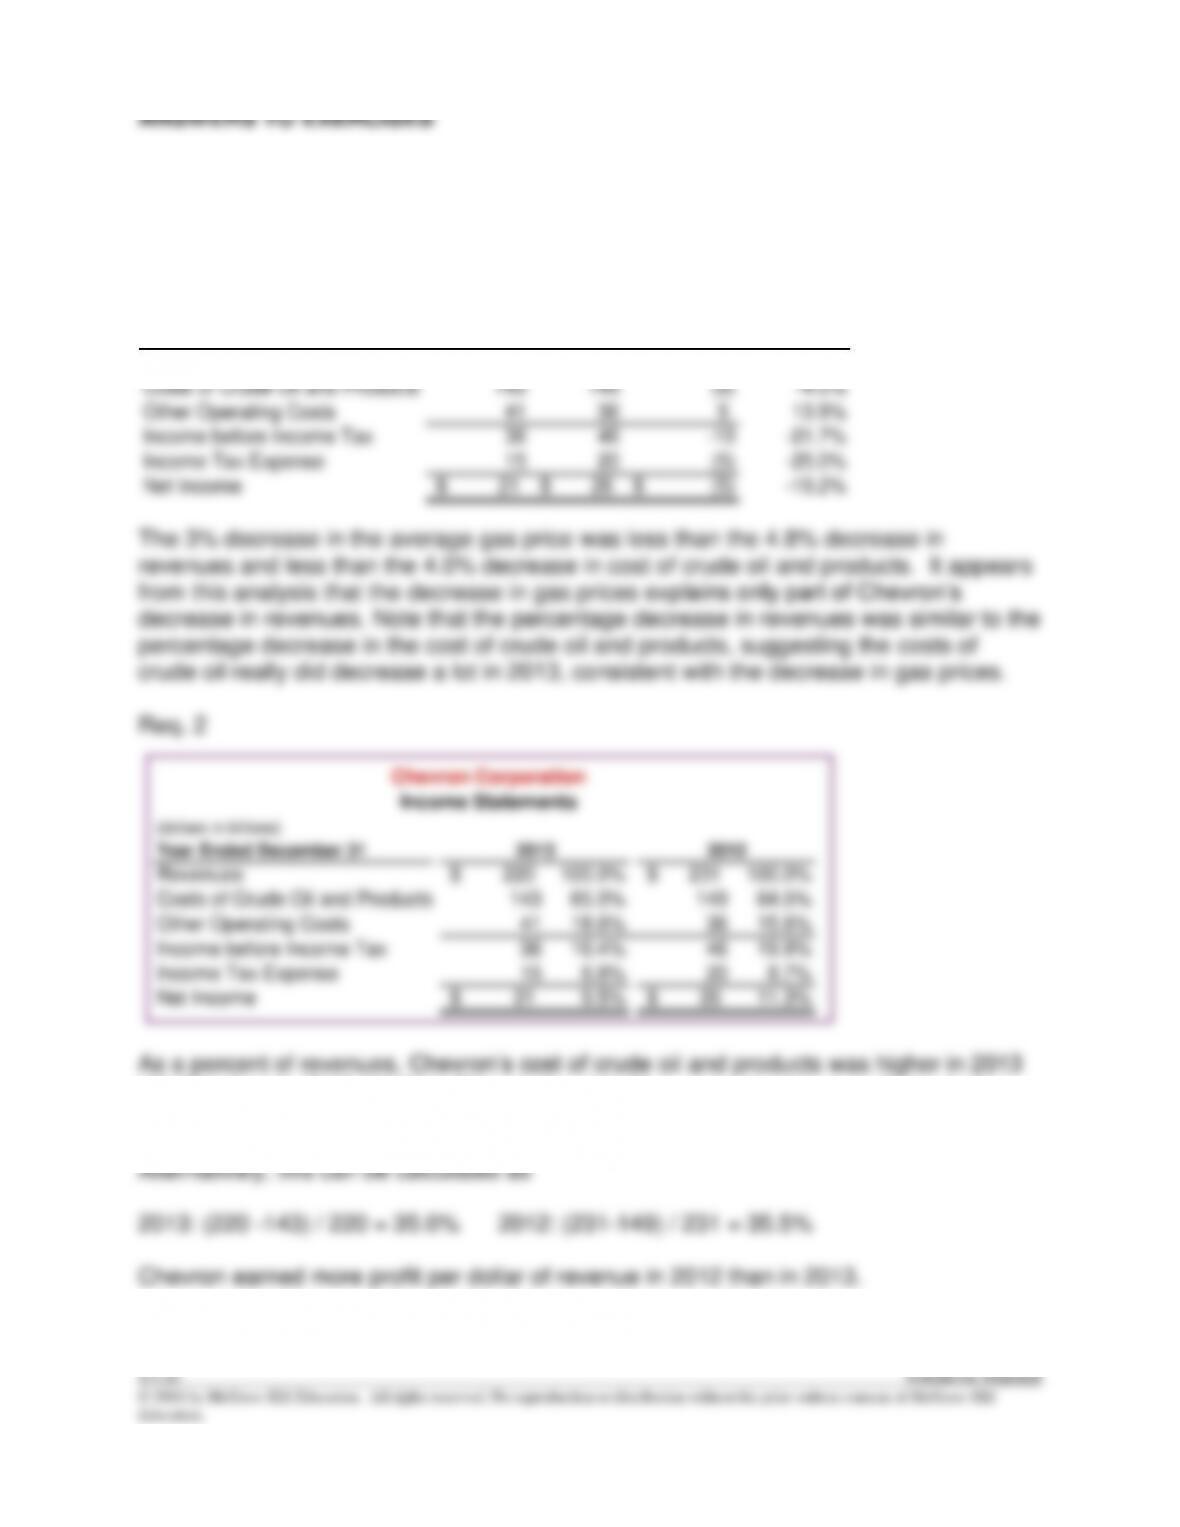
E13–1
Req. 1
(dollars in billions)
2013 2012 Dollars Percentage
Revenues 220$ 231$ (11)$ –4.8%
Costs of Crude Oil and Products 143 149 (6) -4.0%
Other Operating Costs 41 36 5 13.9%
Income before Income Tax 36 46 -10 -21.7%
Income Tax Expense 15 20 (5) -25.0%
Net Income 21$ 26$ (5)$ -19.2%
Income Statements
Year Ended December 31
Chevron Corporation
Change in
(65.0%) than in 2012 (64.5%). This implies that Chevron earned less profit (excluding
income tax and other operating costs) per dollar of revenues in 2013 than in 2012.