© 2016 by McGraw-Hill Education. All rights reserved. No reproduction or distribution without the prior written consent of McGraw-Hill
Education.
S10–2
Req. 1
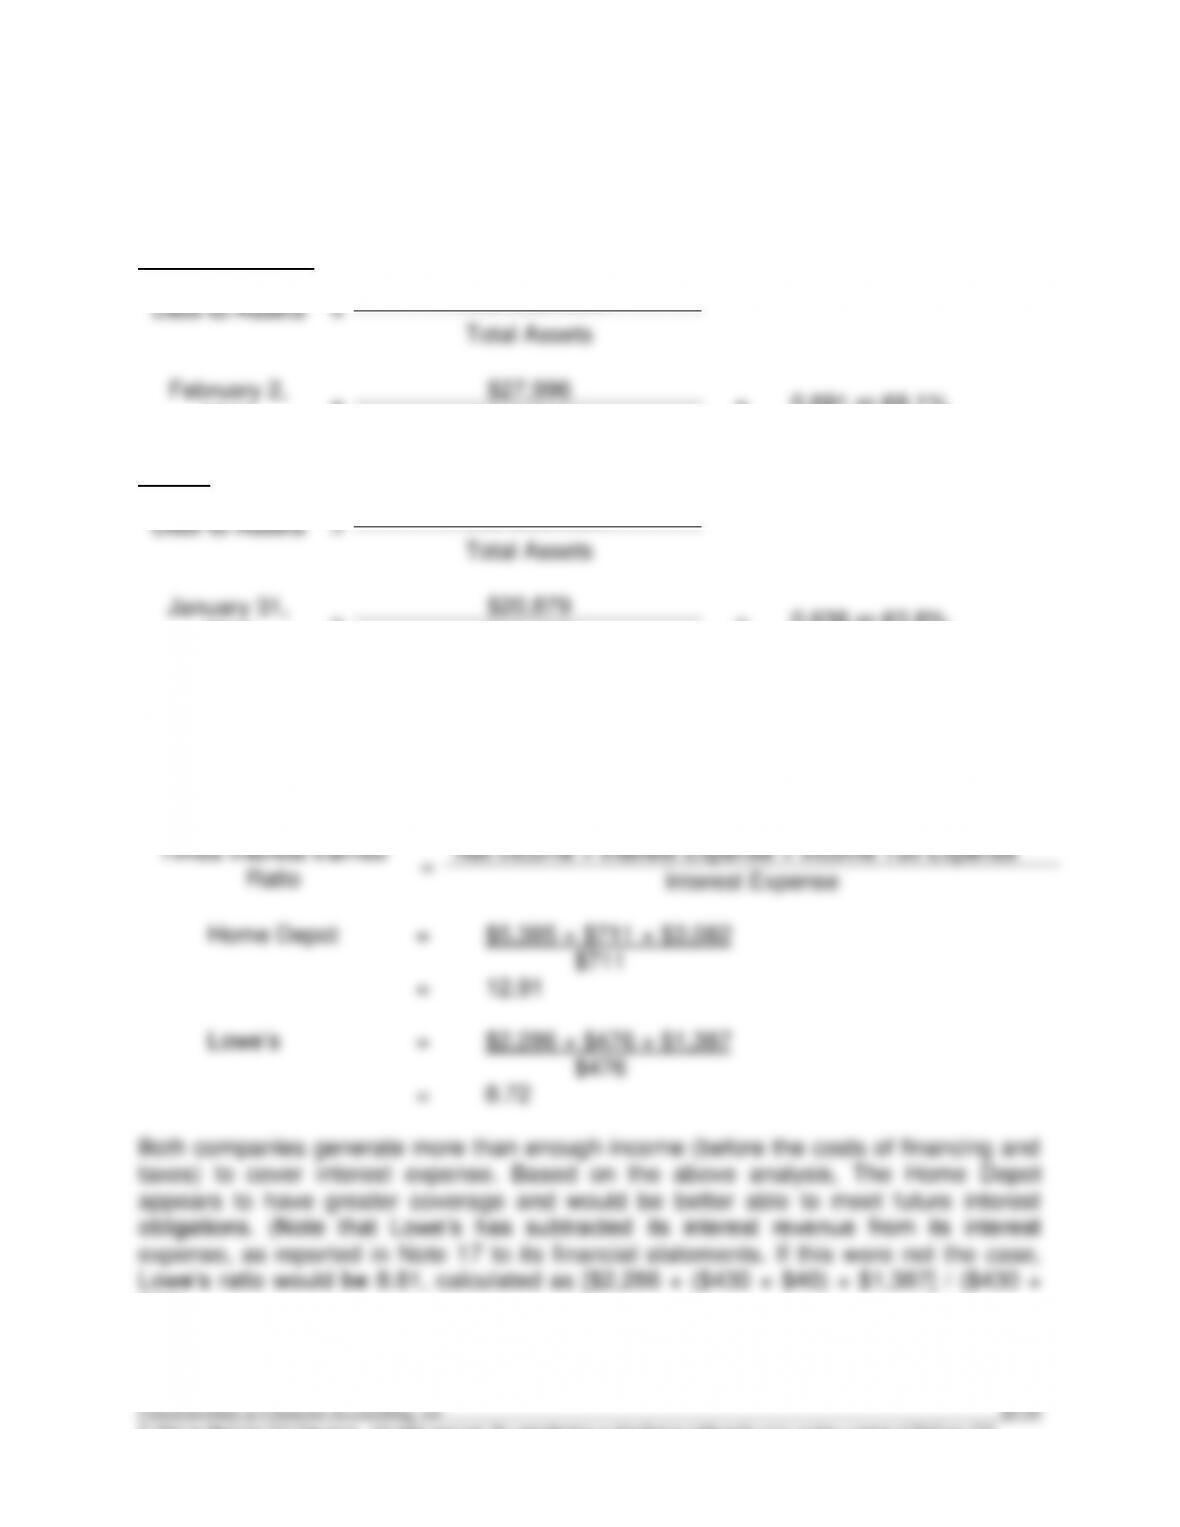
The Home Depot
Debt-to–Assets
=
Total Liabilities
Total Assets
February 2,
2014
=
$27,996
=
0.691 or 69.1%
$40,518
Lowe’s
Debt-to–Assets
=
Total Liabilities
Total Assets
January 31,
2014
=
$20,879
=
0.638 or 63.8%
$32,732
The debt–to-assets ratios indicate that The Home Depot relies to a greater extent than
Lowe’s on financing from creditors (69.1% versus 63.8%), suggesting that The Home
Depot has a riskier financing strategy.
Req. 2
Times Interest Earned
Ratio
=
Net Income + Interest Expense + Income Tax Expense
Interest Expense
Home Depot = $5,385 + $711 + $3,082
$711
= 12.91
Lowe’s = $2,286 + $476 + $1,387
$476
= 8.72
Both companies generate more than enough income (before the costs of financing and
taxes) to cover interest expense. Based on the above analysis, The Home Depot
appears to have greater coverage and would be better able to meet future interest
obligations. (Note that Lowe’s has subtracted its interest revenue from its interest
expense, as reported in Note 17 to its financial statements. If this were not the case,
Lowe’s ratio would be 8.81, calculated as [$2,286 + ($430 + $40) + $1,387] / ($430 +
$40).
S10–3
The solutions to this project will depend on the company and/or accounting period
selected for analysis.
S10–4
All investors should assess the risk and return associated with any investment before
they spend their money. The characteristics of bonds are explained in the bond
documents. As a result, investors should have a clear understanding of a bond before it
S10–5
Obviously, there is no easy answer to this question. We have found that some people
approach this question from the perspective that individuals’ jobs are more important
than others’ money. We try to point out that both the current workers and the retired
© 2016 by McGraw-Hill Education. All rights reserved. No reproduction or distribution without the prior written consent of McGraw-Hill
Education.
S10–6
1. The debt-to-assets ratio is currently equal to $570,000 ÷ $690,000 = 0.83. Because
2. If the company were to pay down $210,000 of its Accounts Payable with its excess
cash, the debt–to-assets ratio would become $(570,000 – 210,000) ÷ $(690,000–
210,000) = 0.75. At this level, the company complies with its debt covenant of 0.75.
While important, these quantitative effects are not all that should be considered
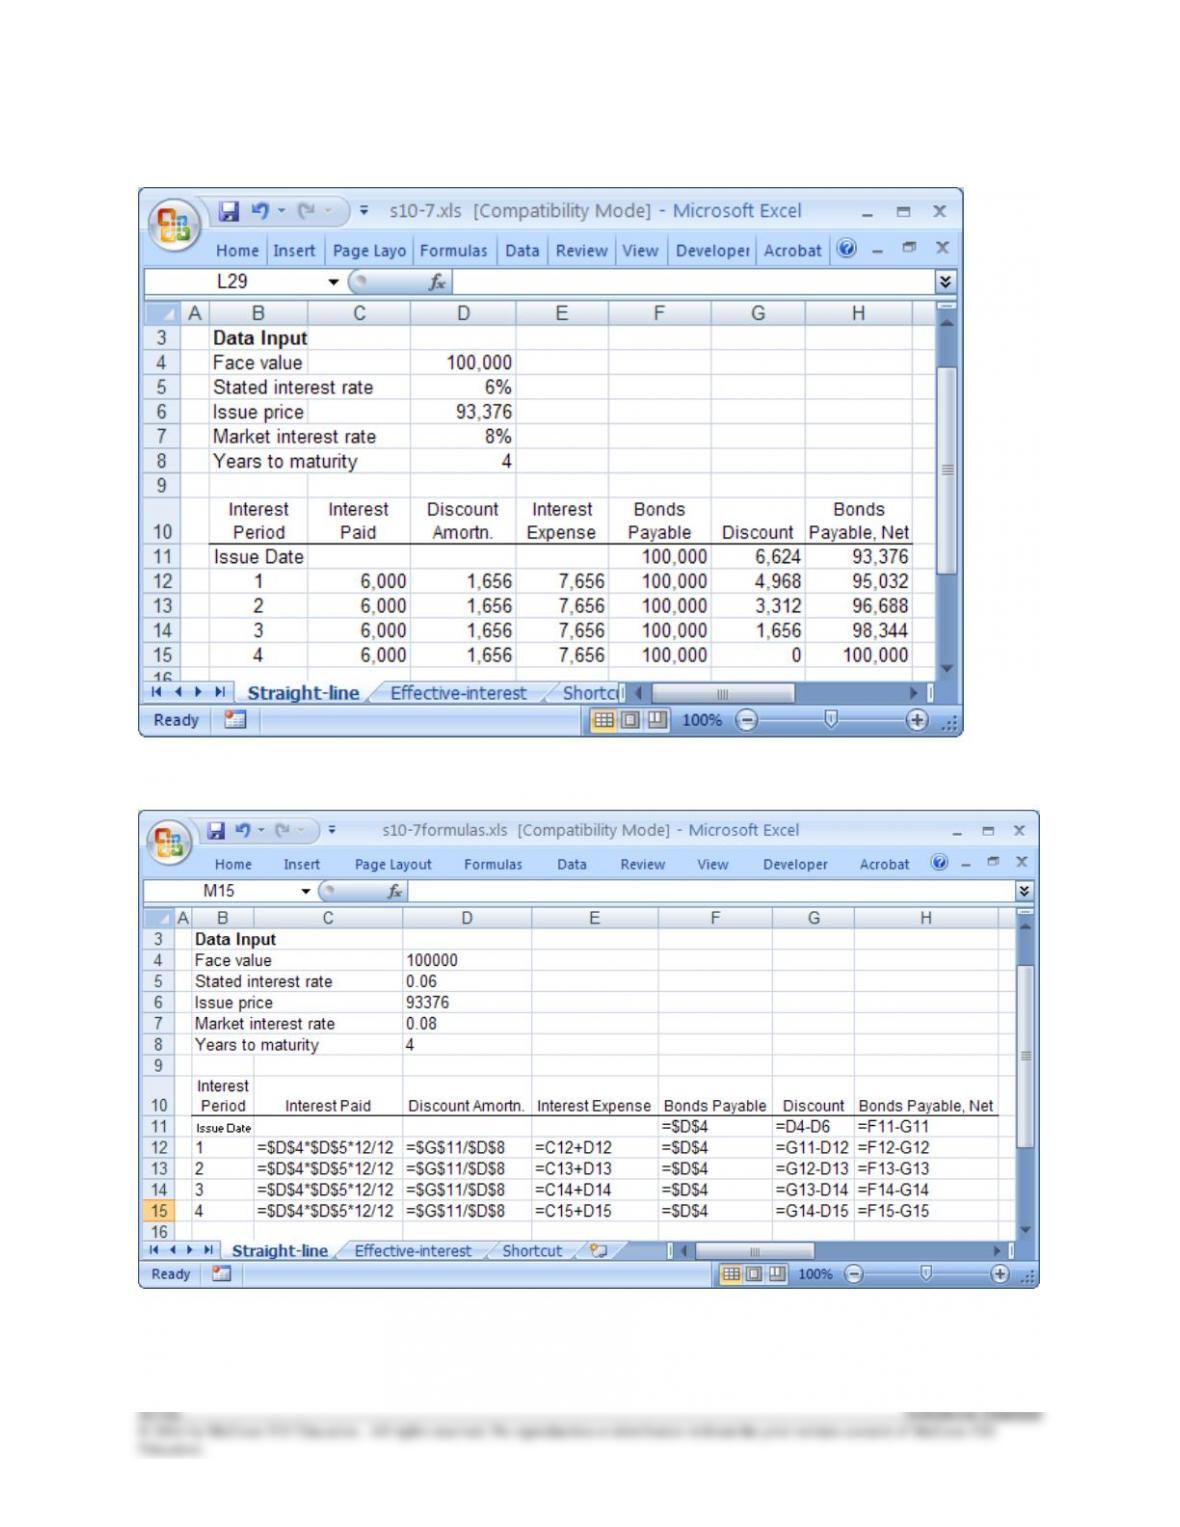
S10–7
© 2016 by McGraw-Hill Education. All rights reserved. No reproduction or distribution without the prior written consent of McGraw-Hill
Education.
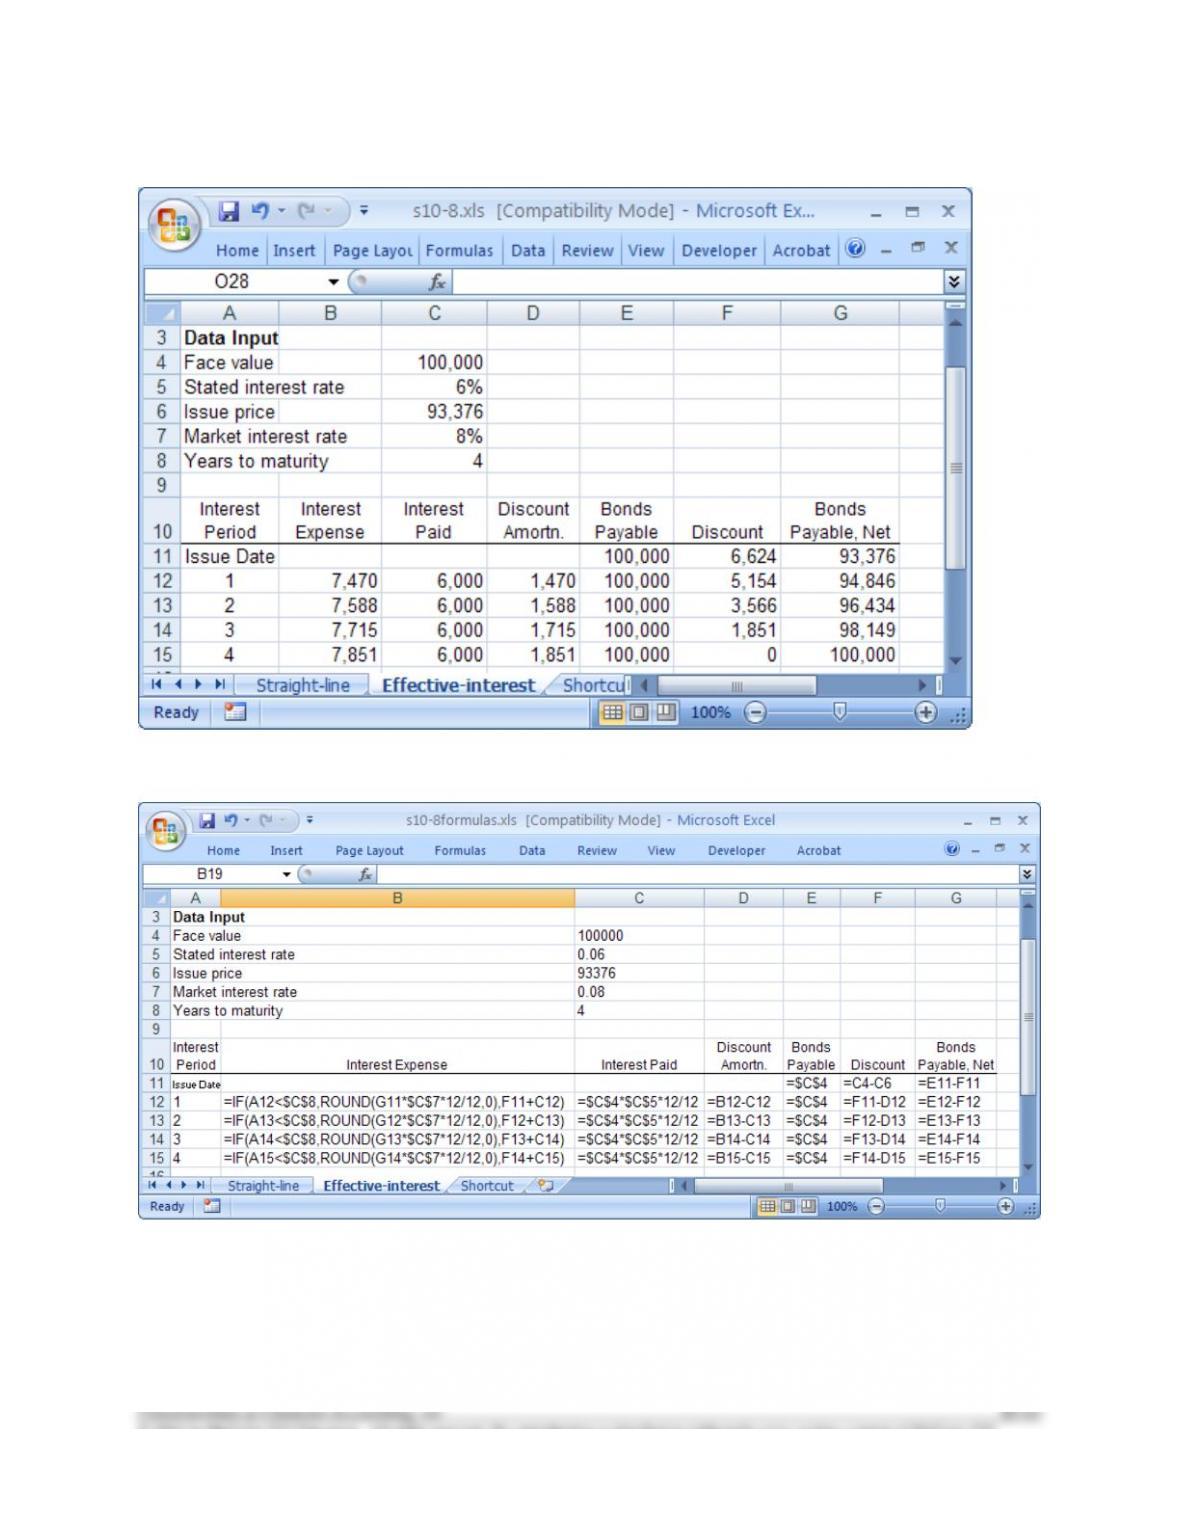
S10–8
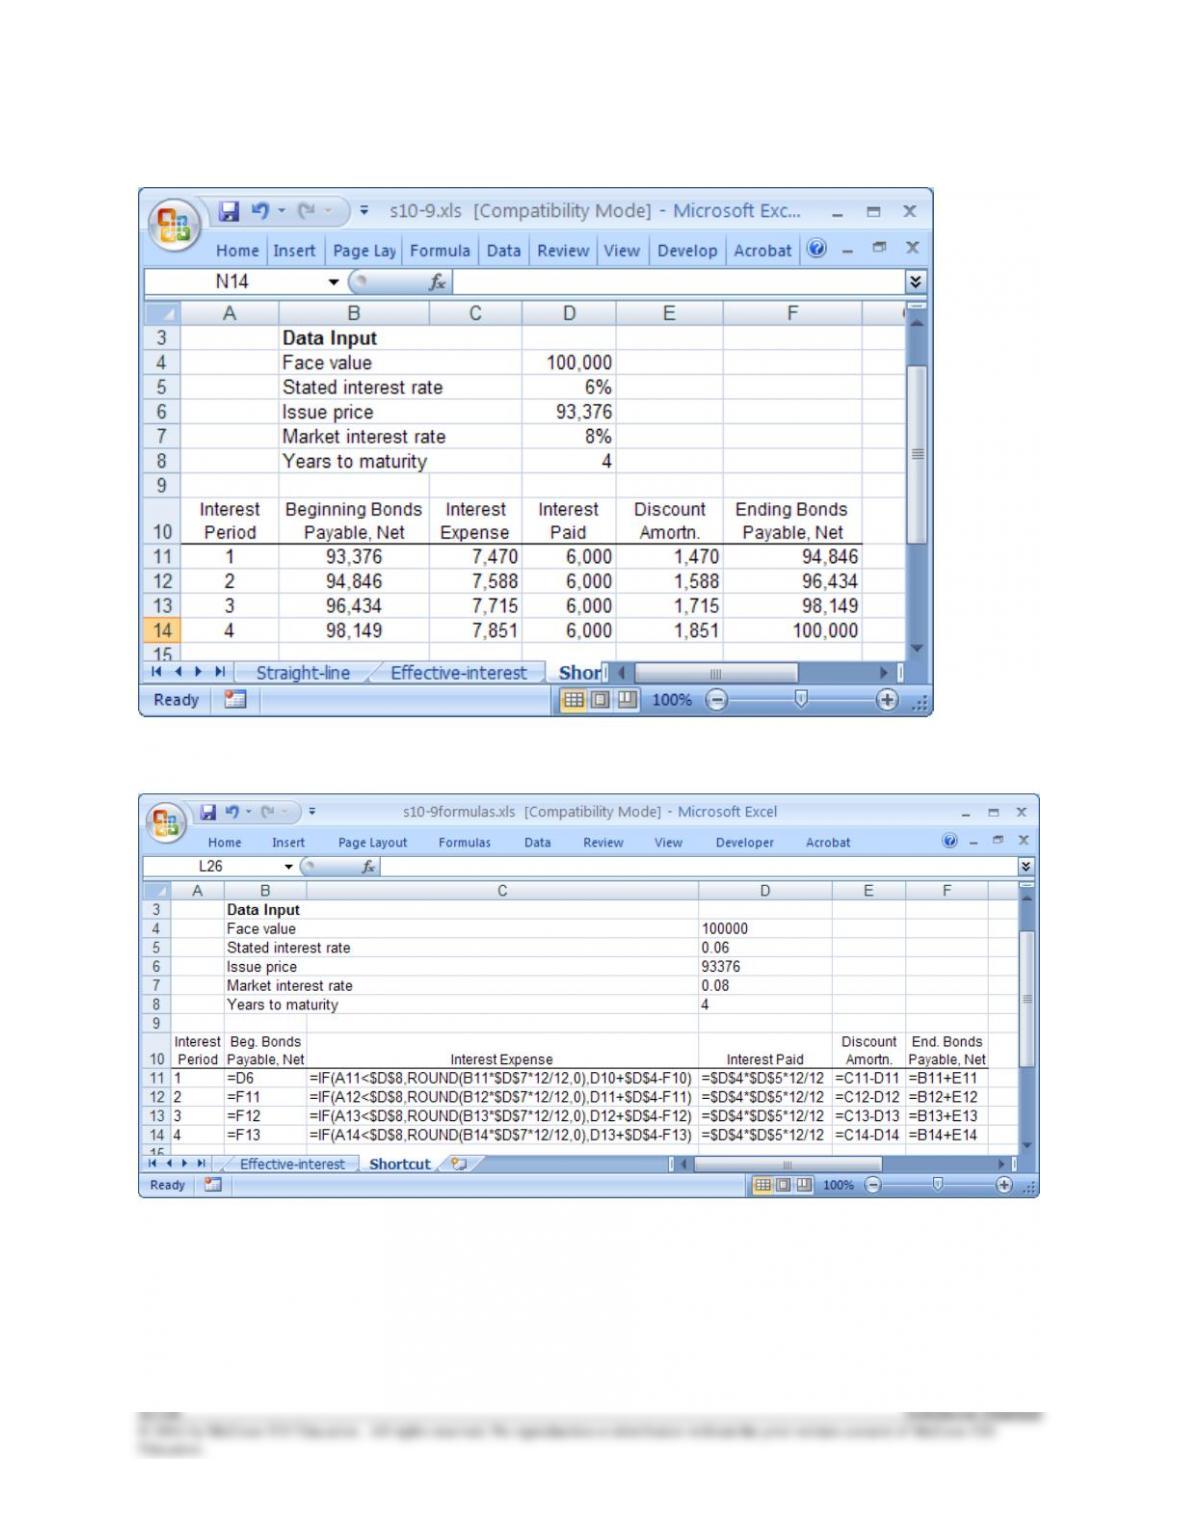
S10–9
© 2016 by McGraw-Hill Education. All rights reserved. No reproduction or distribution without the prior written consent of McGraw-Hill
Education.
CC10-1
Oct. 1, 2014
Cash……………………………………………
Notes Payable (short-term)….. …………
50,000
50,000
Dec. 31, 2014
Interest Expense …………………………….
Interest Payable …………………………..
($50,000 x 0.06 x 3/12 = $750)
750
750
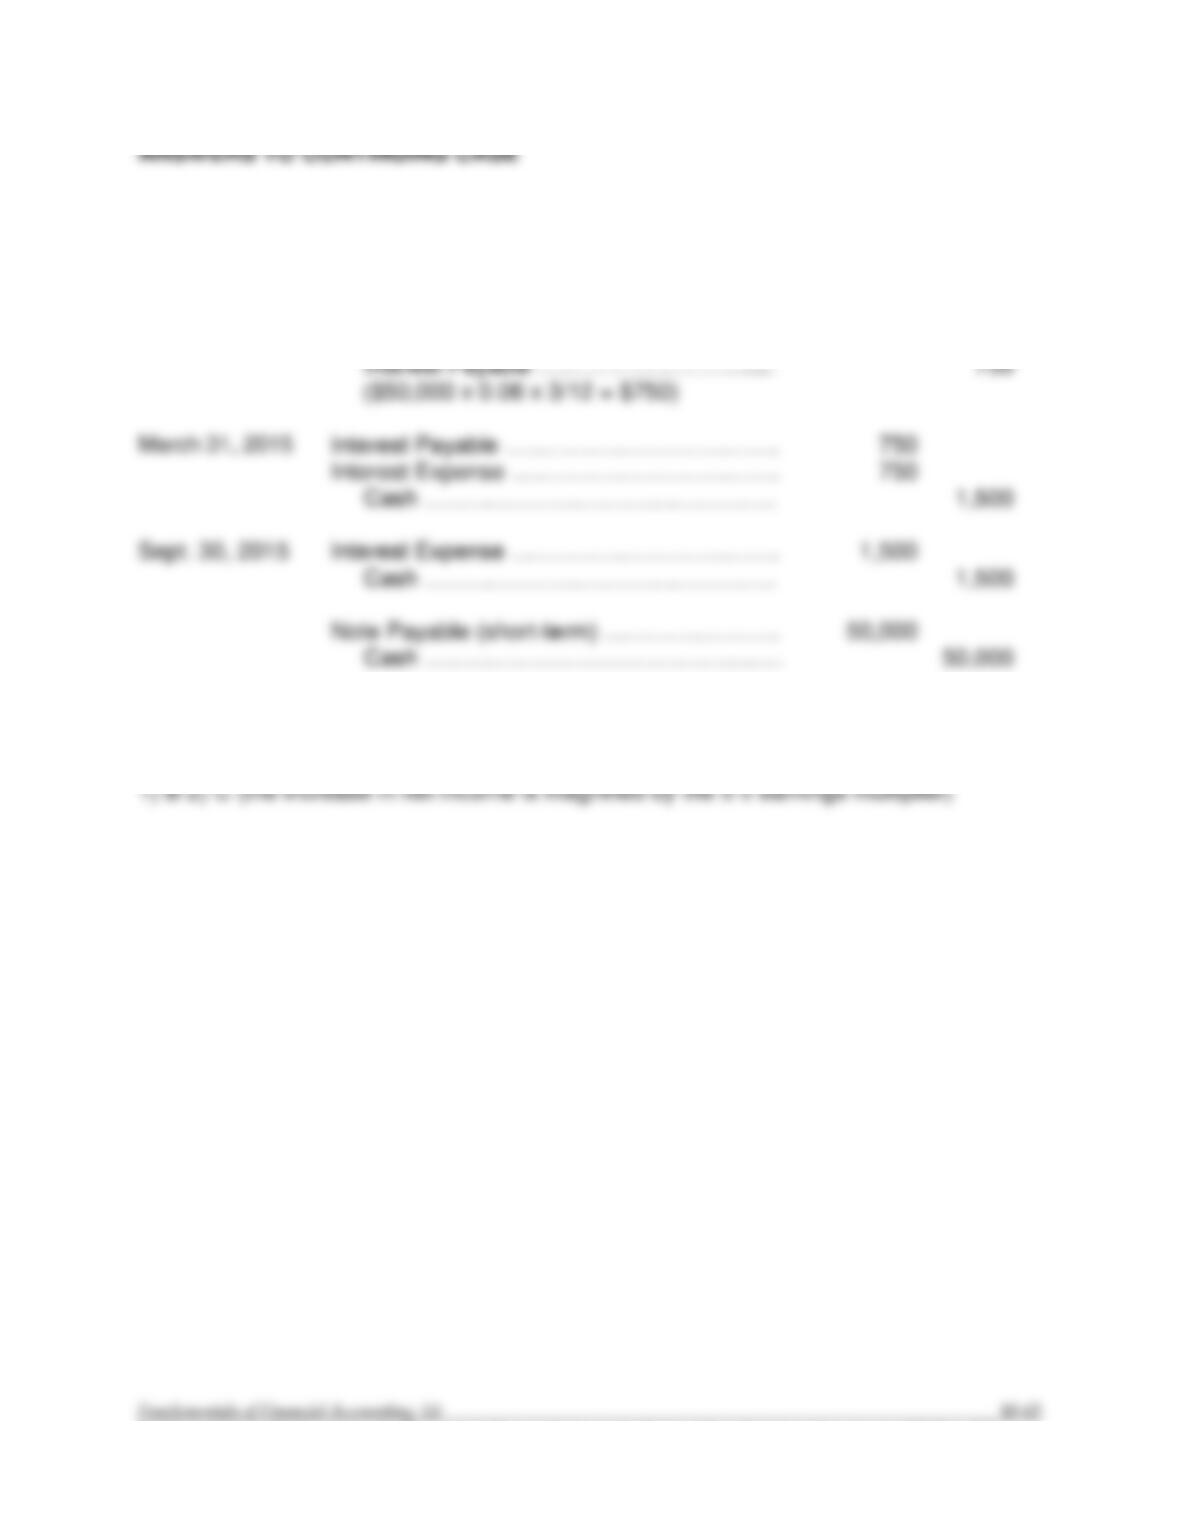
March 31, 2015
Interest Payable ….…………………………..
Interest Expense ……………………………..
Cash ….……………………………………
750
750
1,500
Sept. 30, 2015
Interest Expense ……………………………..
Cash ….……………………………………
Note Payable (short-term) ….……………….
Cash …..……………………………………
1,500
50,000
1,500
50,000
CC10-2