Chapter 08 – Reporting and Analyzing Long-Term Assets
1. When managers acquire new assets a number of decisions relative to
2. When assets are placed in use on a day other than the first day of the
month an assumption is often made that the assets are placed in use on
the first day of the month nearest to the date of the purchase. For
example, for assets purchased on the 1st through 15th days of the month,
3. By always assuming the first day of the following month as the date of
purchase, less depreciation is (initially) accrued for the assets
employed. This means depreciation expense will be less than if assets
were considered employed on the first of the month closest to the date
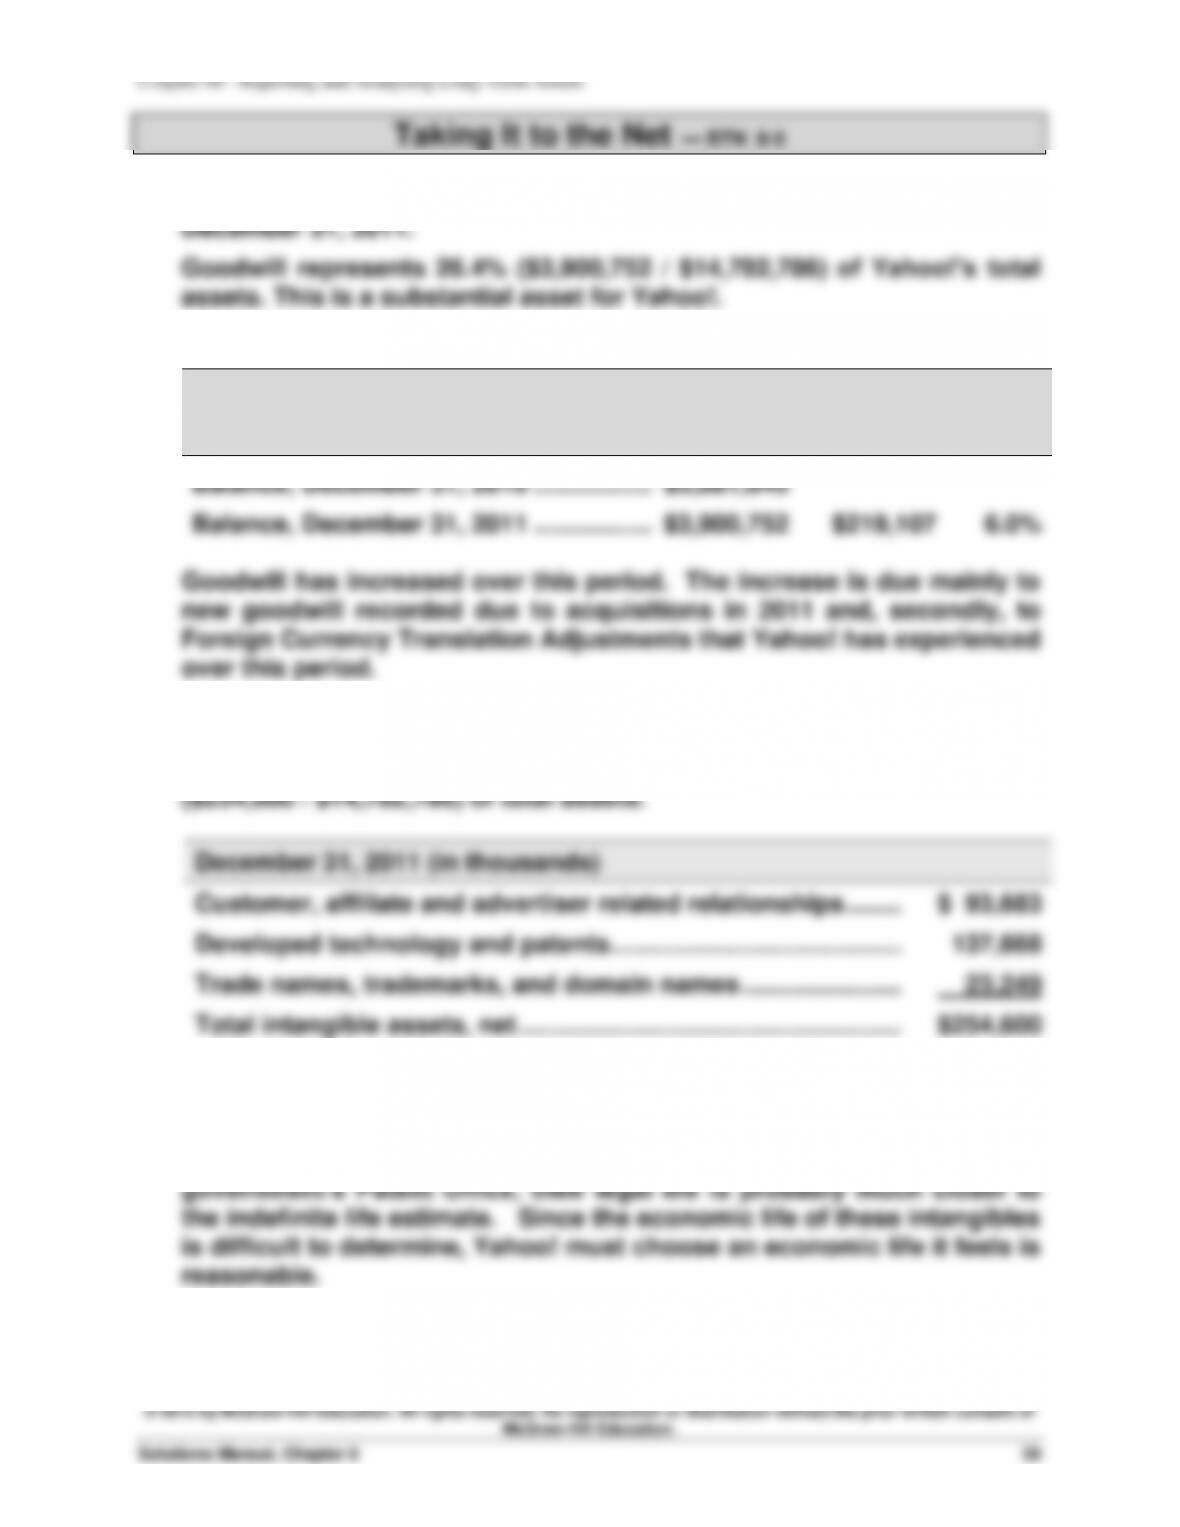
1. Yahoo! has Goodwill in the amount of ($ thousands) $3,900,752 at
2.
Goodwill (in $ thousands)
Total
Amount
$ Change
from Prior
Year
%
Change
Balance, December 31, 2010 ……………..…
$3,681,645
Balance, December 31, 2011 ……………..…
$3,900,752
$219,107
6.0%
Goodwill has increased over this period. The increase is due mainly to
new goodwill recorded due to acquisitions in 2011 and, secondly, to
Foreign Currency Translation Adjustments that Yahoo! has experienced
over this period.
3. Yahoo!’s intangible assets are categorized into the three categories
below at December 31, 2011. These intangibles represent 1.7%
© 2015 by McGraw-Hill Education. All rights reserved. No reproduction or distribution without the prior written consent of
McGraw-Hill Education.
Financial Accounting, 7th Edition
40
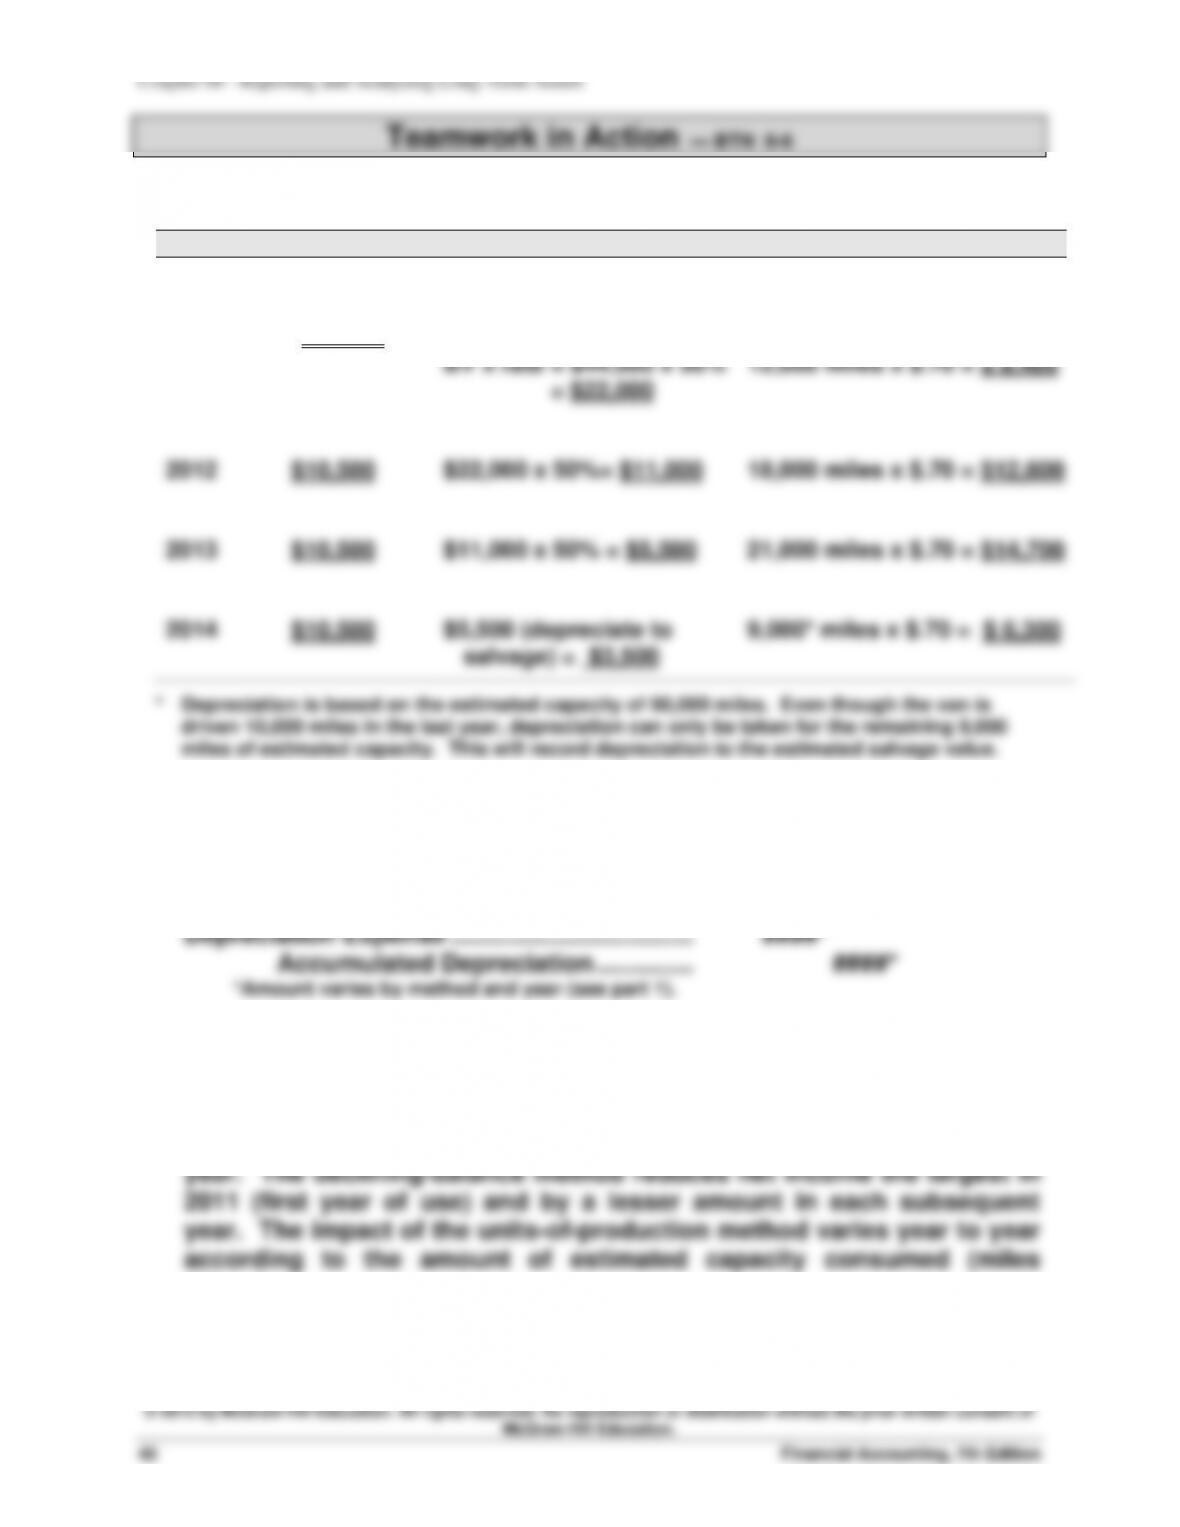
1. Annual depreciation for each year of the asset’s useful life:
Year
Straight-line
Double-Declining-Balance
Units-of-Production
2011
($44,000-$2,000)/4
= $10,500
(100%/4) x 2 = 50% is
declining-balance rate.
BV x rate = $44,000 x 50%
= $22,000
($44,000-$2,000)/60,000 miles
= $.70 per mile.
12,000 miles x $.70 = $ 8,400
2012
$10,500
$22,000 x 50%= $11,000
18,000 miles x $.70 = $12,600
2013
$10,500
$11,000 x 50% = $5,500
21,000 miles x $.70 = $14,700
2014
$10,500
$5,500 (depreciate to
salvage) = $3,500
9,000* miles x $.70 = $ 6,300
* Depreciation is based on the estimated capacity of 60,000 miles. Even though the van is
driven 10,000 miles in the last year, depreciation can only be taken for the remaining 9,000
miles of estimated capacity. This will record depreciation to the estimated salvage value.
2. Depreciation is recorded in an adjusting entry at the end of each
period. The entry is:
3. Each expert’s presentation of the comparison of methods will be
slightly different. The experts should make the following points: The
straight-line method reduces net income by the same amount each
driven).
© 2015 by McGraw-Hill Education. All rights reserved. No reproduction or distribution without the prior written consent of
McGraw-Hill Education.
Solutions Manual, Chapter 8
41
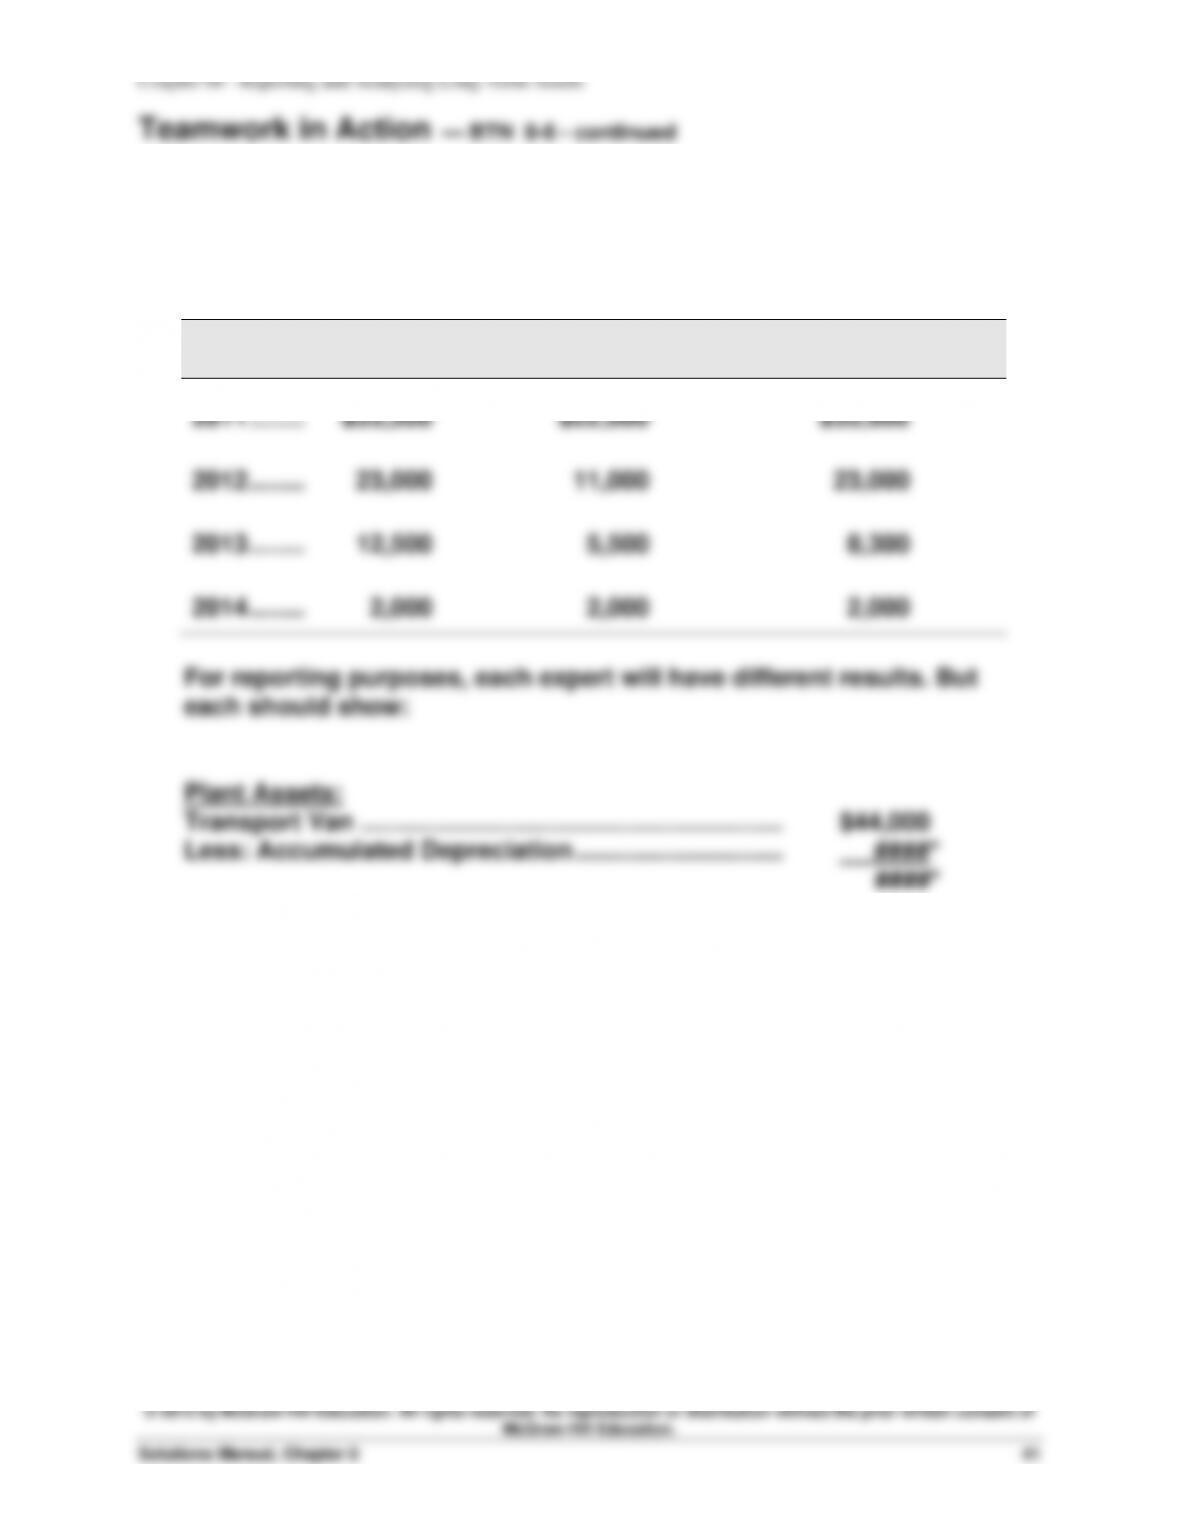
4. Book value at the end of each year
= Cost – Accumulated depreciation
= $44,000 – (amount varies by method—see part 1 for annual amounts)
Year
Straight–line
Double-Declining-
Balance
Units of Production
2011 ……..
$33,500
$22,000
$35,600
2012 ……..
23,000
11,000
23,000
2013 ……..
12,500
5,500
8,300
2014 ……..
2,000
2,000
2,000
For reporting purposes, each expert will have different results. But
each should show:
Plant Assets:
Transport Van ……………………………………………………. $44,000
Less: Accumulated Depreciation ………………………… ####*
####*
* Amounts vary by the method and the year selected for illustration. Experts should explain
the amounts shown.
Chapter 08 – Reporting and Analyzing Long-Term Assets
Entrepreneurial Decision — BTN 8-7
Part 1
(a) Under current conditions, the total asset turnover is 1.6. This is
1.8 times per year or, stated differently, each $1 of assets would now
produce $1.80 of net sales per year.
Part 2
The proposal would yield an improved total asset turnover of 1.8 vis-à-vis
the current total asset turnover of 1.6. However, we need to recognize that
© 2015 by McGraw-Hill Education. All rights reserved. No reproduction or distribution without the prior written consent of
McGraw-Hill Education.
Solutions Manual, Chapter 8
43
1. Total asset turnover for Samsung (KRW in millions):
₩165,001,771
2. Samsung was more efficient in using its assets to generate net sales
than Google and Apple. Specifically, in the current year, each KRW
(₩155,800,263+ ₩134,308,803)/2
₩201,103,613