Chapter 05 – Reporting and Analyzing Inventories
Teamwork in Action (Continued)
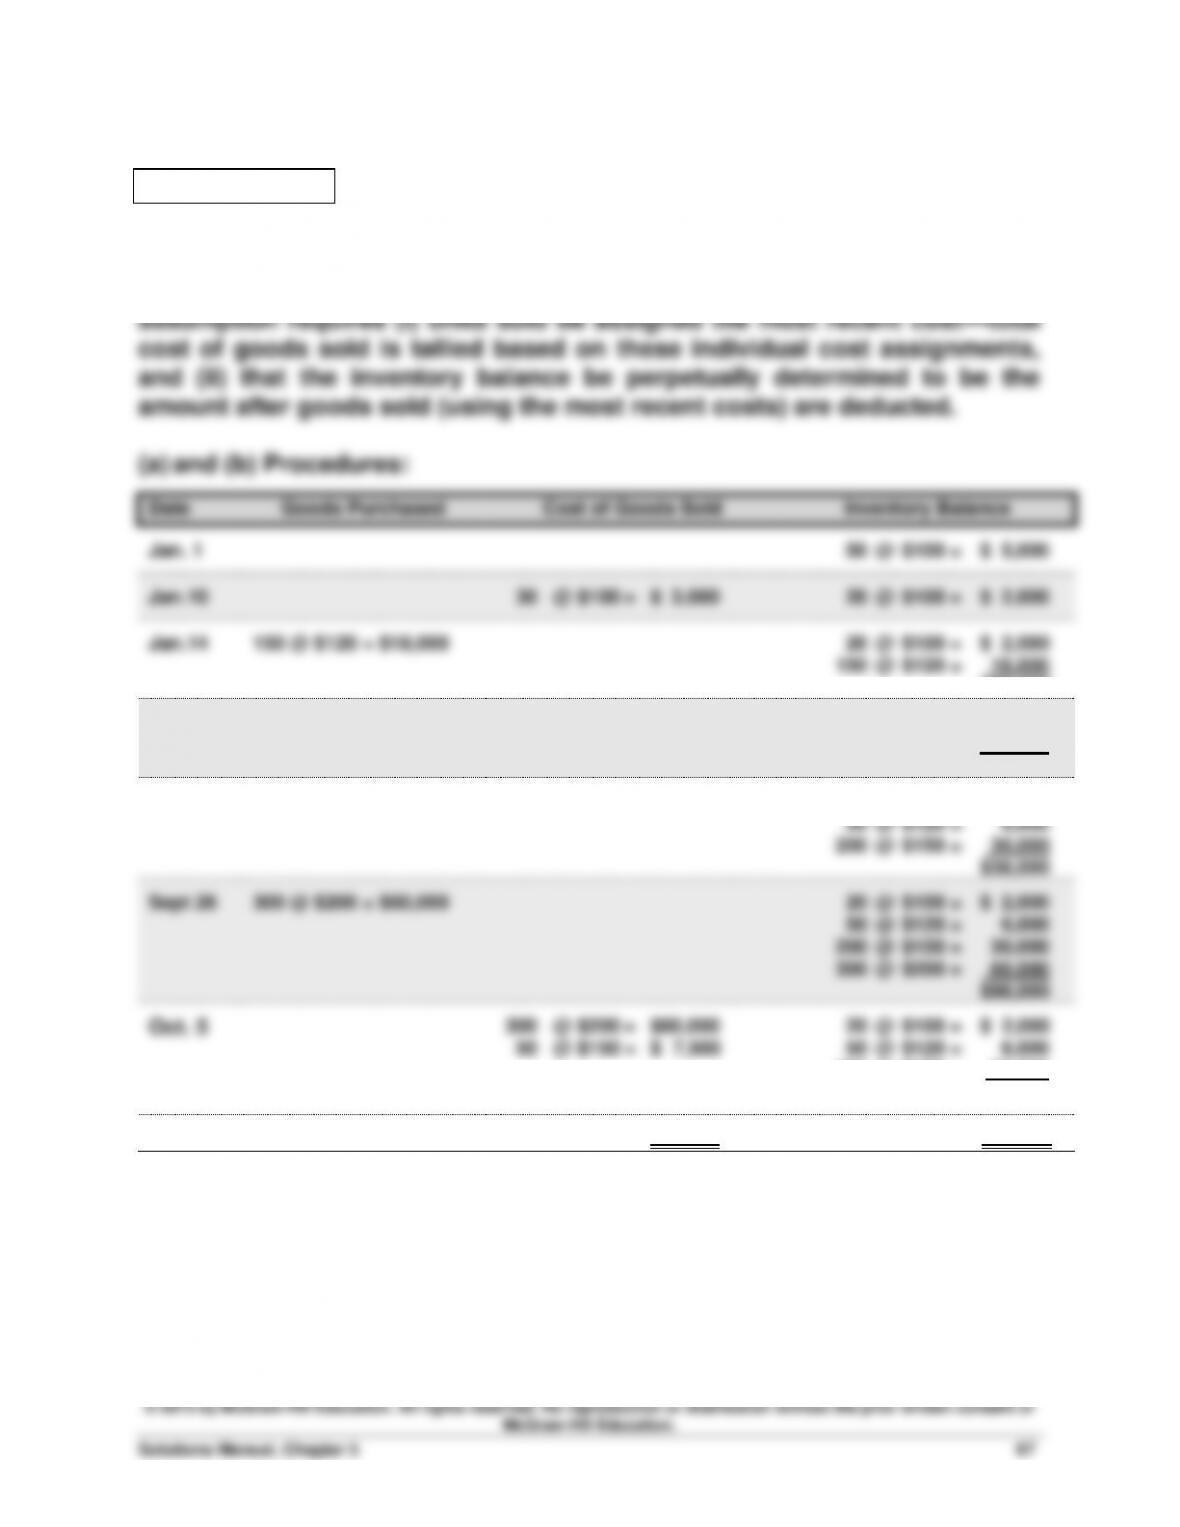
LIFO Expert:
(a) and (b) Concept:
Purchases are always recorded at actual costs. The LIFO cost flow
Chapter 05 – Reporting and Analyzing Inventories
Teamwork in Action (Continued)
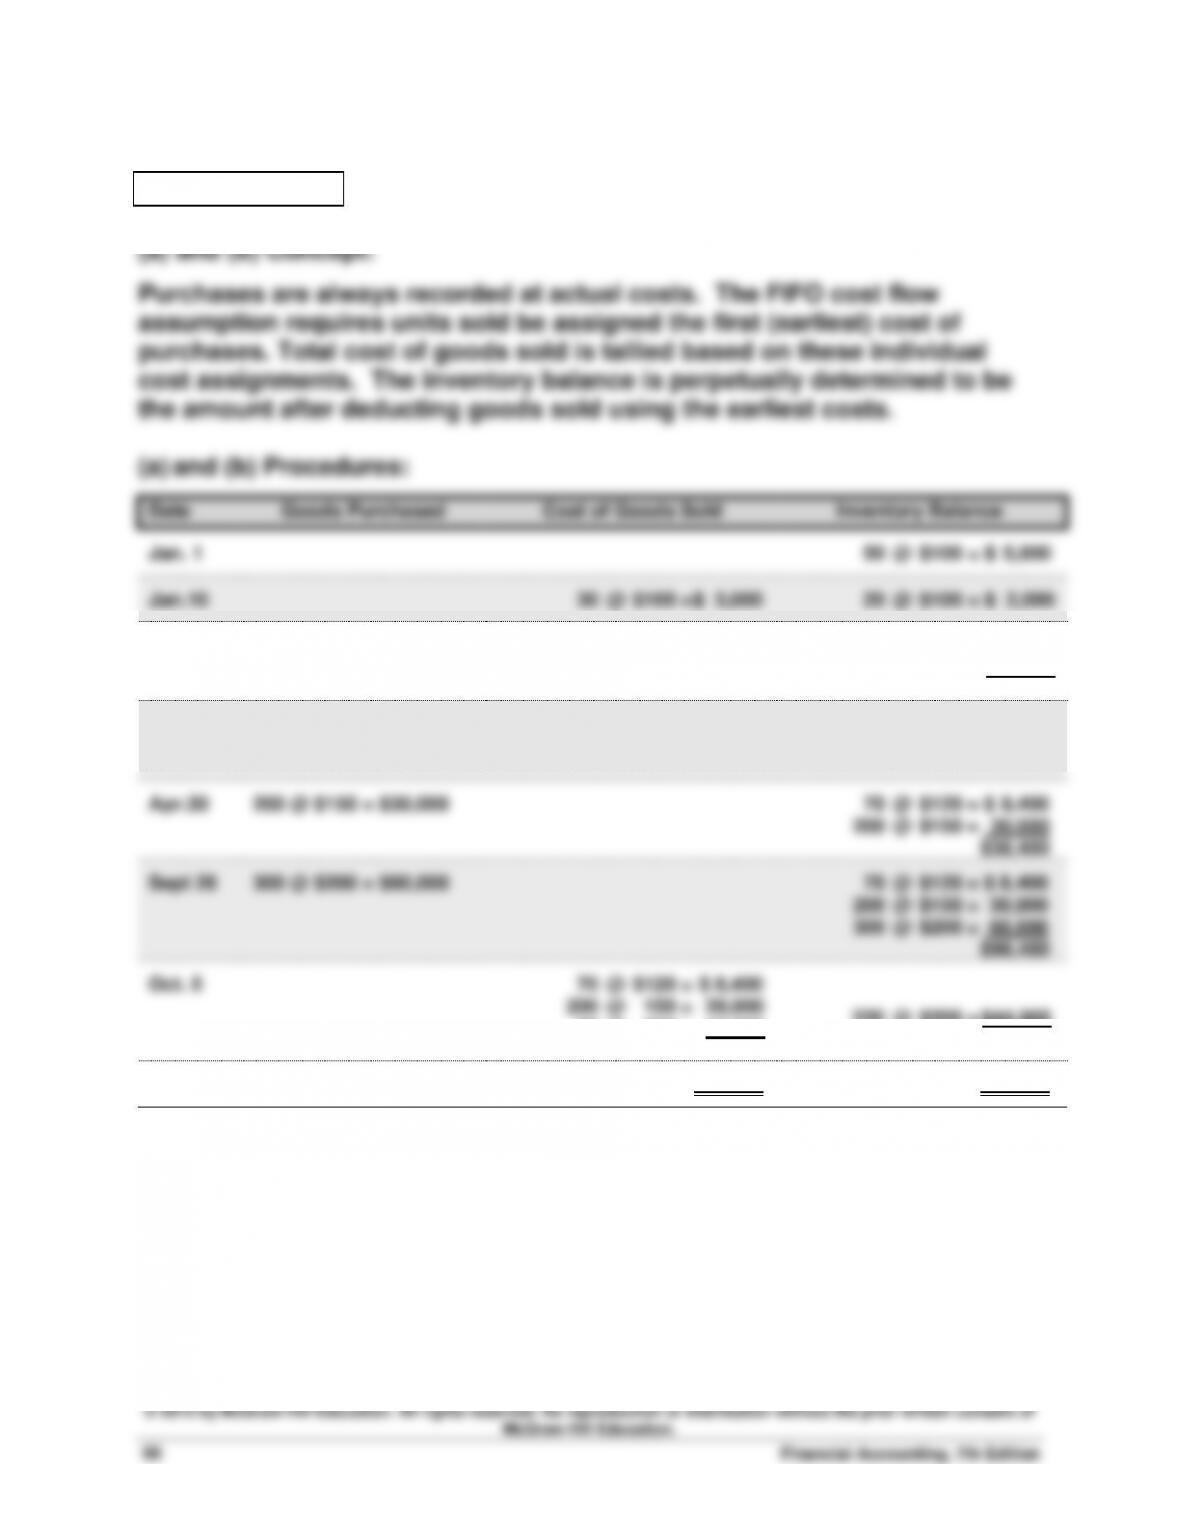
FIFO Expert:
Chapter 05 – Reporting and Analyzing Inventories
Teamwork in Action (Continued)
(a) and (b) Procedures:
Date
Goods Purchased
Cost of Goods Sold
Inventory Balance
Jan. 1
50 @ $100 = $ 5,000
Jan.10
30 @ $100 = $ 3,000
20 @ $100 = $ 2,000
Jan.14
150 @ $120 = $18,000
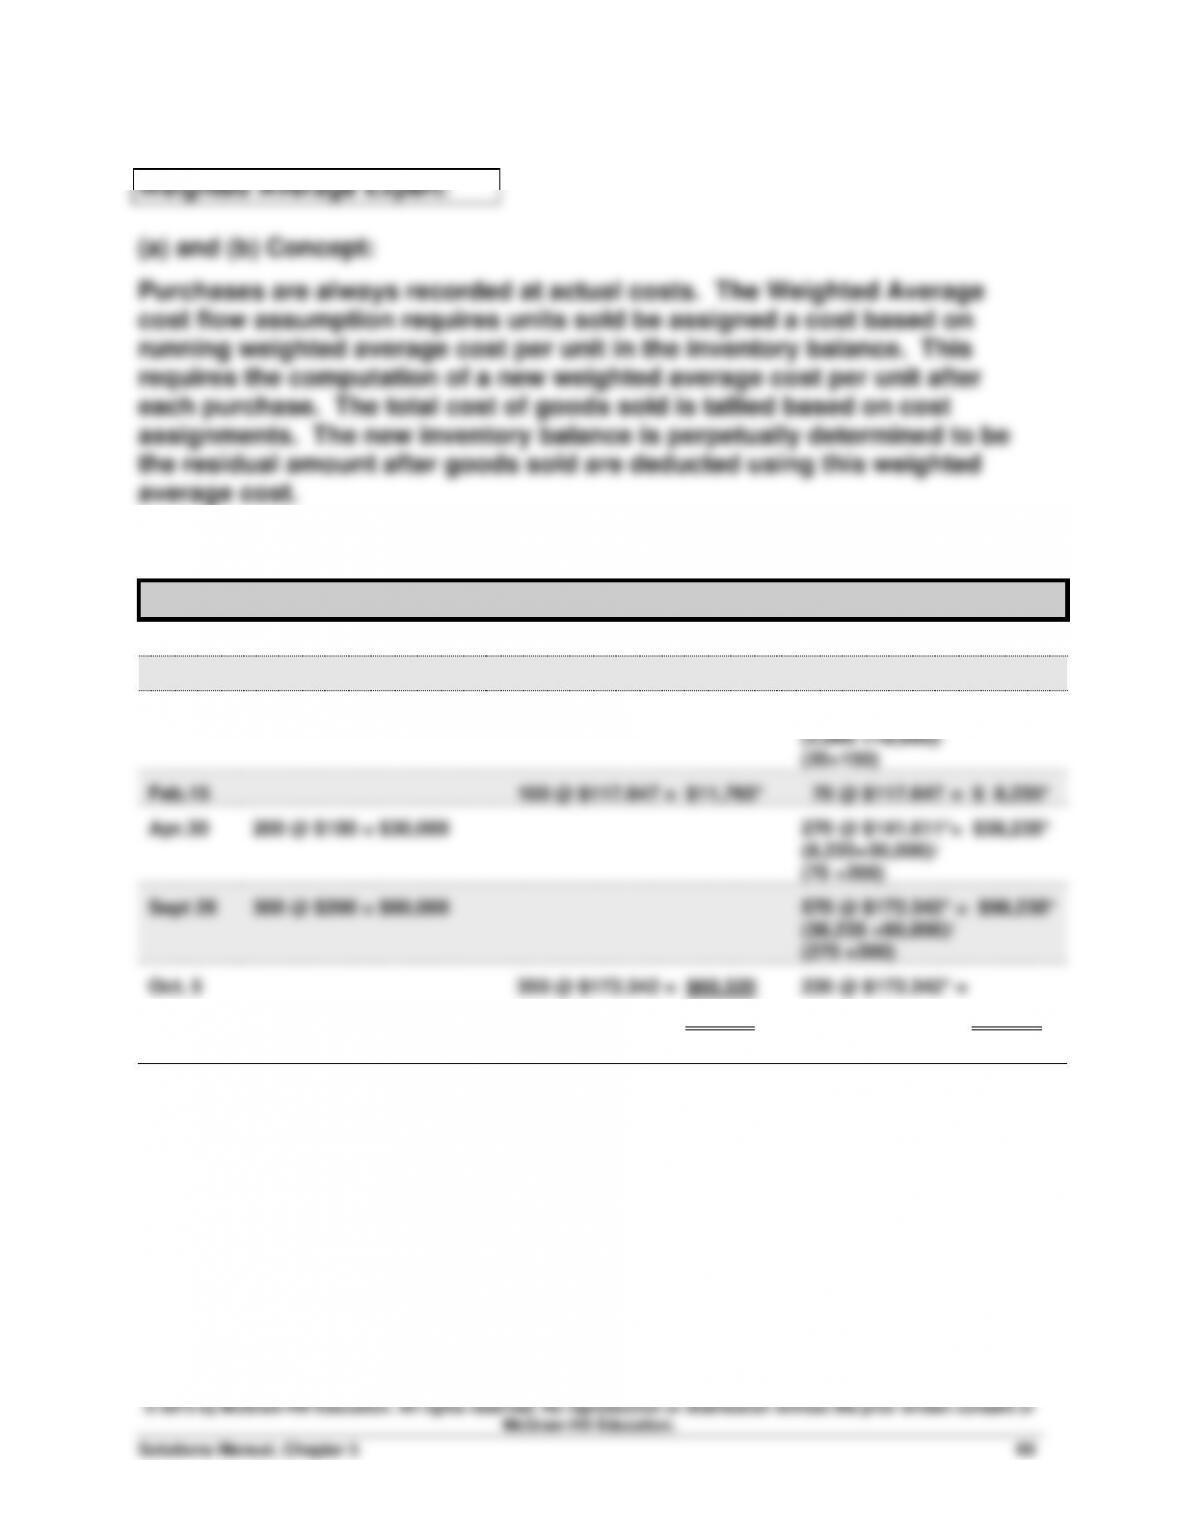
170 @ $117.647 = $20,000
(2,000 +18,000)/
(20+150)
Feb.15
100 @ $117.647 = $11,765*
70 @ $117.647 = $ 8,235*
Apr.30
200 @ $150 = $30,000
270 @ $141.611*= $38,235*
(8,235+30,000)/
(70 +200)
Sept 26
300 @ $200 = $60,000
570 @ $172.342* = $98,235*
(38,235 +60,000)/
(270 +300)
Oct. 5
350 @ $172.342 = $60,320
220 @ $172.342* =
$75,085
$37,915**
* rounded ** adjusted for rounding
Chapter 05 – Reporting and Analyzing Inventories
Teamwork in Action (Concluded)
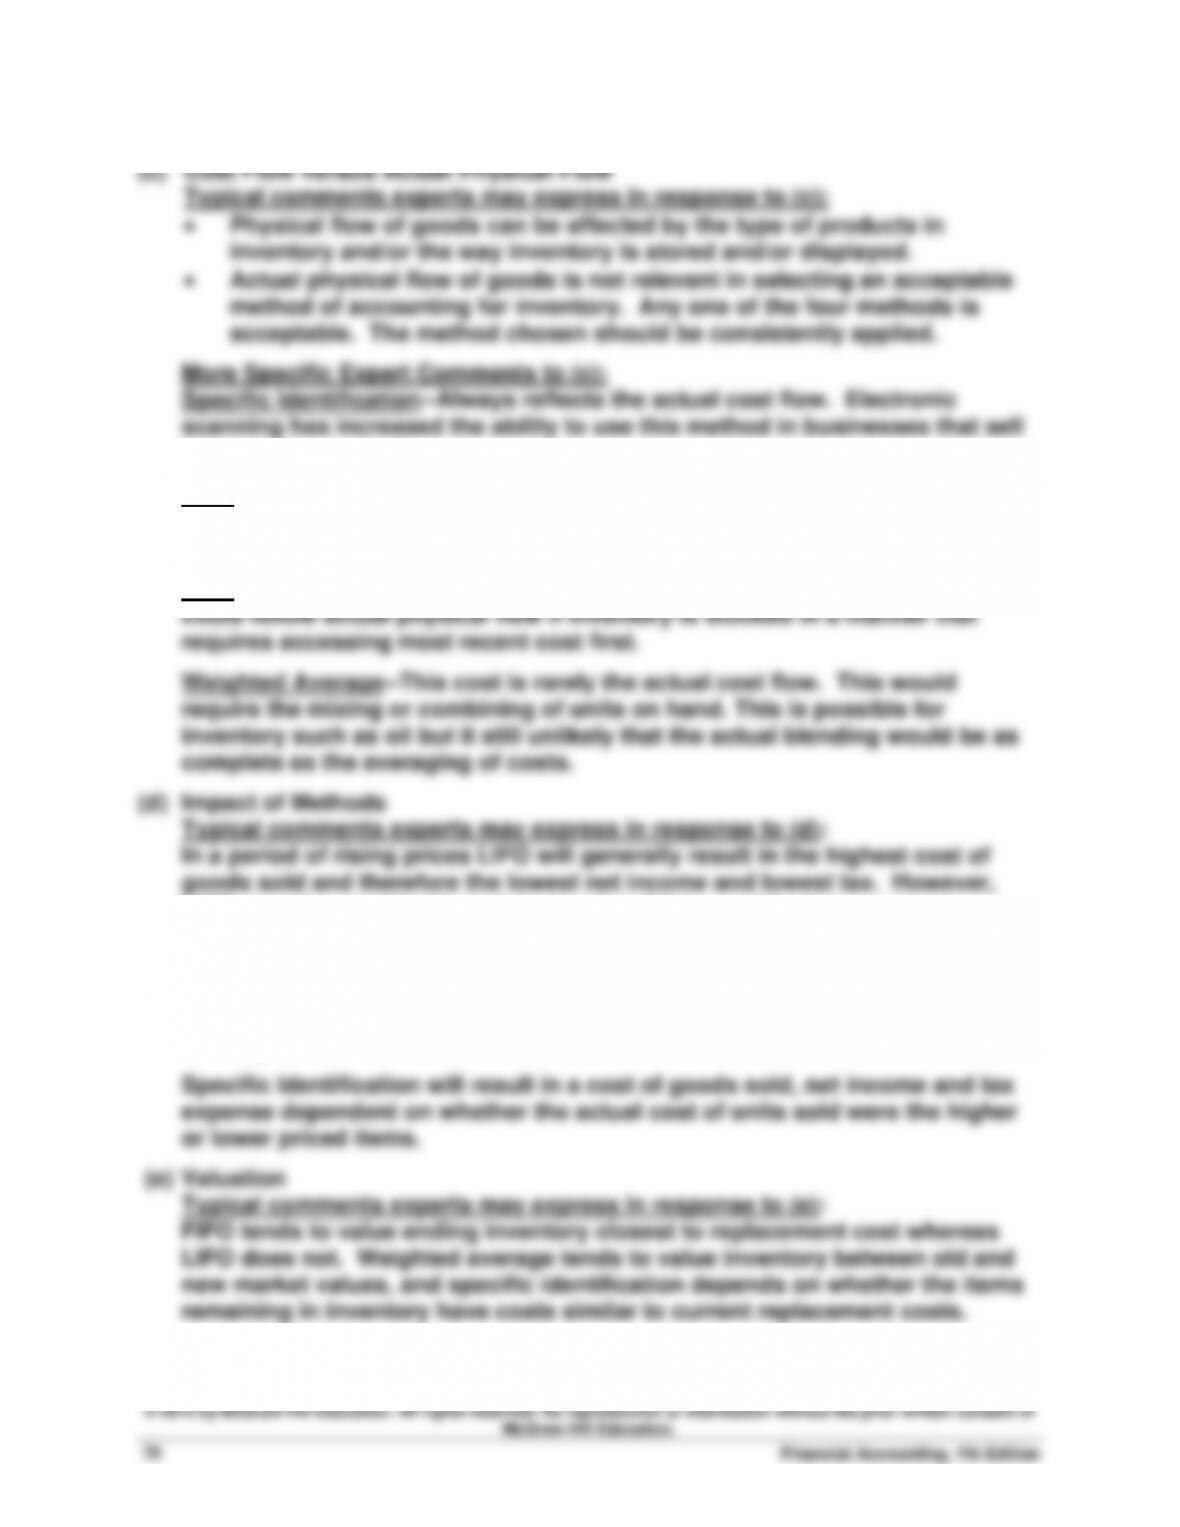
homogeneous goods.
FIFO—Most businesses try to move their older or earlier acquired inventory
first, particularly if they sell perishable goods. Therefore, FIFO will frequently
reflect the physical flow of goods.
LIFO—Few actually sell their most recently acquired inventory first. This
LIFO must be used for financial reporting if it is used for tax purposes.
In a period of rising prices FIFO will generally result in the lowest cost of
goods sold and therefore the highest net income and highest tax.
Weighted Average will usually result in a reported net income and tax
consequences somewhere in between LIFO and FIFO.
© 2015 by McGraw-Hill Education. All rights reserved. No reproduction or distribution without the prior written consent of
McGraw-Hill Education.
Financial Accounting, 7th Edition
72
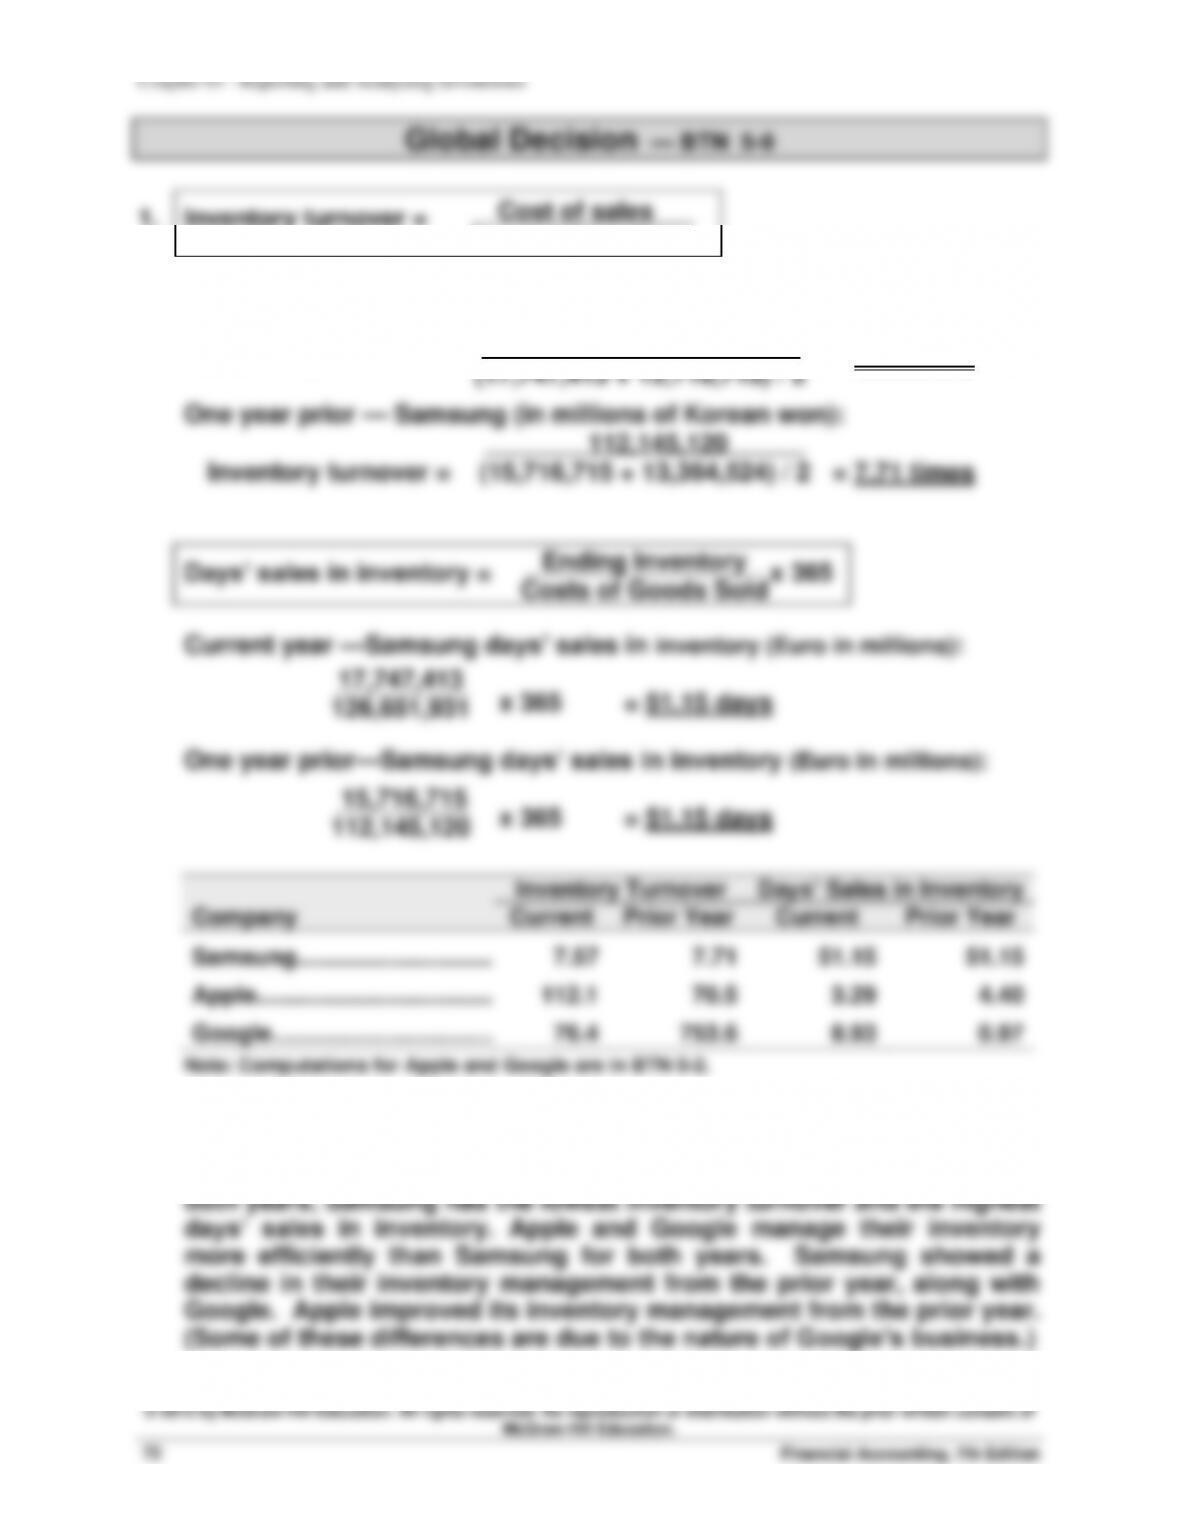
1. Inventory turnover =
Current year — Samsung (in millions of Korean won):
Inventory turnover = = 7.57 times
2. For the current year, Apple has the highest inventory turnover and the
lowest days’ sales in inventory. For the prior year, Google has the
highest inventory turnover and lowest days’ sales in inventory. For
Cost of sales
Average inventory
126,651,931
(17,747,413 + 15,716,715) / 2