Chapter 05 – Reporting and Analyzing Inventories
Problem 5-3B (Continued)
4.
FIFO
LIFO
Weighted
Average
Specific
Identifi-
cation
Sales* ………………………………..
$636,000
$636,000
$636,000
$636,000
Less: Cost of goods sold …...
160,500
186,800
173,700
174,800
Gross profit ………………………..
$475,500
$449,200
$462,300
$461,200
*Sales = (180 units x $1,200) + (300 units x $1,400) = $636,000
5. The manager of Aloha Company likely will prefer the FIFO method
profit.
Problem 5-4B (40 minutes)
1. Compute cost of goods available for sale and units available for sale
Beginning inventory ……………………...
150 units @ $300
$ 45,000
May 6 …………………………………………...
350 units @ $350
122,500
May 17 …………………………………………..
80 units @ $450
36,000
May 25 …………………………………………..
100 units @ $458
45,800
Units available ……………………………….
680 units
Cost of goods available for sale ……..
$249,300
2. Units in ending inventory
Units available (from part 1) …………..…………..
680 units
Less: Units sold (180 + 300) …………..…………..
480 units
Ending Inventory (units) ………………..…………
200 units
Problem 5-4B (Concluded)
3.
Periodic Inventory
Ending
Inventory
Cost of
Goods Sold
a. FIFO
(100 x $458.00) + (80 x $450.00) + (20 x $350.00) ..
$88,800.00
(150 x $300.00) + (330 x $350.00) ……………………….
$160,500.00
b. LIFO
(150 x $300.00) + (50 x $350.00) ………………………..
$62,500.00
(100 x $458.00) + (80 x $450.00) + (300 x $350.00)
$186,800.00
c. Weighted average ($249,300/680=$366.62 [rounded])
(200 x $366.62) …………………………………………………
$73,324.00
$249,300 [Goods Available] – $73,324 [Ending Inventory] ………..
$175,976.00
d. Specific identification
(70x$300)+(50x$350)+(80x$450)+(0x$458) …………
$74,500.00
$249,300 [Goods Available] – $74,500 [Ending Inventory] ………..
$174,800.00
4.
FIFO
LIFO
Weighted
Average
Specific
Identifi-
cation
Sales* ………………………………..
$636,000
$636,000
$636,000
$636,000
Less: Cost of goods sold …...
160,500
186,800
175,976
174,800
Gross profit ………………………..
$475,500
$449,200
$460,024
$461,200
*Sales = (180 units x $1,200) + (300 units x $1,400) = $636,000
5. The manager likely will prefer the FIFO method because it would yield
Problem 5-6B (35 minutes)
Part 1
(a)
Cost of goods sold
2012
2013
2014
Reported ……………………………..
$ 207,200
$ 213,800
$ 197,030
Adjustments: 12/31/2012 error
+ 18,000
– 18,000
12/31/2013 error
________
– 26,000
+ 26,000
Corrected …………………………….
$ 225,200
$ 169,800
$ 223,030
(b)
Net income
2012
2013
2014
Reported ……………………………..
$ 175,800
$ 212,270
$ 184,910
Adjustments: 12/31/2012 error
– 18,000
+ 18,000
12/31/2013 error
________
+ 26,000
– 26,000
Corrected …………………………….
$ 157,800
$ 256,270
$ 158,910
(c)
Total current assets
2012
2013
2014
Reported ……………………………..
$ 276,000
$ 277,500
$ 272,950
Adjustments: 12/31/2012 error
– 18,000
12/31/2013 error
________
+ 26,000
________
Corrected …………………………….
$ 258,000
$ 303,500
$ 272,950
(d)
Equity
2012
2013
2014
Reported …………………………………….
$ 314,000
$ 315,000
$ 346,000
Adjustments: 12/31/2012 error
– 18,000
12/31/2013 error
________
+ 26,000
________
Corrected ………………………………..….
$ 296,000
$ 341,000
$ 346,000
Part 2
Total net income for the combined three-year period ($572,980) is not affected by
the errors. This is because these errors are “self-correcting”—that is, each
overstatement (or understatement) of net income is offset by a matching
understatement (or overstatement) in the following year.
Part 3
The overstatement of inventory by $18,000 results in an understatement of cost of
goods sold by that same amount. The $18,000 understatement of cost of goods
sold results in an overstatement of gross profit by the same amount. This
overstatement of gross profit carries through to an overstatement of net income.
Since the overstated net income is closed to equity, the final equity figure is
overstated by the amount of the inventory overstatement.
Problem 5-8BA (30 minutes)
Part 1
SHEPARD COMPANY
Income Statements Comparing FIFO, LIFO, and Weighted Average
For Year Ended December 31, 2013
FIFO
LIFO
Weighted
Average
Sales ……………………………………………………..
$400,000
$400,000
$400,000
Cost of goods sold
Inventory, Dec. 31, 2012 ………………………..
48,720
48,720
48,720
Cost of purchases…………………………………
261,280
261,280
261,280
Cost of goods available for sale …………….
310,000
310,000
310,000
Inventory, Dec. 31, 2013 ………………………..
65,000
58,160
62,000
Cost of goods sold ……………………………….
245,000
251,840
248,000
Gross profit ……………………………………………
155,000
148,160
152,000
Operating expenses ……………………………….
60,000
60,000
60,000
Income before taxes ……………………………….
95,000
88,160
92,000
Income taxes expense (40%) …………………..
38,000
35,264
36,800
Net income …………………………………………….
$ 57,000
$ 52,896
$ 55,200
Supporting calculations
FIFO
LIFO
Weighted
Average
Dec. 31, 2012, inventory (840 x $58) ………………
$ 48,720
$ 48,720
$ 48,720
Purchases
600 x $59 = $ 35,400
1,205 x $61 = 73,505
700 x $64 = 44,800
1,655 x $65 = 107,575
261,280
261,280
261,280
Total cost of goods available
$310,000
$310,000
$310,000
Dec. 31, 2013, inventory
FIFO:
1,000 x $65 = 65,000
$ 65,000
LIFO:
840 x $58 = $48,720
160 x $59 = 9,440
$ 58,160
W.A.:
($310,000/5,000) x 1,000
$ 62,000
Problem 5-9BB (25 minutes)
Part 1
MACKLIN COMPANY
Estimated Inventory
December 31
At Cost At Retail
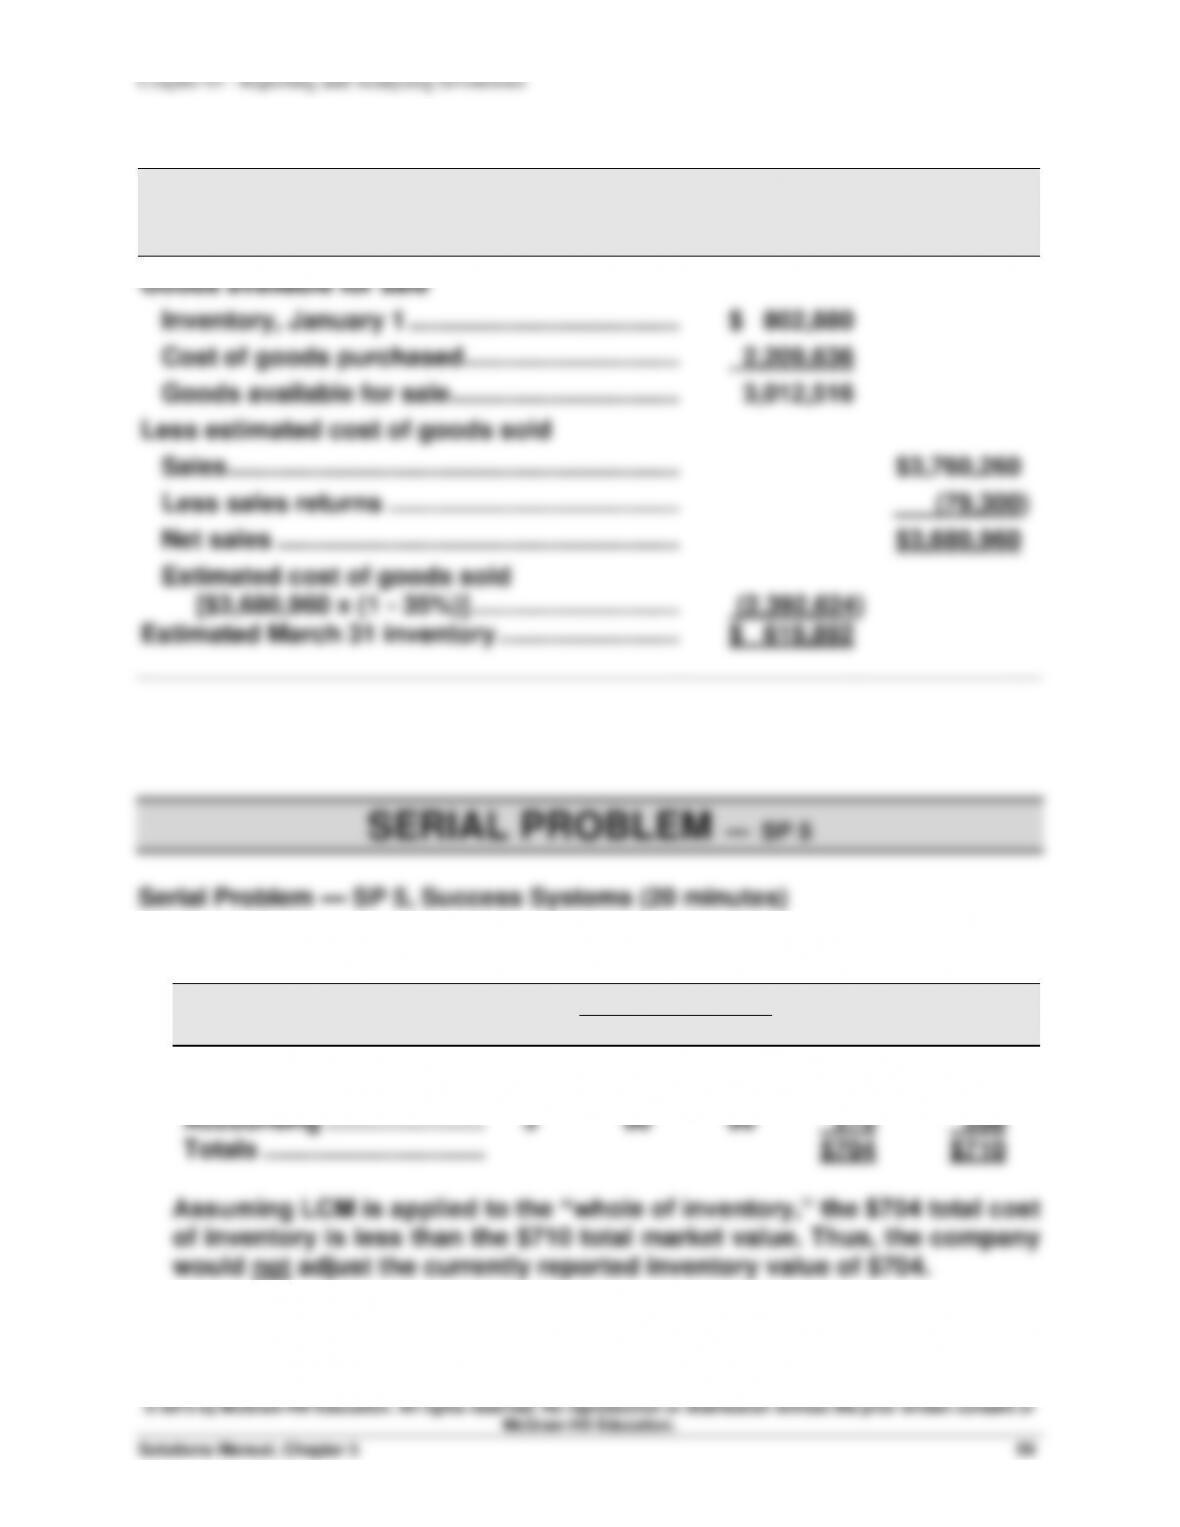
Goods available for sale
Beginning inventory ………………………………………
$ 90,022
$115,610
Cost of goods purchased ……………………………….
502,250
761,830
Goods available for sale …………………………………
$592,272
$877,440
Sales ……………………………………………………………….
$782,300
Less: Sales returns …………………………………………..
(3,460)
Net sales …………………………………………………………
$778,840
Ending inventory at retail ($877,440 – $778,840) ..
$ 98,600
Cost ratio: $592,272/$877,440 = 0.675 or 67.5%
Ending inventory at cost ($98,600 x 67.5%) ……….……..
$ 66,555
Part 2
MACKLIN COMPANY
Inventory Shortage
December 31
At Cost At Retail
Estimated inventory (from part 1) ……………………....
$66,555.00
$98,600.00
Physical inventory* …………………………………………....
54,303.75
80,450.00
Inventory shortage …………………………………………....
$12,251.25
$18,150.00
* $54,303.75 = $80,450 (given) x 67.5% (from part 1)—some students may round amounts
to the nearest dollar.
© 2015 by McGraw-Hill Education. All rights reserved. No reproduction or distribution without the prior written consent of
McGraw-Hill Education.
Financial Accounting, 7th Edition
60
2.
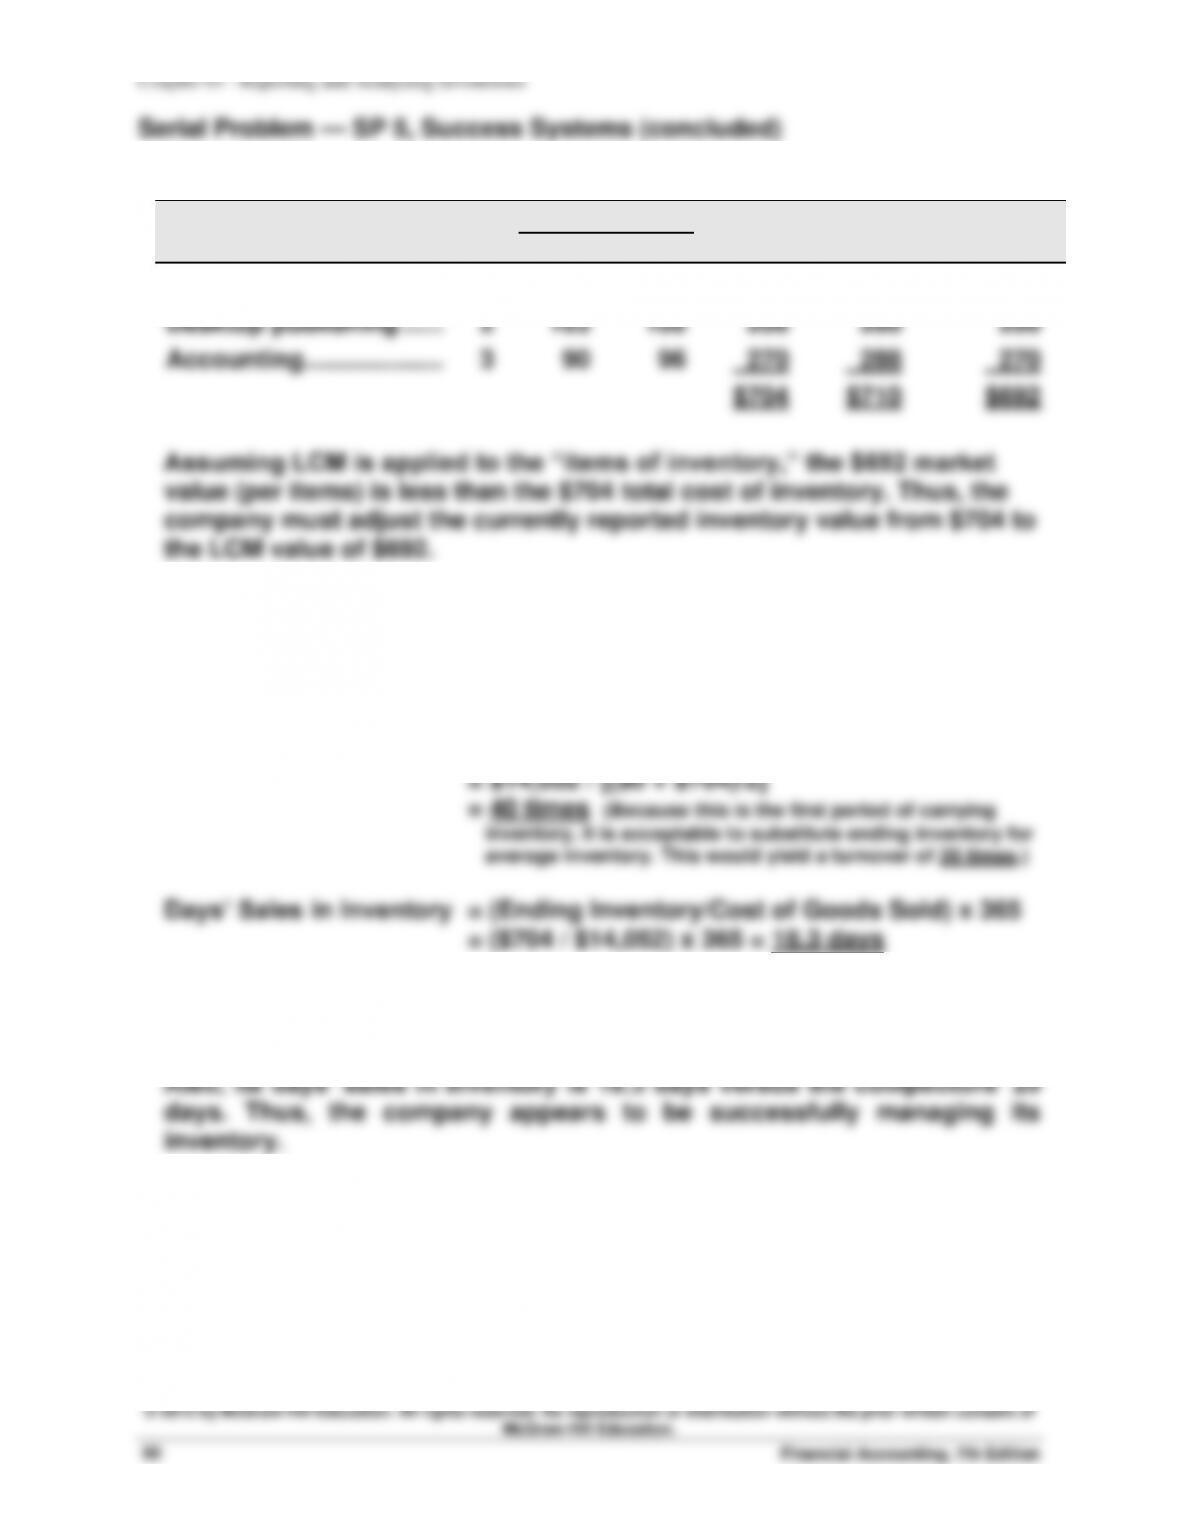
Per Unit
Total
Total
LCM Applied
Inventory Items
Units
Cost
Market
Cost
Market
To Items
Office productivity ……..
3
$ 76
$ 74
$228
$222
$222
Desktop publishing ……
2
103
100
206
200
200
Accounting ………………..
3
90
96
270
288
270
$704
$710
$692
Assuming LCM is applied to the “items of inventory,” the $692 market
value (per items) is less than the $704 total cost of inventory. Thus, the
company must adjust the currently reported inventory value from $704 to
the LCM value of $692.
Part B
1. Ratio computations for the three months ended March 31, 2014:
Inventory Turnover = Cost of Goods Sold / Average Inventory
2. Success Systems outperforms its competitors on both ratios. Its
inventory turnover is 40 (or 20) times versus the competitors’ 15 times.