Chapter 04 – Reporting and Analyzing Merchandising Operations
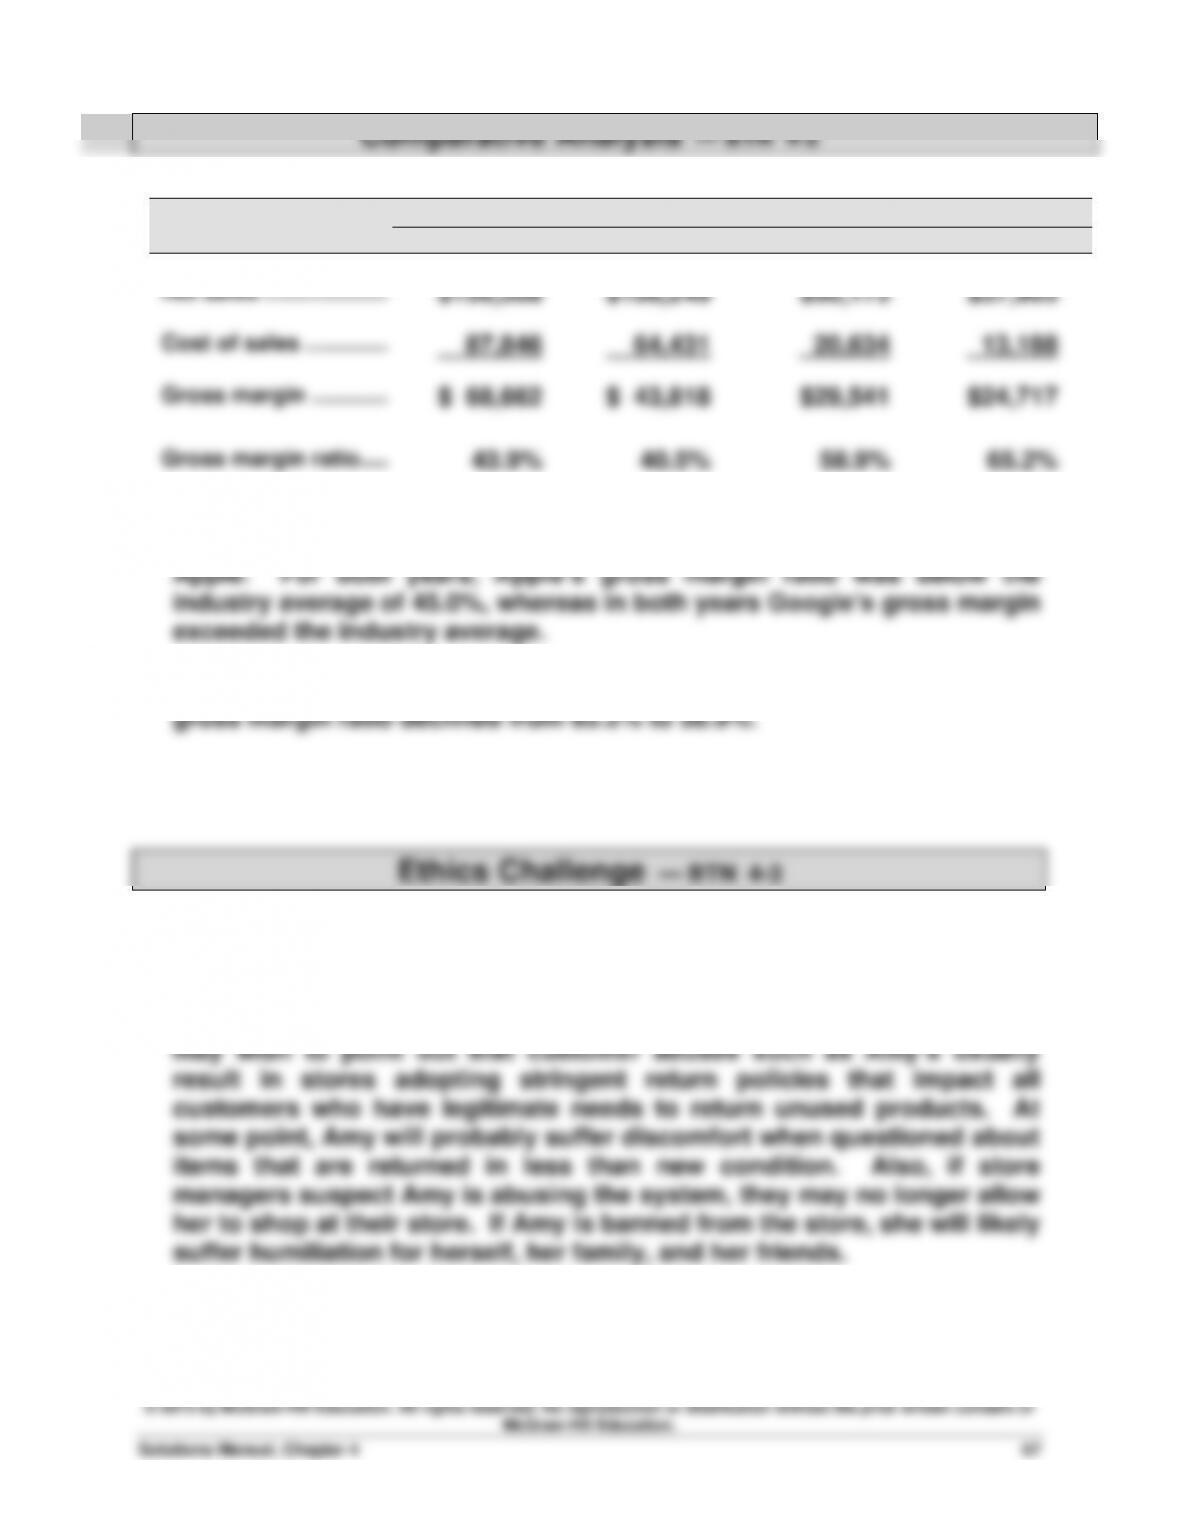
1.
Apple
Google
($ millions)
Current
Prior
Current
Prior
Net sales ………………
$156,508
$108,249
$50,175
$37,905
Cost of sales …………
87,846
64,431
20,634
13,188
Gross margin ………..
$ 68,662
$ 43,818
$29,541
$24,717
Gross margin ratio ….
43.9%
40.5%
58.9%
65.2%
2. In both years, Google’s gross margin ratio was higher than that for
3. Apple’s gross margin ratio improved from 40.5% to 43.9% and Google’s
1. A few students sometimes feel that Amy has devised a clever way to
beat the system. She appears to be succeeding in getting something for
free. However, most students fortunately feel that Amy is abusing the
system and that her ethical conduct needs an overhaul. The instructor
© 2015 by McGraw-Hill Education. All rights reserved. No reproduction or distribution without the prior written consent of
McGraw-Hill Education.
Financial Accounting, 7th Edition
68
2. The merchandising company accounts for sales returns using a contra
revenue account called Sales Returns and Allowances. A dress
returned with a sales bill of $200 would be accounted for as follows:
Sales Returns and Allowances …………… 200
Accounts Receivable ………………… 200
know your investment in security has paid off. Let me explain.
We maintain a perpetual inventory system, which continuously updates
inventory account balances as goods are purchased, sold, and returned.
At the end of each accounting period, we take an actual physical inventory
and compare this amount to our inventory records. These accounting
Chapter 04 – Reporting and Analyzing Merchandising Operations
Taking It to the Net — BTN 4-5
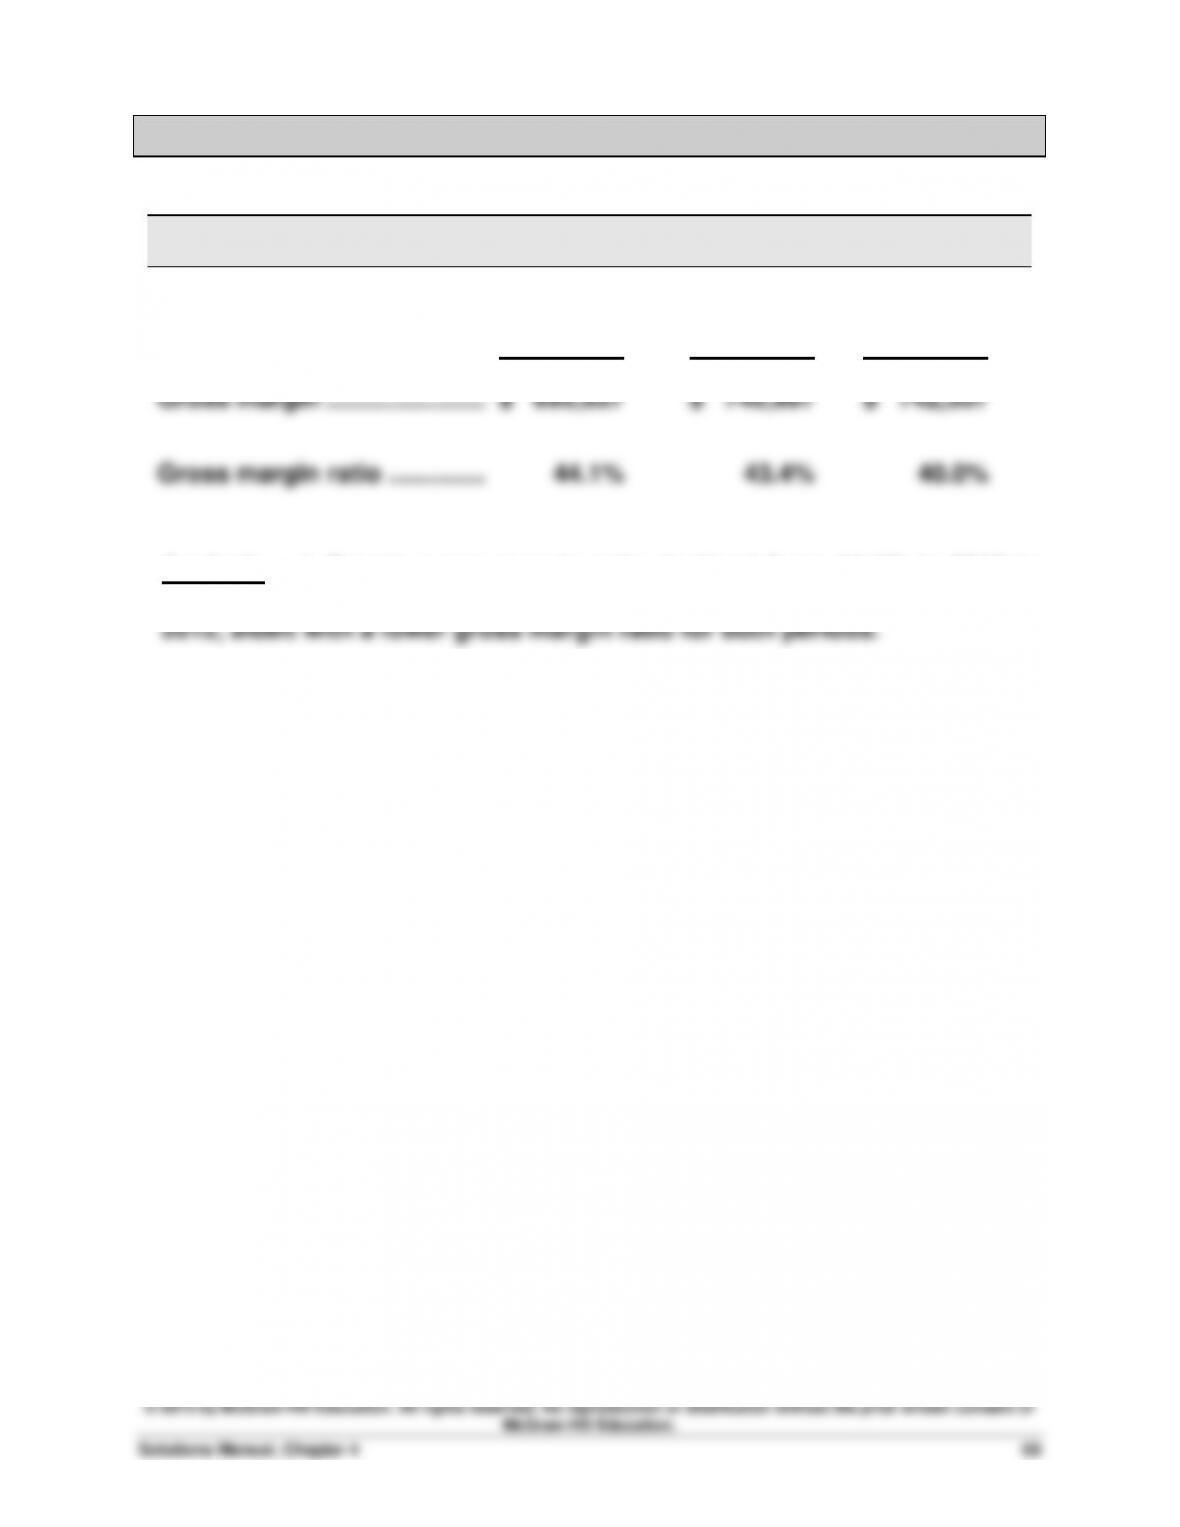
Fiscal Year ($ thousands)
2010
2011
2012
Net sales …………………………..
$1,578,042
$1,722,227
$1,854,988
Cost of goods sold …………..…………
882,385
975,230
1,112,481
Gross margin …………………..………
$ 695,657
$ 746,997
$ 742,507
Gross margin ratio …………..…………
44.1%
43.4%
40.0%
Analysis: J. Crew’s gross margin ratio declined from 44.1% in 2010 to
43.4% in 2011 to 40.0% in 2012. Its net sales increased in both 2011 and
© 2015 by McGraw-Hill Education. All rights reserved. No reproduction or distribution without the prior written consent of
McGraw-Hill Education.
Financial Accounting, 7th Edition
70
1.
a. Net sales computation
Sales …………………………………………………………………. $600,000
Less: Sales discounts ……………………………………… $ 13,000
Sales returns and allowances …………………. 20,000 33,000
Net sales …………………………..………………………………. $567,000
2. Net income is $141,000.
3. The inventory account balance is $84,000. If actual (physical) inventory
is $76,000, an $8,000 loss from inventory shrinkage occurred. This
would result in an adjustment necessitating a reduction (credit) to the
© 2015 by McGraw-Hill Education. All rights reserved. No reproduction or distribution without the prior written consent of
McGraw-Hill Education.
Solutions Manual, Chapter 4
71
1. Buffalo Wild Wings—Merchandising Segment
Forecasted Income Statement
For Year Ended January 31, 2014
2. The proposal yields a forecasted net income of $2,131,000. This compares
3. There are many issues that should be considered. Among them are:
• First, there is the issue of the prediction itself. That is, are estimates
reasonable or could reality be markedly different from these estimates?
• Second, and related to the first, there is a need to consider “ranges” of
possible scenarios since the future is unpredictable. This would involve
© 2015 by McGraw-Hill Education. All rights reserved. No reproduction or distribution without the prior written consent of
McGraw-Hill Education.
Financial Accounting, 7th Edition
72
1.
(in millions)
Samsung*
Apple
Google
Net sales …………………………..
₩201,103,613
$156,508
$50,175
Cost of sales …………………………..
125,651,931
87,846
20,634
Gross margin ……………..……………
₩ 74,451,682
$ 68,662
$29,541
Gross margin ratio ……..……………….
37.0%
43.9%
58.9%
*millions of Korean won
Gross Margin %
Rank
Google …………………………...….
58.9%
1
Apple ……………………………..….
43.9%
2
Samsung ………………………..…
37.0%
3
2. Samsung, Apple and Google each use the multiple-step format for their
income statements. Google’s income statement is a mix between