Chapter 13 – Analyzing and Interpreting Financial Statements
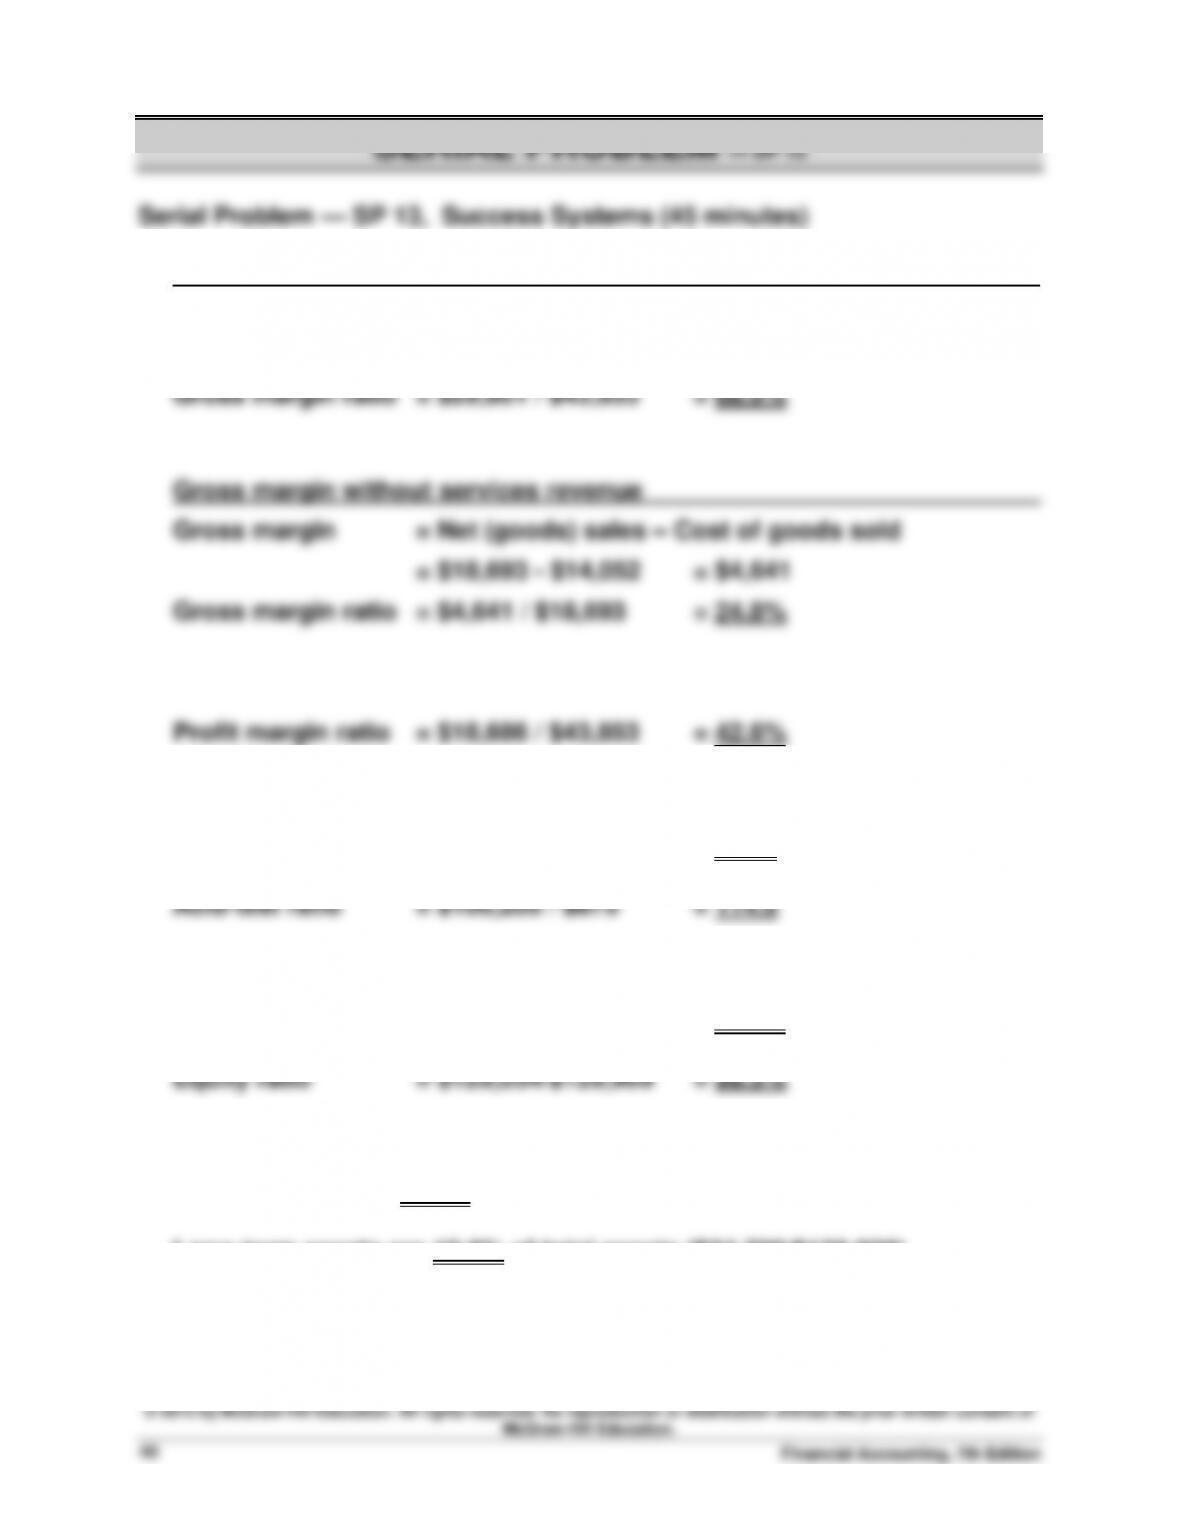
1. Gross margin with services revenue
Gross margin = Total revenue – Cost of goods sold
= $43,853 – $14,052 = $29,801
2. Current ratio = $105,209 / $875 = 120.2
3. Debt ratio = $875 / $129,909 = 0.7%
4. Current assets are 81.0% of total assets ($105,209/$129,909)
© 2015 by McGraw-Hill Education. All rights reserved. No reproduction or distribution without the prior written consent of
McGraw-Hill Education.
Solutions Manual, Chapter 13
41
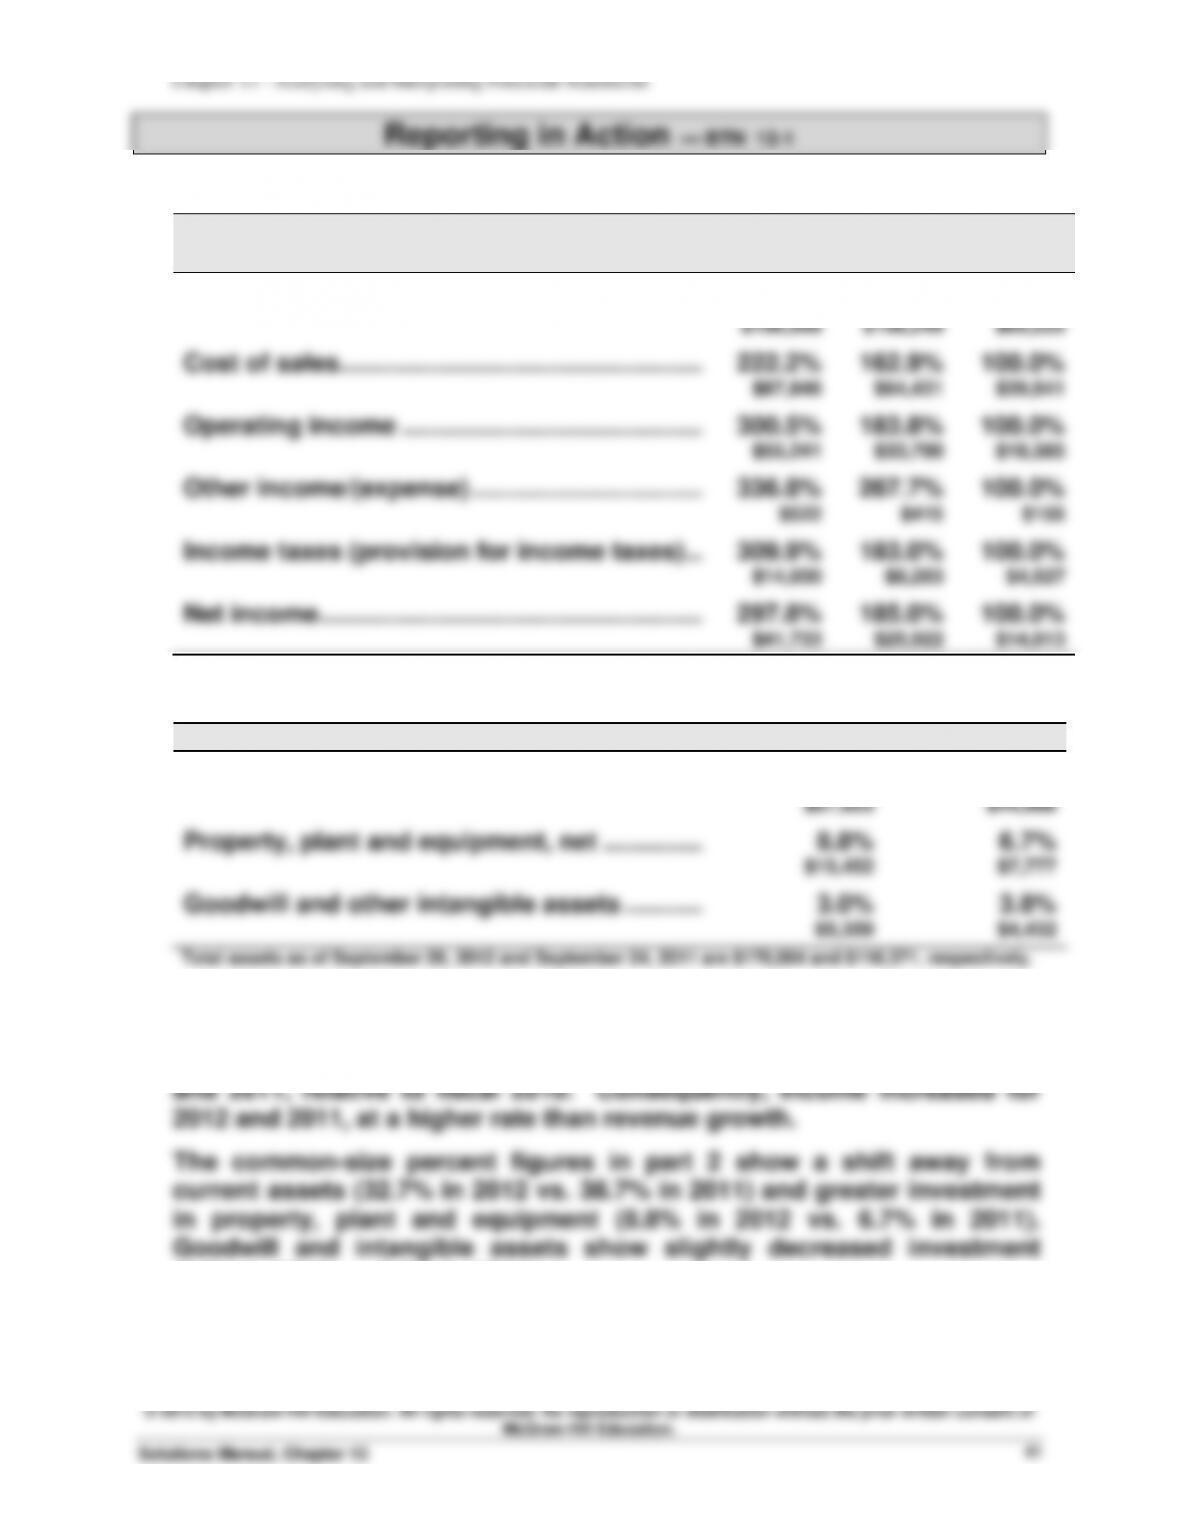
1. Trend percents for selected income statement accounts
($ in millions)
Fiscal
2012
Fiscal
2011
Fiscal
2010
Net Sales …………………………………………………..….
240.0%
166.0%
100.0%
$156,508
$108,249
$65,225
Cost of sales ……………………………………………..….
222.2%
162.9%
100.0%
$87,846
$64,431
$39,541
Operating income ……………………………………..….
300.5%
183.8%
100.0%
$55,241
$33,790
$18,385
Other income/(expense) …………………………….….
336.8%
267.7%
100.0%
$522
$415
$155
Income taxes (provision for income taxes) …….
309.9%
183.0%
100.0%
$14,030
$8,283
$4,527
Net income ………………………………………………..….
297.8%
185.0%
100.0%
$41,733
$25,922
$14,013
2. Common-size percents for asset categories and accounts
($ in millions)
Sep. 29, 2012
Sep. 24, 2011
Total current assets …………………………………..….
32.7%
38.7%
$57,653
$44,988
Property, plant and equipment, net ……………….
8.8%
6.7%
$15,452
$7,777
Goodwill and other intangible assets …………….
3.0%
3.8%
$5,359
$4,432
Total assets as of September 29, 2012 and September 24, 2011 are $176,064 and $116,371, respectively.
3. For fiscal 2012 and 2011, revenues grew at a higher rate than cost of
sales. Operating income grew at a higher rate than revenues for fiscal
2012 and 2011. Non-operating income increased substantially in 2012
(3.0% in 2012 vs. 3.8% in 2011).
4. Answers depend on the financial statement information obtained.
© 2015 by McGraw-Hill Education. All rights reserved. No reproduction or distribution without the prior written consent of
McGraw-Hill Education.
Financial Accounting, 7th Edition
42
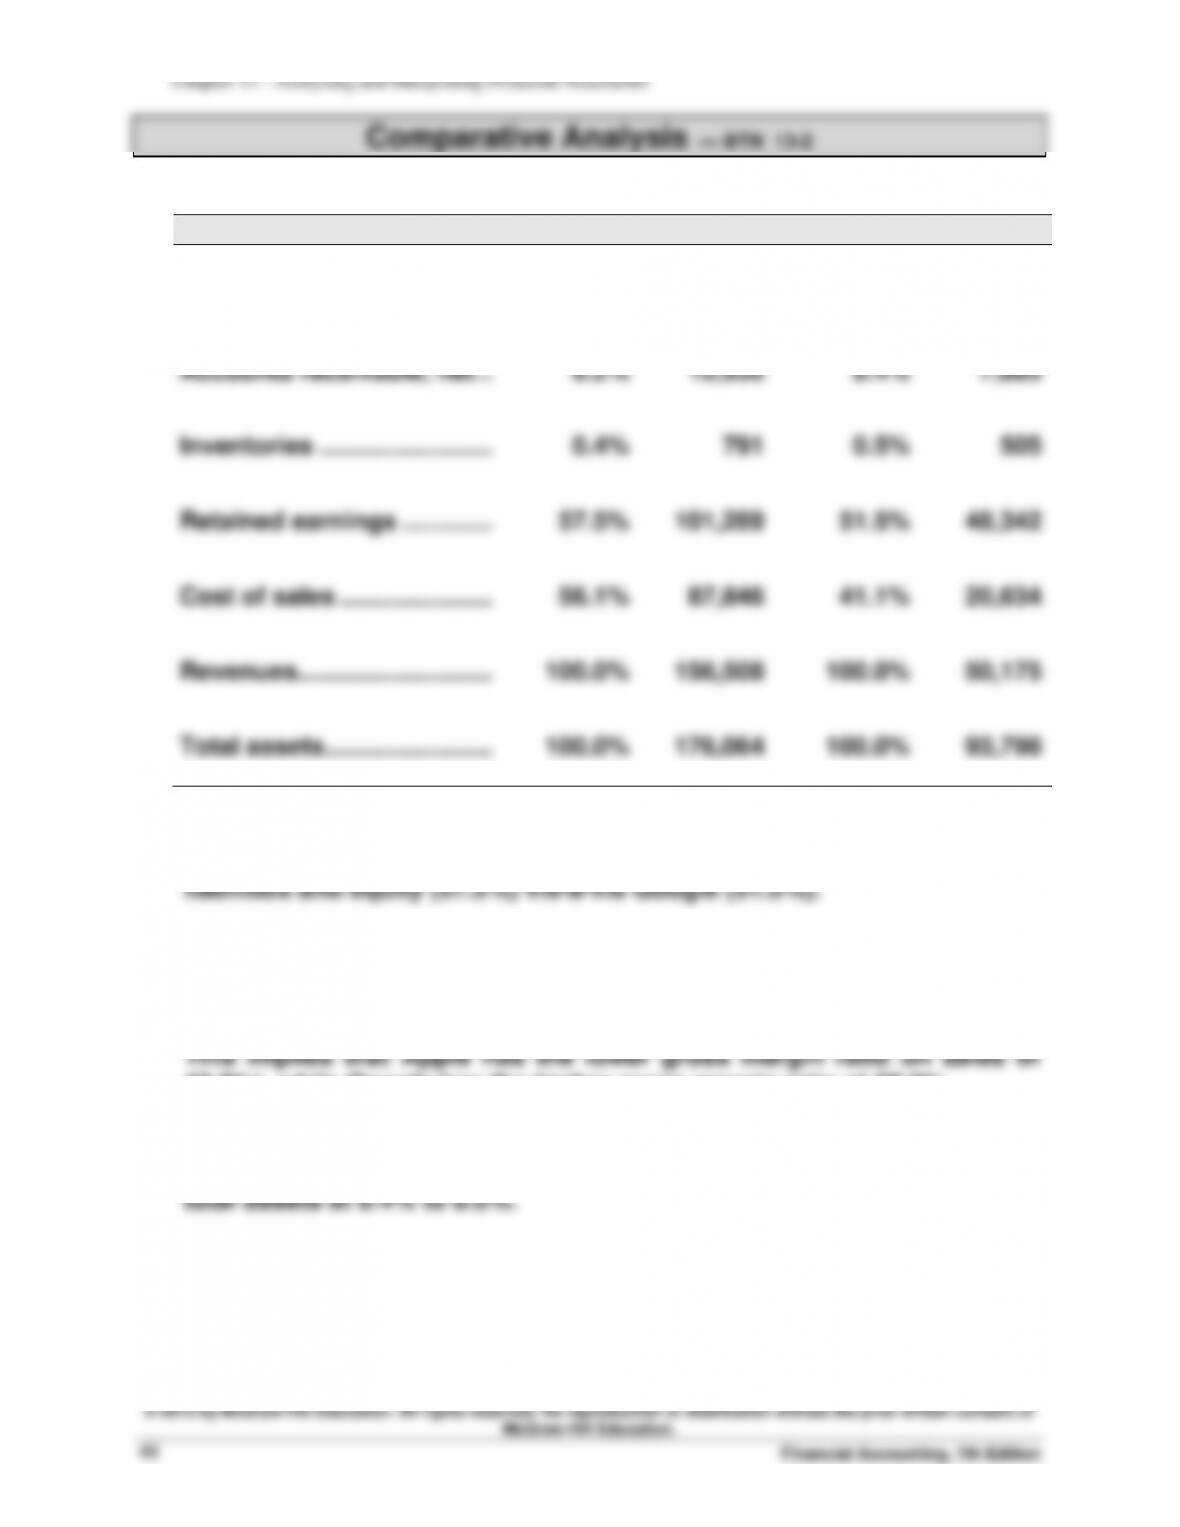
1.
Key figures ($ millions)
Apple
Google
Cash and equivalents ……..….
6.1%
$10,746
15.8%
$14,778
Accounts receivable, net …….
6.2%
10,930
8.4%
7,885
Inventories ……………………..….
0.4%
791
0.5%
505
Retained earnings …………..….
57.5%
101,289
51.5%
48,342
Cost of sales …………………..….
56.1%
87,846
41.1%
20,634
Revenues………………………..…
100.0%
156,508
100.0%
50,175
Total assets …………………….….
100.0%
176,064
100.0%
93,798
2. Apple’s retained earnings make up a greater percentage of its total
3. Apple’s cost of sales percent is higher at 56.1% compared to Google’s
at 41.1%.
43.9%), while Google has the higher gross margin ratio at 58.9%.
4. Both companies have approximately a similar percentage inventory of
© 2015 by McGraw-Hill Education. All rights reserved. No reproduction or distribution without the prior written consent of
McGraw-Hill Education.
Solutions Manual, Chapter 13
43
1. The CEO appears to have selectively chosen from the 11 available
ratios to present only the ones that show trends that are favorable to
2. The consequences of this action by the CEO might be mixed. It is likely
that the analysts will ask other questions that may reveal some
negative trends such as the trends in return and profit margins. The
CEO’s actions may become transparent to the analysts as they
discover the presence of less favorable trends through their questions.
© 2015 by McGraw-Hill Education. All rights reserved. No reproduction or distribution without the prior written consent of
McGraw-Hill Education.
Solutions Manual, Chapter 13
45
This is commonly referred to as trend analysis.
Vertical Analysis
Vertical analysis is comparing a company’s financial statement amounts to
a base amount. Usually this base amount is a total or aggregate amount.
An income statement’s base is usually total revenue and a balance sheet’s
b. Solvency analysis measures a company’s long-run financial viability and
its ability to cover long-term obligations.
c. Profitability analysis measures a company’s ability to generate an
adequate return on invested capital.
d. Market analysis measures the company’s returns (for example, EPS and
© 2015 by McGraw-Hill Education. All rights reserved. No reproduction or distribution without the prior written consent of
McGraw-Hill Education.
Financial Accounting, 7th Edition
46
1. No. Although the current ratio improved over the three-year period, the
acid-test ratio declined and accounts receivable and merchandise
paid.
2. No. The decreasing turnover of accounts receivable indicates the
3. No. Sales are increasing and accounts receivable are turning more
4. Yes. To illustrate, if sales are assumed to equal $100 in 2010, the sales
$33.33 for plant assets in 2010 ($100/ 3.0), $37.88 in 2011 ($125/ 3.3) and
$39.14 in 2012 ($137/ 3.5).
5. No. The percent of return on equity declines from 12.25% in 2010 to
9.75% in 2012.
6. The dollar amount of selling expenses increased in 2011 and decreased
and $13.43 in 2012.
Hitting the Road — BTN 13-8
One possible strategy to fulfill the requirements of this assignment is:
Assume that a $37,500 salary will be earned upon graduation at age 25.
Also, assume that the level of investment will be at 8% of your salary (or
© 2015 by McGraw-Hill Education. All rights reserved. No reproduction or distribution without the prior written consent of
McGraw-Hill Education.
Solutions Manual, Chapter 13
47