Chapter 10 – Analysis of Governmental Financial Performance
10–10
Ch. 10, Solutions (Cont’d)
10-14.
a. The solution to this case will depend on which year’s Financial Trends report each
FINANCIAL FACTORS:
Fixed Costs: General Fund
Fringe Benefits: General Fund and Utilities
Operating Position: Transit, Airport, Parking, and Storm Water Enterprise Funds
b. Students will, of course, formulate different questions; however, you should expect them
to address the warnings identified in part a. For example: What is driving the number of
warnings in the enterprise funds’ operating position? Is anything being done to
General Problem Information: Financial trends
Learning Objective: 10-3
Learning Objective: 10-4
Topic: Use of Benchmarks to Aid Interpretation
Bloom’s Taxonomy: Analyze
Accreditation Skills tag: AACSB: Analytical Thinking, AICPA: BB Critical Thinking
Level of Difficulty: Hard
Solutions to Exercises and Problems
10-15. The specific solution to this exercise will depend on which city’s CAFR is evaluated.
Generally, the analysis for each ratio should follow the approach shown in Illustrations
10-3 and 10-4, and summarized in Illustrations 10-5 and 10-6 for the City of Columbia.
Each student should present a well-organized and well written paper, detailing his or her
Chapter 10 – Analysis of Governmental Financial Performance
10–11
Ch. 10, Solutions, 10-15 (Cont’d)
General Problem Information: Examine the CAFR
Learning Objective: 10-3
Learning Objective: 10-4
Topic: Use of Benchmarks to Aid Interpretation
Bloom’s Taxonomy: Analyze
Accreditation Skills tag: AACSB: Analytical Thinking, AICPA: FN Measurement and
Reporting
Level of Difficulty: Hard
10-16. 1. b. 6. b.
General Problem Information: Various
Learning Objective: 10-1
10-17.
a. –
f. +
k. –
b. –
g. –
l. –
c. +
h. –
m. +
d. –
i. +
n. NE (see Note)
e. +
j. –
o. NE
Chapter 10 – Analysis of Governmental Financial Performance
10–12
Ch. 10, Solutions, 10-17 (Cont’d)
Bloom’s Taxonomy: Understand
Accreditation Skills tag: AACSB: Knowledge Application AICPA: FN Measurement
Level of Difficulty: Medium
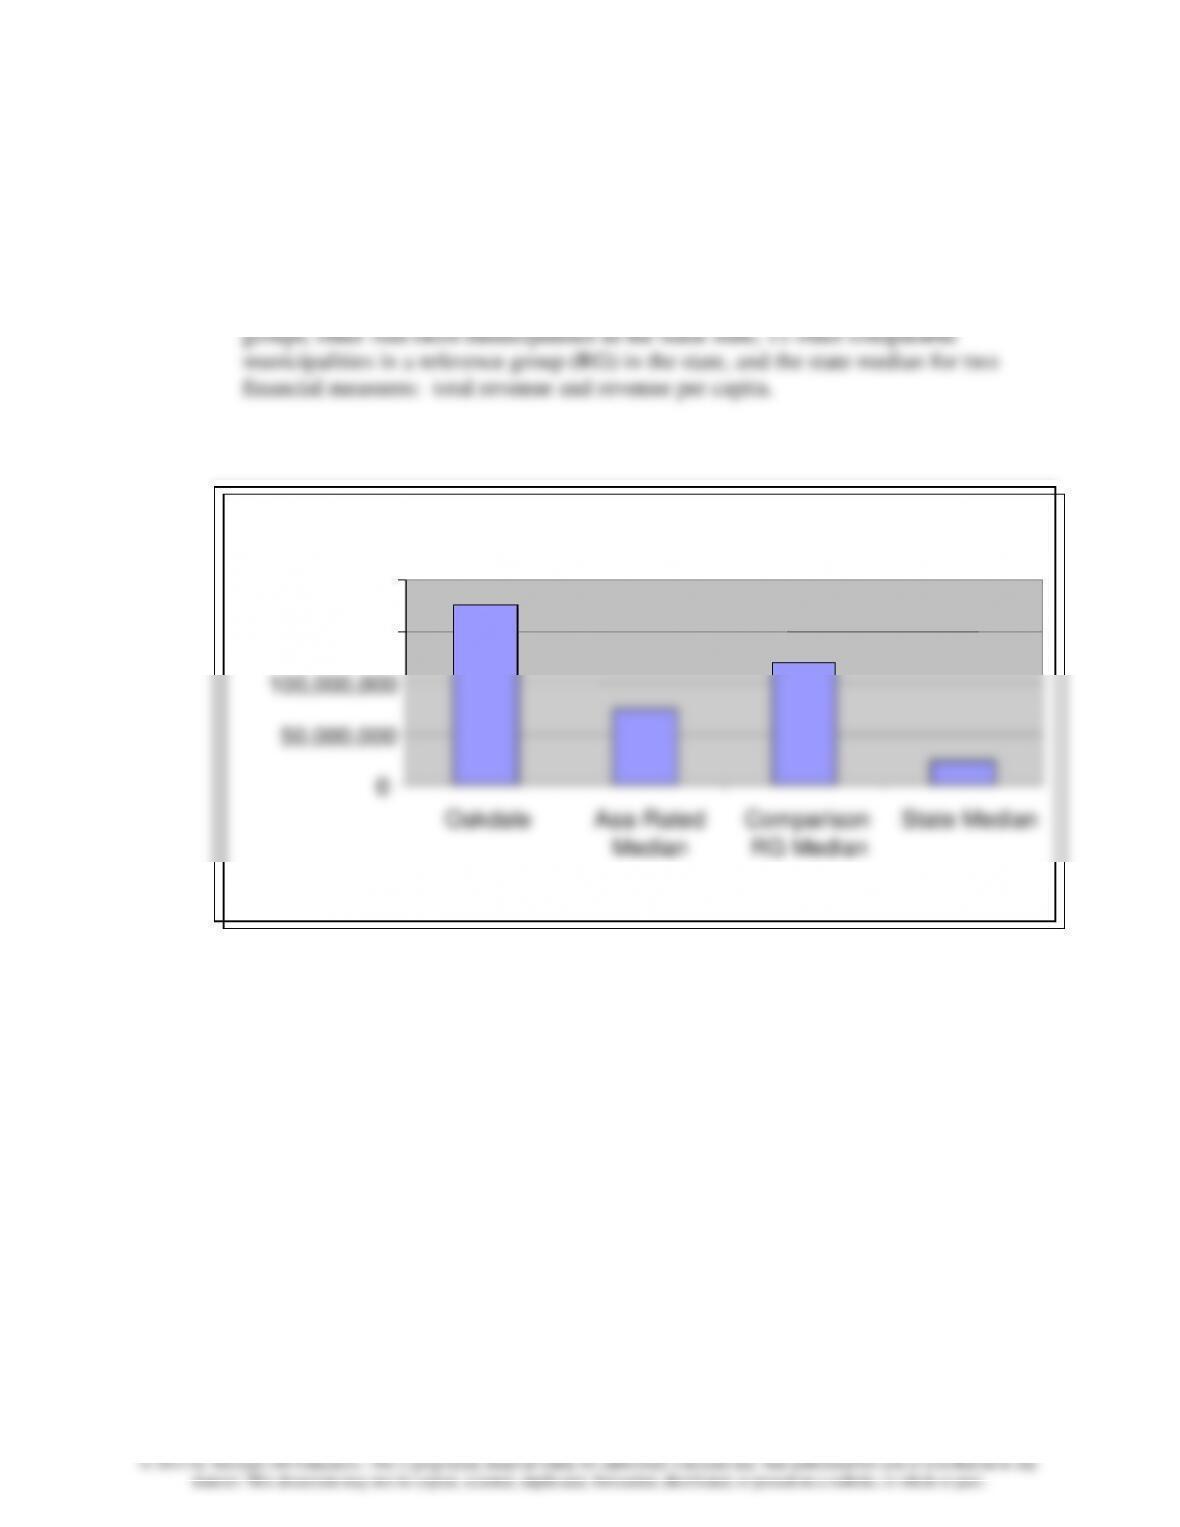
10-18. a. Here is a graphical presentation of the Town of Oakdale compared to three reference
FY 2017 Total Revenue
0
50,000,000
100,000,000
150,000,000
200,000,000
Oakdale
Aaa-Rated
Median
Comparison
RG Median
State Median
Comparison Groups
$ of Total Revenue
Chapter 10 – Analysis of Governmental Financial Performance
10–13
Ch. 10, Solutions, 10-18 (Cont’d)
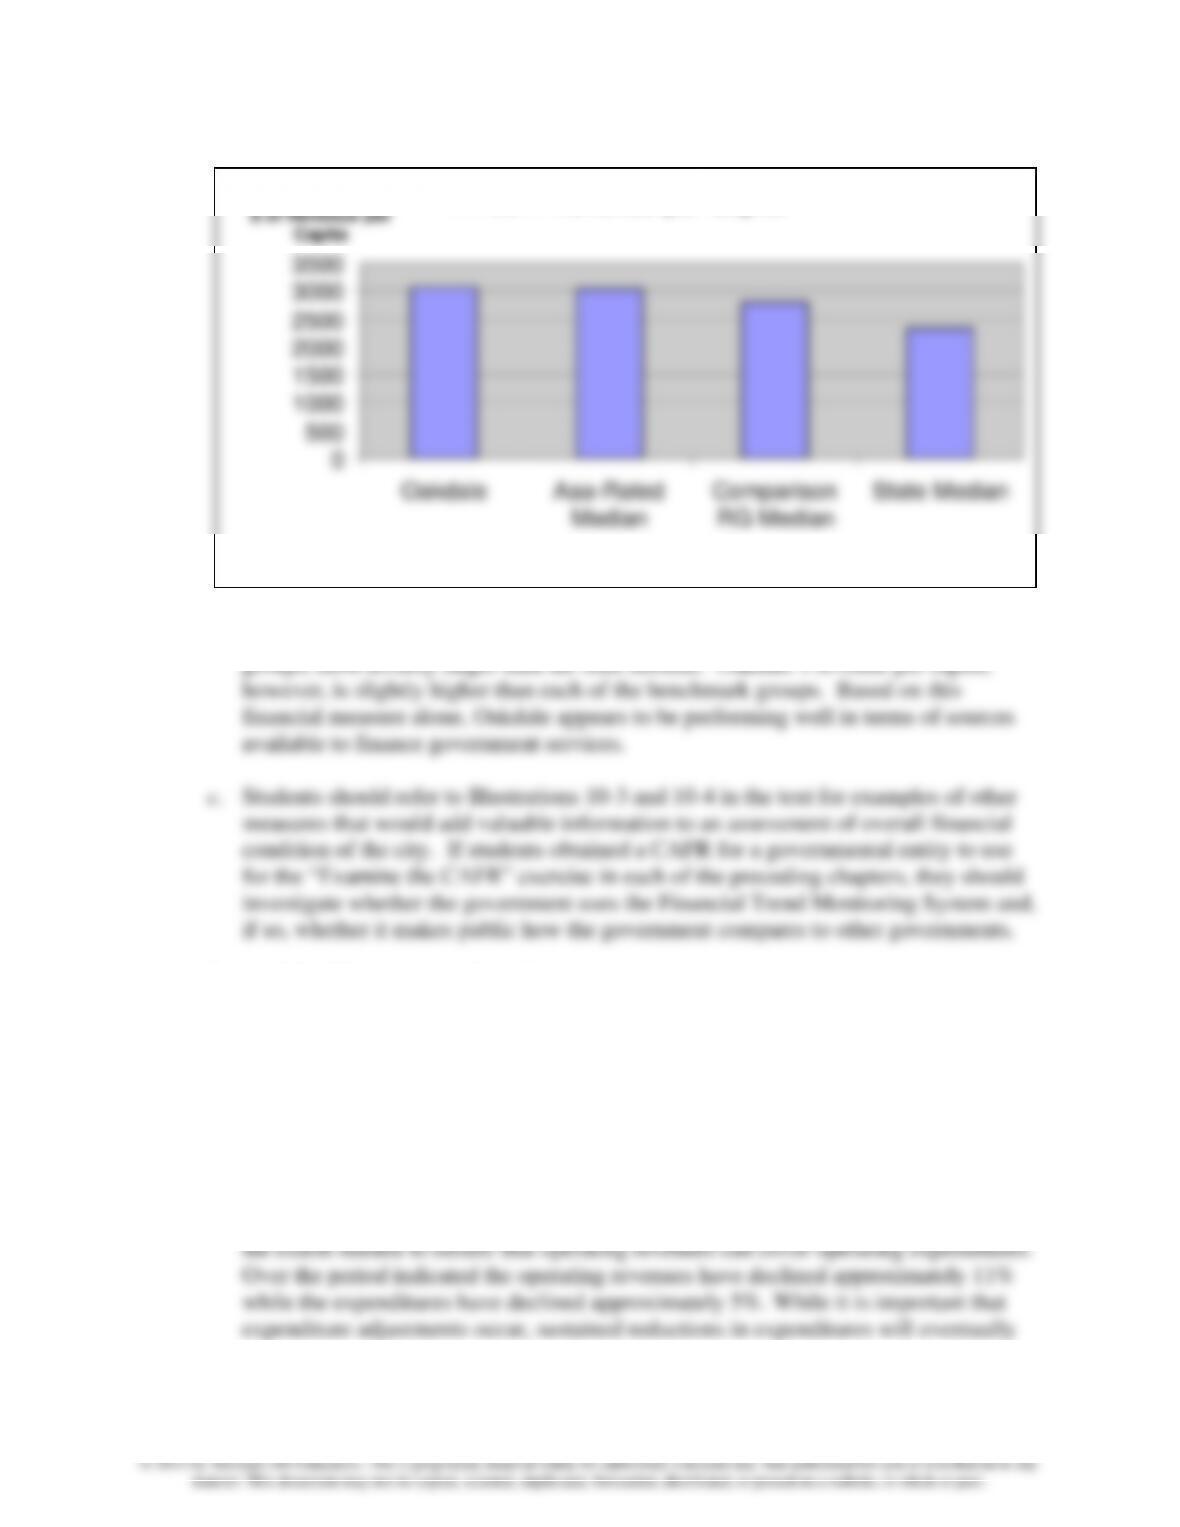
b. Oakdale has a much higher amount of total revenue for FY 2017 than its reference
groups, most notably larger than the state median. Oakdale’s revenue per capita,
General Problem Information: Financial trends
Learning Objective: 10-3
Learning Objective: 10-4
Topic: Use of Benchmarks to Aid Interpretation
Bloom’s Taxonomy: Analyze
Accreditation Skills tag: AACSB: Analytical Thinking, AICPA: FN Decision Making
Level of Difficulty: Hard
10-19. a. The fact that St. Cloud has been able to decrease expenditures is a positive trend.
However, it should be noted that the city has been unable to decrease expenditures to
FY 2017 Revenue per Capita
0
500
1000
1500
2000
2500
3000
3500
Oakdale
Aaa-Rated
Median
Comparison
RG Median
State Median
Comparison Groups
$ of Revenue per
Capita
Chapter 10 – Analysis of Governmental Financial Performance
10–14
Ch. 10, Solutions, 10-19 (Cont’d)
impact the ability of the government to provide services. Another positive trend is the
improving General Fund balance as a percentage of revenues. Over the time period
b. The remaining ratios for St. Cloud appear to be in decline. The city has a decrease in
operating revenue per capita over time, which may be seen as a negative financial
condition trend. Decreasing revenues indicates a worsening or lessening of the ability
to provide services. One source of the decline in revenues is related to
c. Given that the country is well into the economic recovery, St. Cloud appears to be
struggling. The majority of its indicators are trending down. Although the percentage
of the General Fund balance relative to all operating revenues is very large (some
Chapter 10 – Analysis of Governmental Financial Performance
10–15
Ch. 10, Solutions, 10-19(Cont’d)
economy is impacting St. Cloud); organizational factors (management practices and
experience); financial factors such as revenue diversity, long-term debt structure, and
unfunded liabilities.
General Problem Information: Financial Trend Monitoring System
Learning Objective: 10-3
Learning Objective: 10-4
Topic: Internal Financial Trend Monitoring
Bloom’s Taxonomy: Analyze
Accreditation Skills tag: AACSB: Analytical Thinking, AICPA: FN Decision Making
Level of Difficulty: Hard
10-20. a. The performance measures shown in Illustration 10-4 use data from the basic
1. Unrestricted net position
2. Capital asset condition
3. Debt to assets
Measures (11) bonded debt per capita, (12) available debt limit, and (13) property
Chapter 10 – Analysis of Governmental Financial Performance
Ch. 10, Solutions, 10-20 (Cont’d)
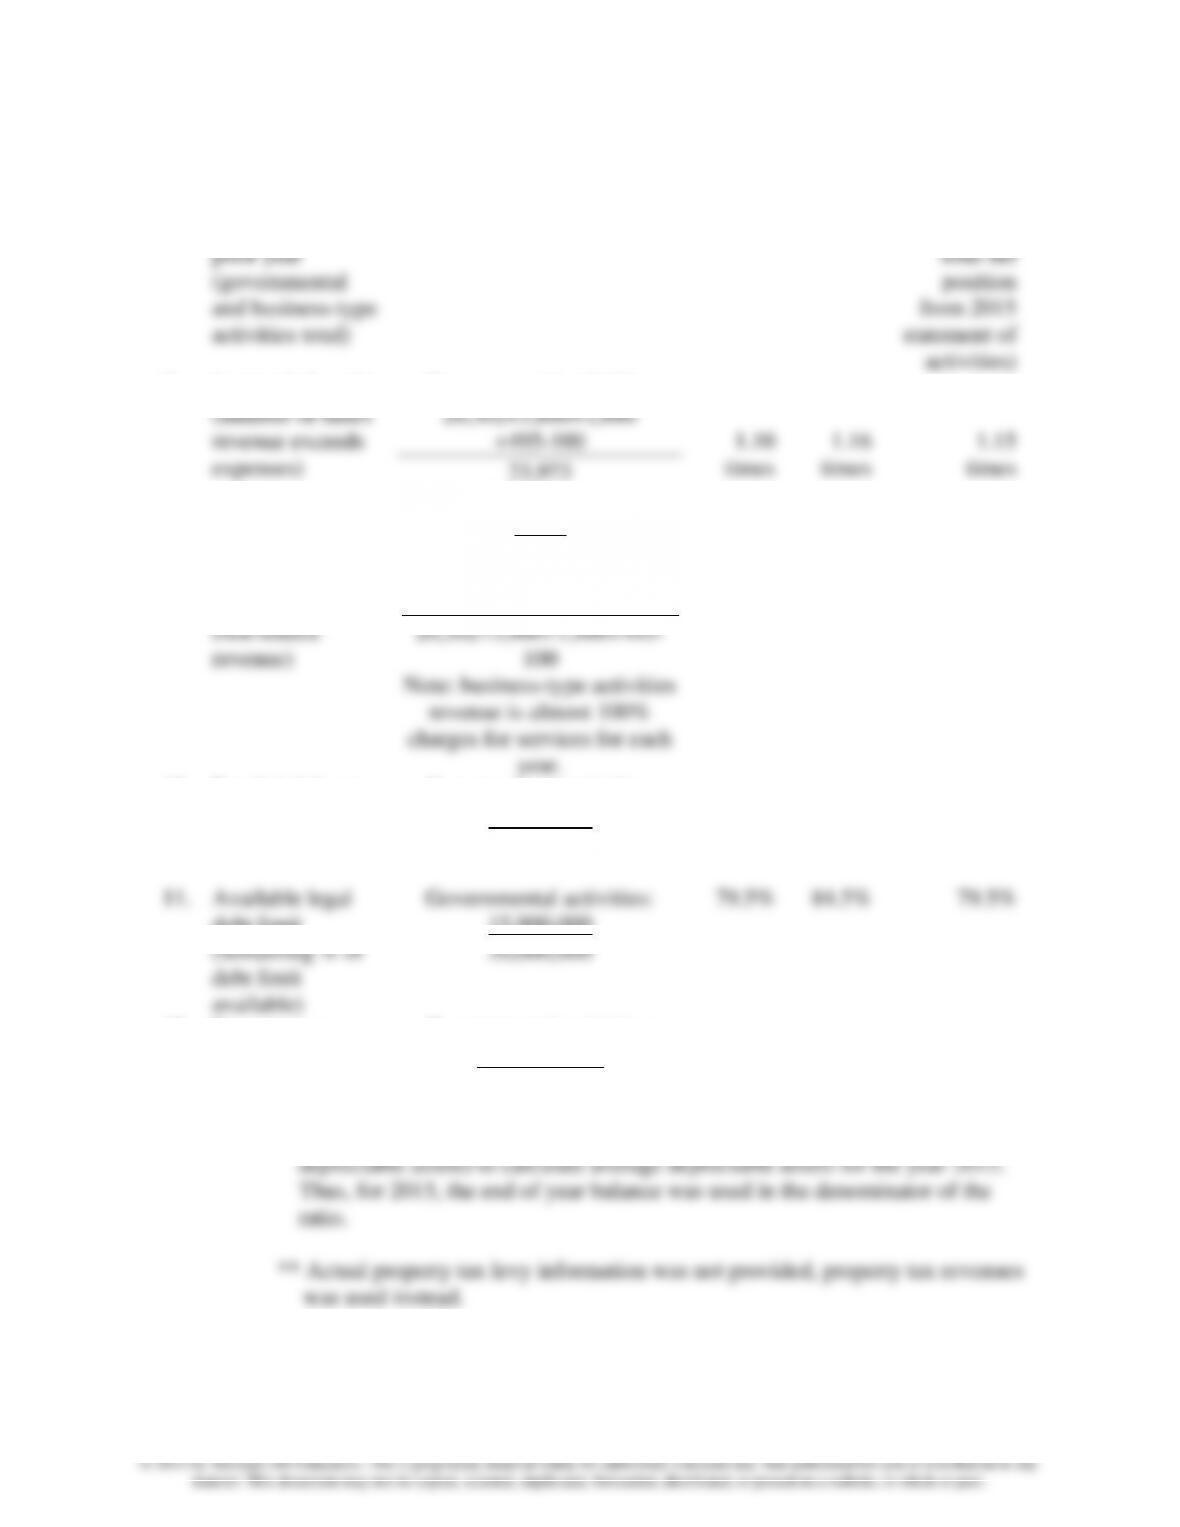
b.
City of Arborland
Government-wide Financial Performance Measures
2017 Calculations
2017
2016
2015
(see Ill. 10-4 for definition
of ratios)
($ or % or number of times)
1.
Ending
unrestricted net
position as a % of
annual revenue
Governmental activities:
4,597
20,302+3,860+1,886+495
Business-type activities:
3,546
5,218+7
17%
68%
14%
51%
13%
85%
2.
Capital asset
condition (% of
useful life left in
depreciable
capital assets)
Governmental activities:
15,039
(37,183+37,600)/2*
Business-type activities:
3,681
(17,775+14,455)/2*
40%
23%
44%
60%
50%
50%
3.
Debt to assets
(total liabilities as
a % of total
assets)
Governmental activities:
19,266
34,040
Business-type activities:
7,167
14,740
57%
49%
61%
61%
68%
57%
4.
Current ratio
Governmental activities:
9,299
3,366
Business-type activities:
3,966
667
2.76
times
5.95
times
4.49
times
6.19
times
2.03
times
6.86
times
5.
Quick ratio
Governmental activities:
9,299-253-26
3,366
Business-type activities:
3,966-8-58
667
2.68
times
5.85
times
4.31
times
6.10
times
1.92
times
6.75
Times
Chapter 10 – Analysis of Governmental Financial Performance
Ch. 10, Solutions, 10-20 (Cont’d)
6.
Change in net
position from the
prior year
(governmental
and business-type
activities total)
22,347 – 17,447
$4,900
$3,220
$3,867
(change in
total net
position
from 2015
statement of
activities)
7.
Interperiod equity
(number of times
revenue exceeds
expenses)
Governmental activities:
20,302+3,860+1,886
+495-100
23,973
for BTA see next ratio
1.10
times
1.16
times
1.15
times
8.
BTA self-
sufficiency
5,218
2,895
1.80
times
1.00
times
1.41
times
9.
Revenue
dispersion (% of
own-source
revenue)
Governmental activities:
3,860+1,886+495+2,190+716
20,302+3,860+1,886+495-
100
Note: business-type activities
revenue is almost 100%
charges for services for each
year.
34.6%
37.7%
35.2%
10.
Bonded debt per
capita
Governmental activities:
15,900,000
30,420
$522.68
$597.36
$602.87
11.
Available legal
debt limit
(remaining % of
debt limit
available)
Governmental activities:
15,900,000
20,000,000
79.5%
84.5%
79.5%
12.
Property taxes
per capita
Governmental activities:
17,296,000**
30,420
$568.57
$481.39
$496.70
* Insufficient information is available (i.e., the beginning of the year balance of
Chapter 10 – Analysis of Governmental Financial Performance
10–18
© 2013 by McGraw-Hill Education. This is proprietary material solely for authorized instructor use. Not authorized for sale or distribution in any
manner. This document may not be copied, scanned, duplicated, forwarded, distributed, or posted on a website, in whole or part.
Ch. 10, Solutions, 10-20 (Cont’d)
c. The City of Arborland appears to be in strong financial condition based on the
following interpretations of the ratios calculated for part b: Unrestricted net position
has increased each of the three years in both governmental and business-type
activities; capital assets still have at least half of their useful lives to go; the current
and quick ratios indicate that the government is liquid and can pay its current
liabilities; there is still capacity to issue more debt if needed. Some indicators that
should be watched include the relatively high amount of debt as a percent of total
assets.
General Problem Information: Financial trends
Learning Objective: 10-4
Topic: Analyzing Government-wide Financial Statements
Bloom’s Taxonomy: Apply
Accreditation Skills tag: AACSB: Knowledge Application, AICPA: FN Measuring
Level of Difficulty: Hard