Exercise 5-15A (20 minutes)
Periodic Inventory
Ending
Inventory
Cost of
Goods Sold
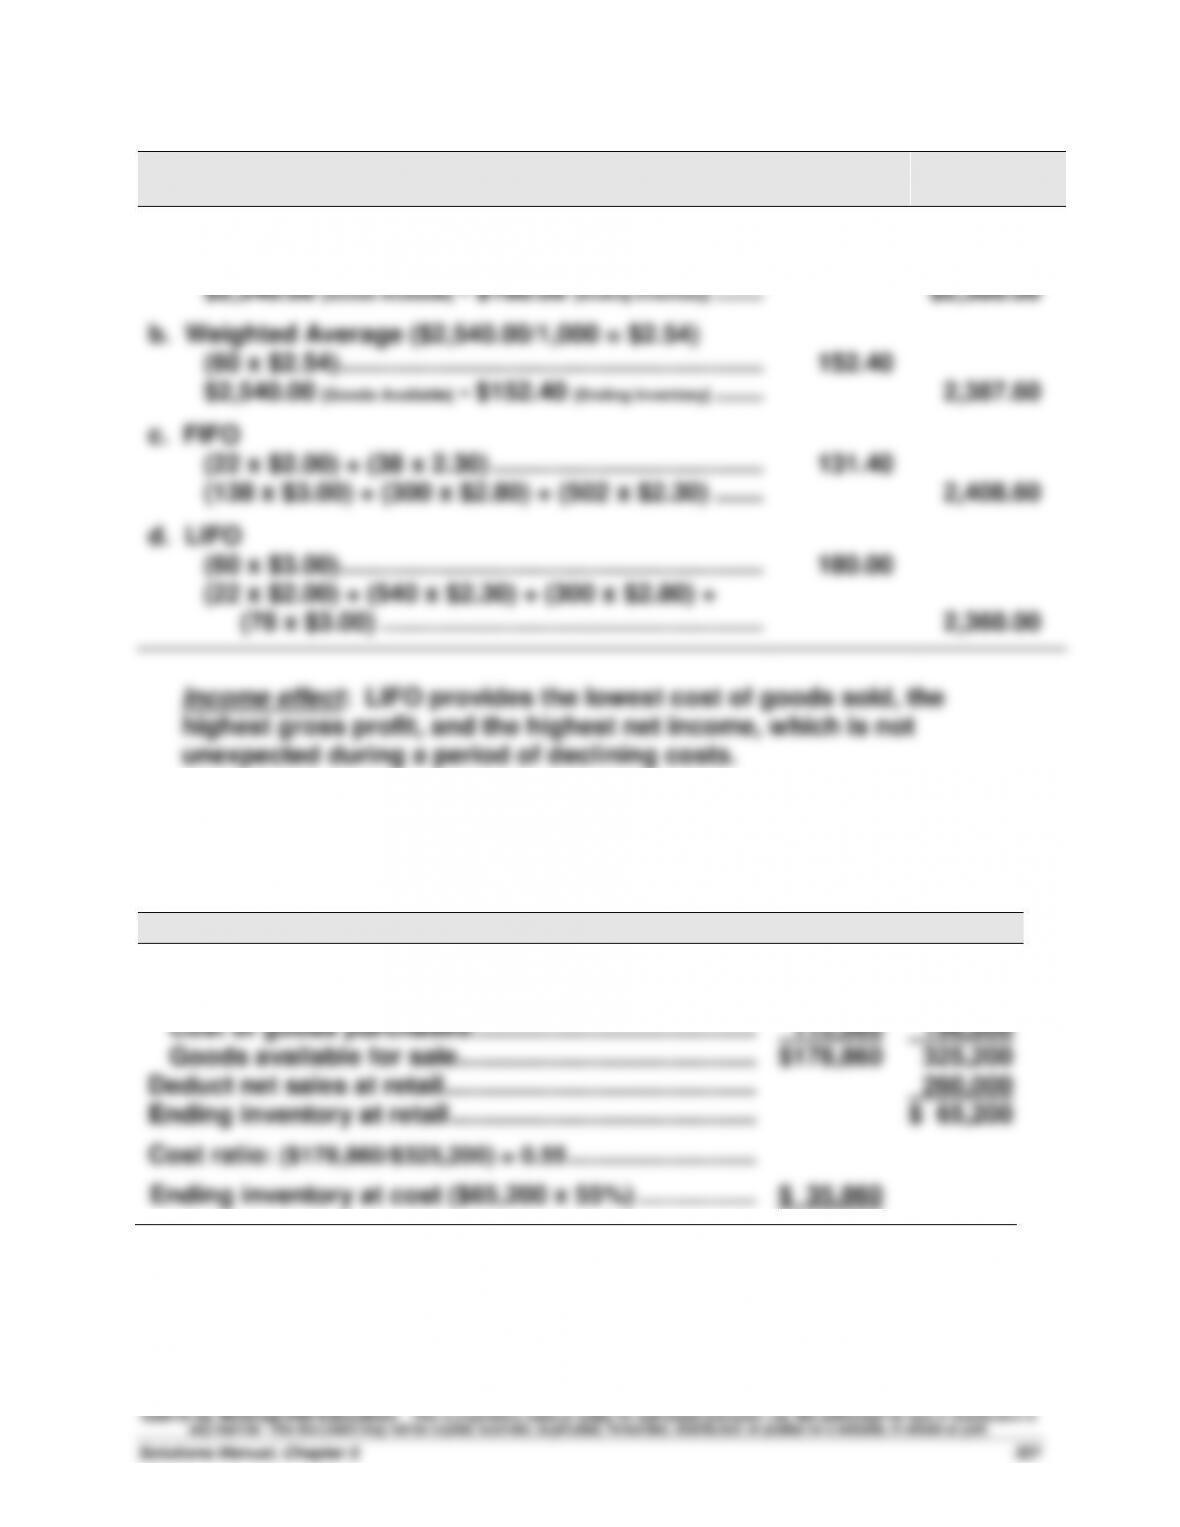
a. Specific Identification
(50 x $2.80) + (10 x $2.00) ……………………………….
$160.00
$2,540.00 [Goods Available] – $160.00 [Ending Inventory] …….
$2,380.00
b. Weighted Average ($2,540.00/1,000 = $2.54)
(60 x $2.54) …………………………………………………….
152.40
$2,540.00 [Goods Available] – $152.40 [Ending Inventory] …….
2,387.60
c. FIFO
(22 x $2.00) + (38 x 2.30) …………………………………
131.40
(138 x $3.00) + (300 x $2.80) + (502 x $2.30) …….
2,408.60
d. LIFO
(60 x $3.00) …………………………………………………….
180.00
(22 x $2.00) + (540 x $2.30) + (300 x $2.80) +
(78 x $3.00) ……………………………………………….
2,360.00
Income effect: LIFO provides the lowest cost of goods sold, the
highest gross profit, and the highest net income, which is not
unexpected during a period of declining costs.
Exercise 5-16B (20 minutes)
At Cost
At Retail
Goods available for sale
Beginning inventory …………………………………………...
$ 63,800
$128,400
Cost of goods purchased…………………………………....
115,060
196,800
Goods available for sale…………………………..………....
$178,860
325,200
Deduct net sales at retail………………………………………..
260,000
Ending inventory at retail ……………………………………....
$ 65,200
Cost ratio: ($178,860/$325,200) = 0.55 ………………………..
Ending inventory at cost ($65,200 x 55%) ……………....
$ 35,860
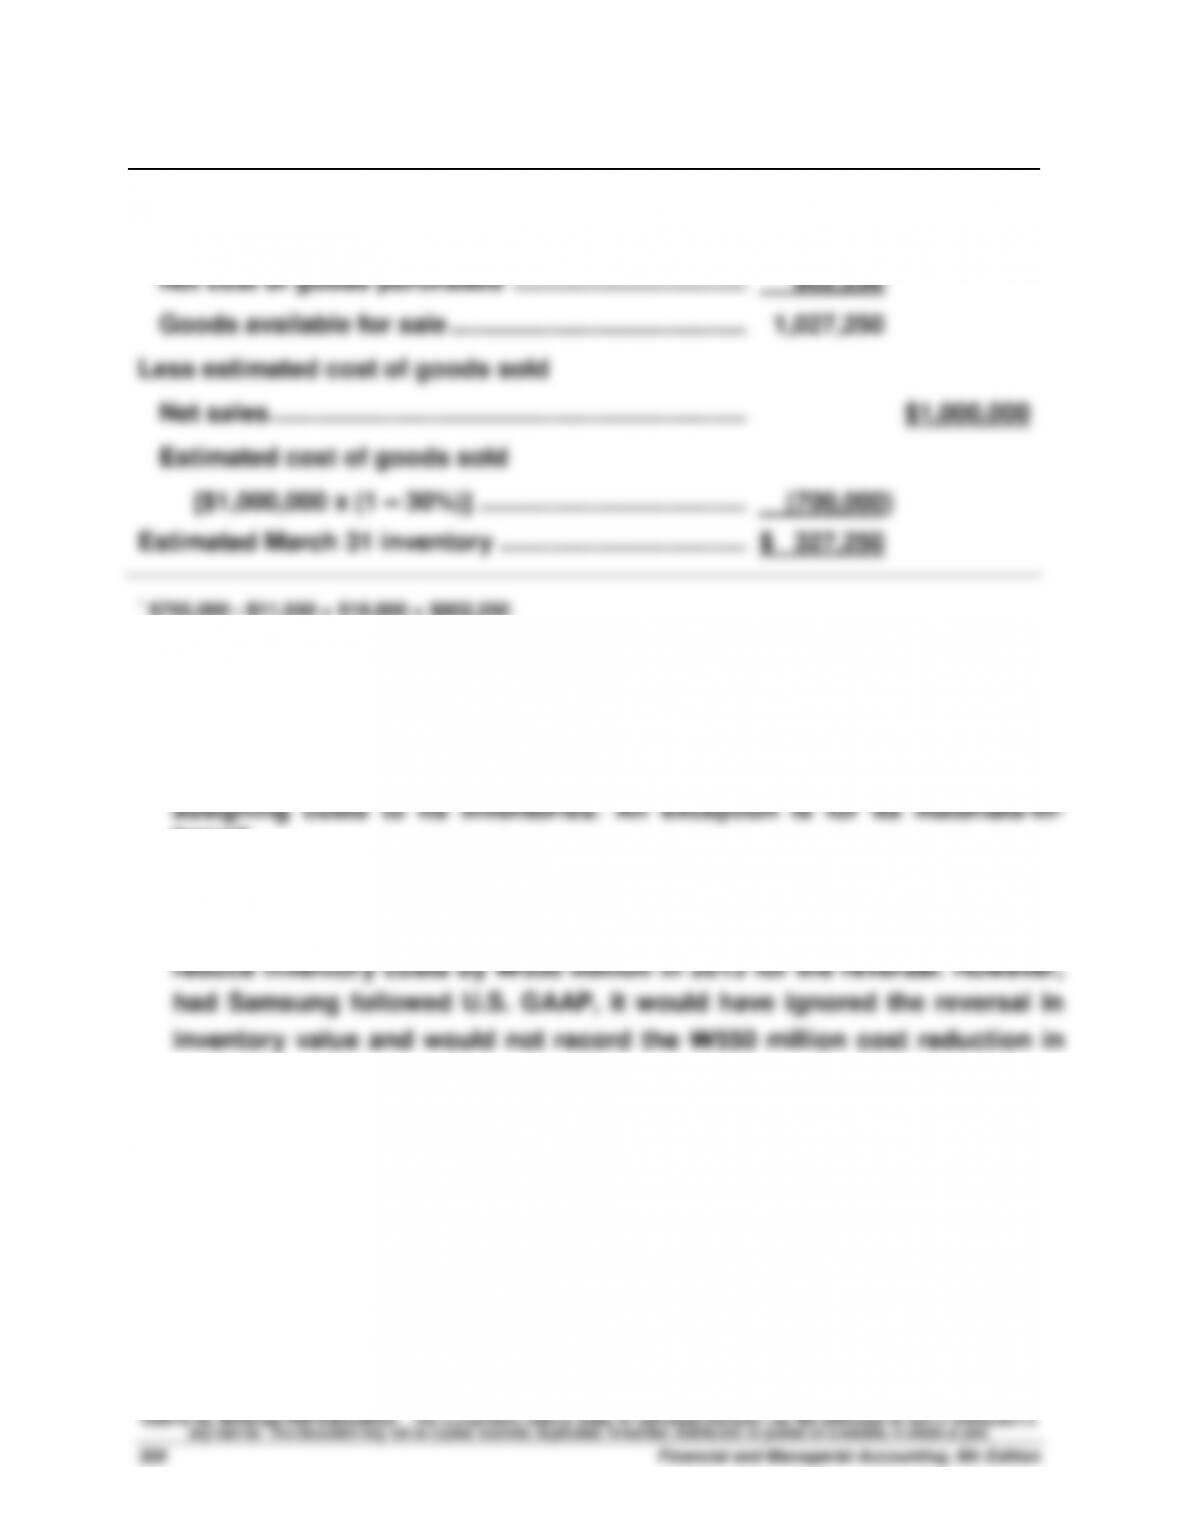
Exercise 5-17B (20 minutes)
Goods available for sale
Inventory, January 1 ………………………………………….….
$ 225,000
Net cost of goods purchased* …………………………….….
802,250
Goods available for sale …………………………………….….
1,027,250
Less estimated cost of goods sold
Net sales …………………………..……………………………….….
$1,000,000
Estimated cost of goods sold
[$1,000,000 x (1 – 30%)] …………………………………….
(700,000)
Estimated March 31 inventory ………………………………….
$ 327,250
* $795,000 – $11,550 + $18,800 = $802,250
Exercise 5-18 (15 minutes)
1. Samsung generally applies the (weighted) average cost assumption when
transit.
2. Under IFRS, Samsung would reverse inventory valuation losses if
inventory values increased in subsequent periods. Specifically, it would
2013.
PROBLEM SET A
Problem 5-1A (40 minutes)
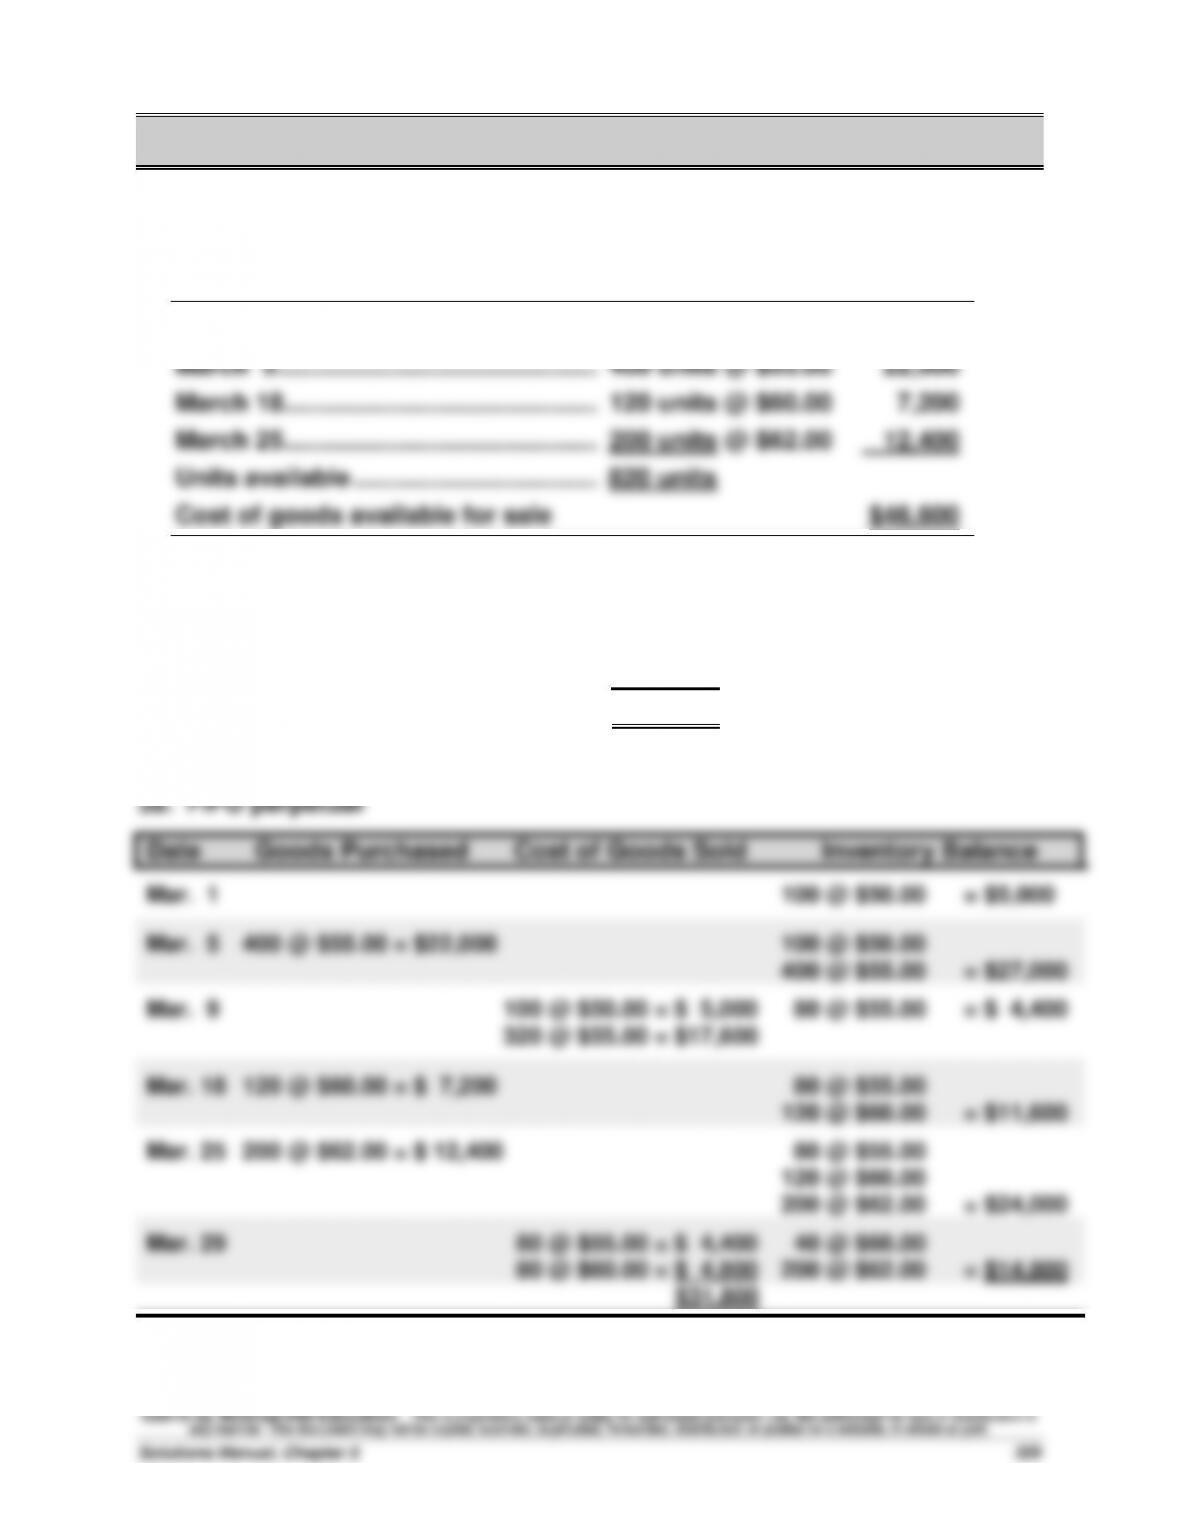
1. Compute cost of goods available for sale and units available for sale
Beginning inventory ……………………...
100 units @ $50.00
$ 5,000
March 5 ………………………………………...
400 units @ $55.00
22,000
March 18 ………………………………………..
120 units @ $60.00
7,200
March 25 ………………………………………..
200 units @ $62.00
12,400
Units available ……………………………….
820 units
Cost of goods available for sale
$46,600
2. Units in ending inventory
Units available (from part 1) …………..…………..
820 units
Less: Units sold (420 + 160) …………..…………..
580 units
Ending Inventory (units) ………………..…………
240 units
Problem 5-1A (Continued)
3b. LIFO perpetual
Date
Goods Purchased
Cost of Goods Sold
Inventory Balance
Mar. 1
100 @ $50.00 = $ 5,000
Mar. 5
400@ $55.00= $22,000
100 @ $50.00
400 @ $55.00 = $27,000
Mar. 9
400 @ $55.00 = $22,000
20 @ $50.00 = $ 1,000
80 @ $50.00 = $ 4,000
Mar. 18
120@ $60.00= $ 7,200
80 @ $50.00
120 @ $60.00 = $11,200
Mar. 25
200@ $62.00= $12,400
80 @ $50.00
120 @ $60.00
200 @ $62.00 = $23,600
Mar. 29
160 @ $62.00 = $ 9,920
80 @ $50.00
120 @ $60.00
40 @ $62.00 = $13,680
$32,920
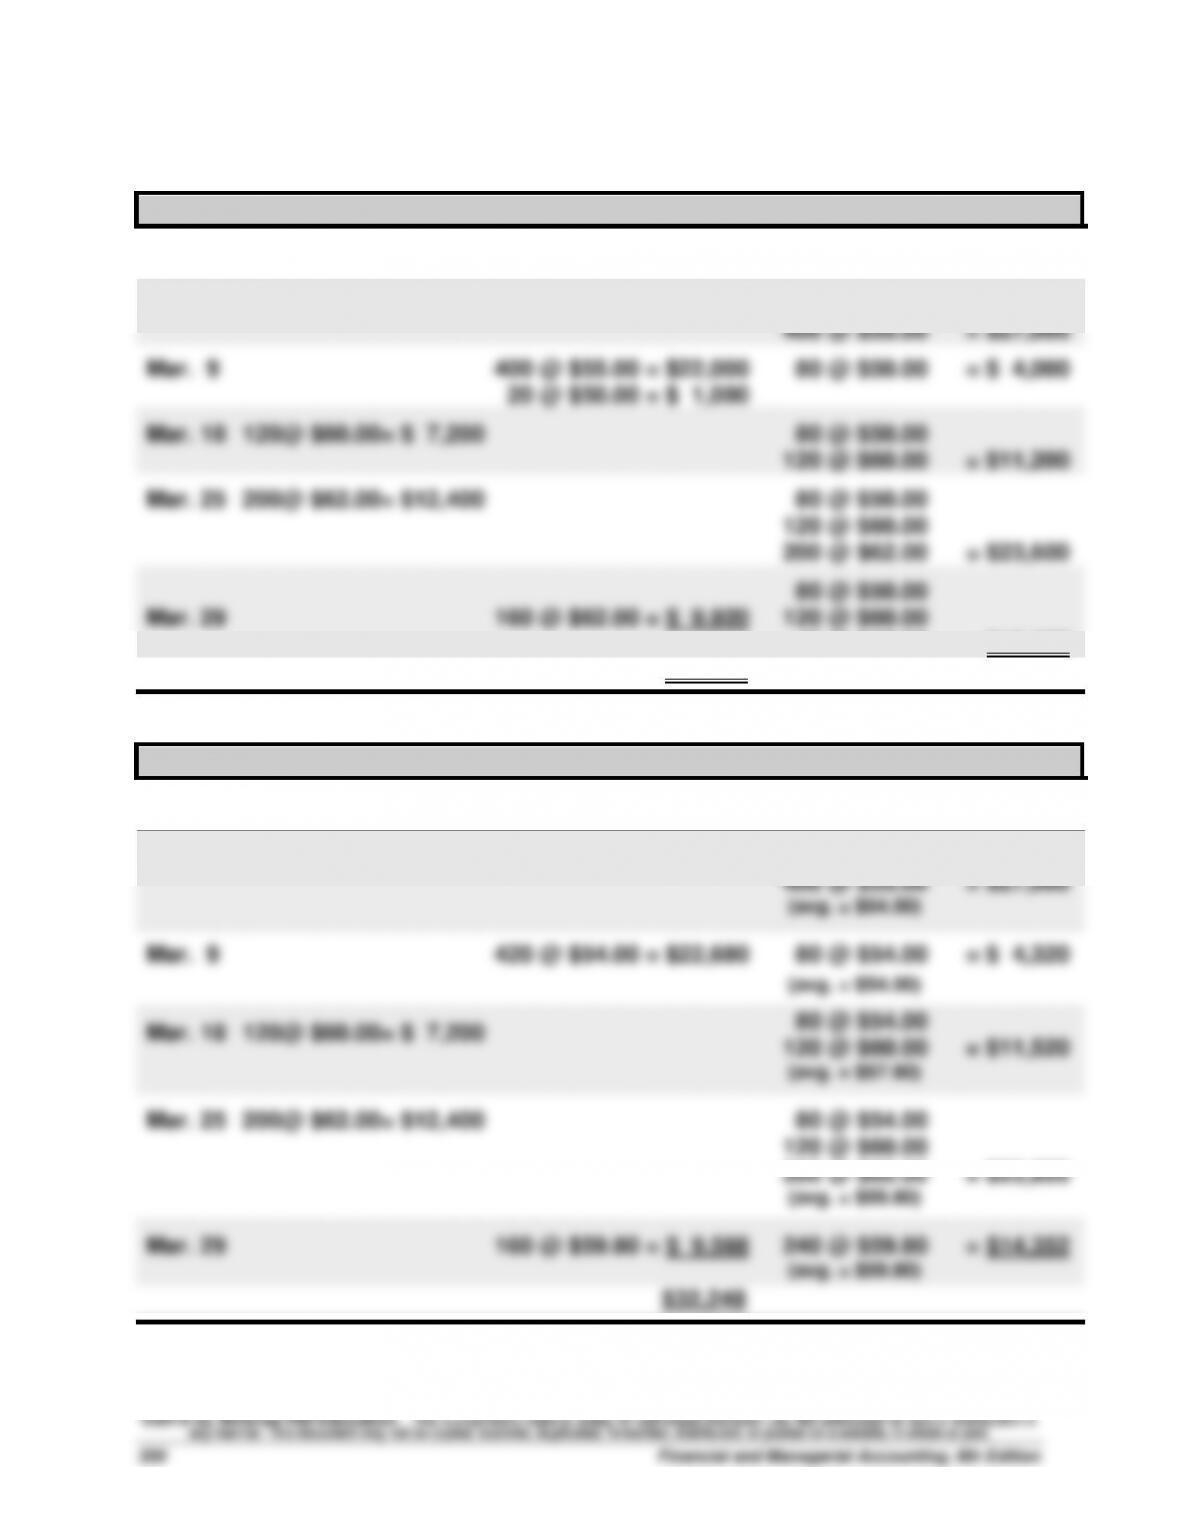
3c. Weighted Average perpetual
Date
Goods Purchased
Cost of Goods Sold
Inventory Balance
Mar. 1
100 @ $50.00 = $ 5,000
Mar. 5
400@ $55.00= $22,000
100 @ $50.00
400 @ $55.00 = $27,000
(avg. = $54.00)
Mar. 9
420 @ $54.00 = $22,680
80 @ $54.00 = $ 4,320
(avg. = $54.00)
Mar. 18
120@ $60.00= $ 7,200
80 @ $54.00
120 @ $60.00 = $11,520
(avg. = $57.60)
Mar. 25
200@ $62.00= $12,400
80 @ $54.00
120 @ $60.00
200 @ $62.00 = $23,920
(avg. = $59.80)
Mar. 29
160 @ $59.80 = $ 9,568
240 @ $59.80 = $14,352
(avg. = $59.80)
$32,248
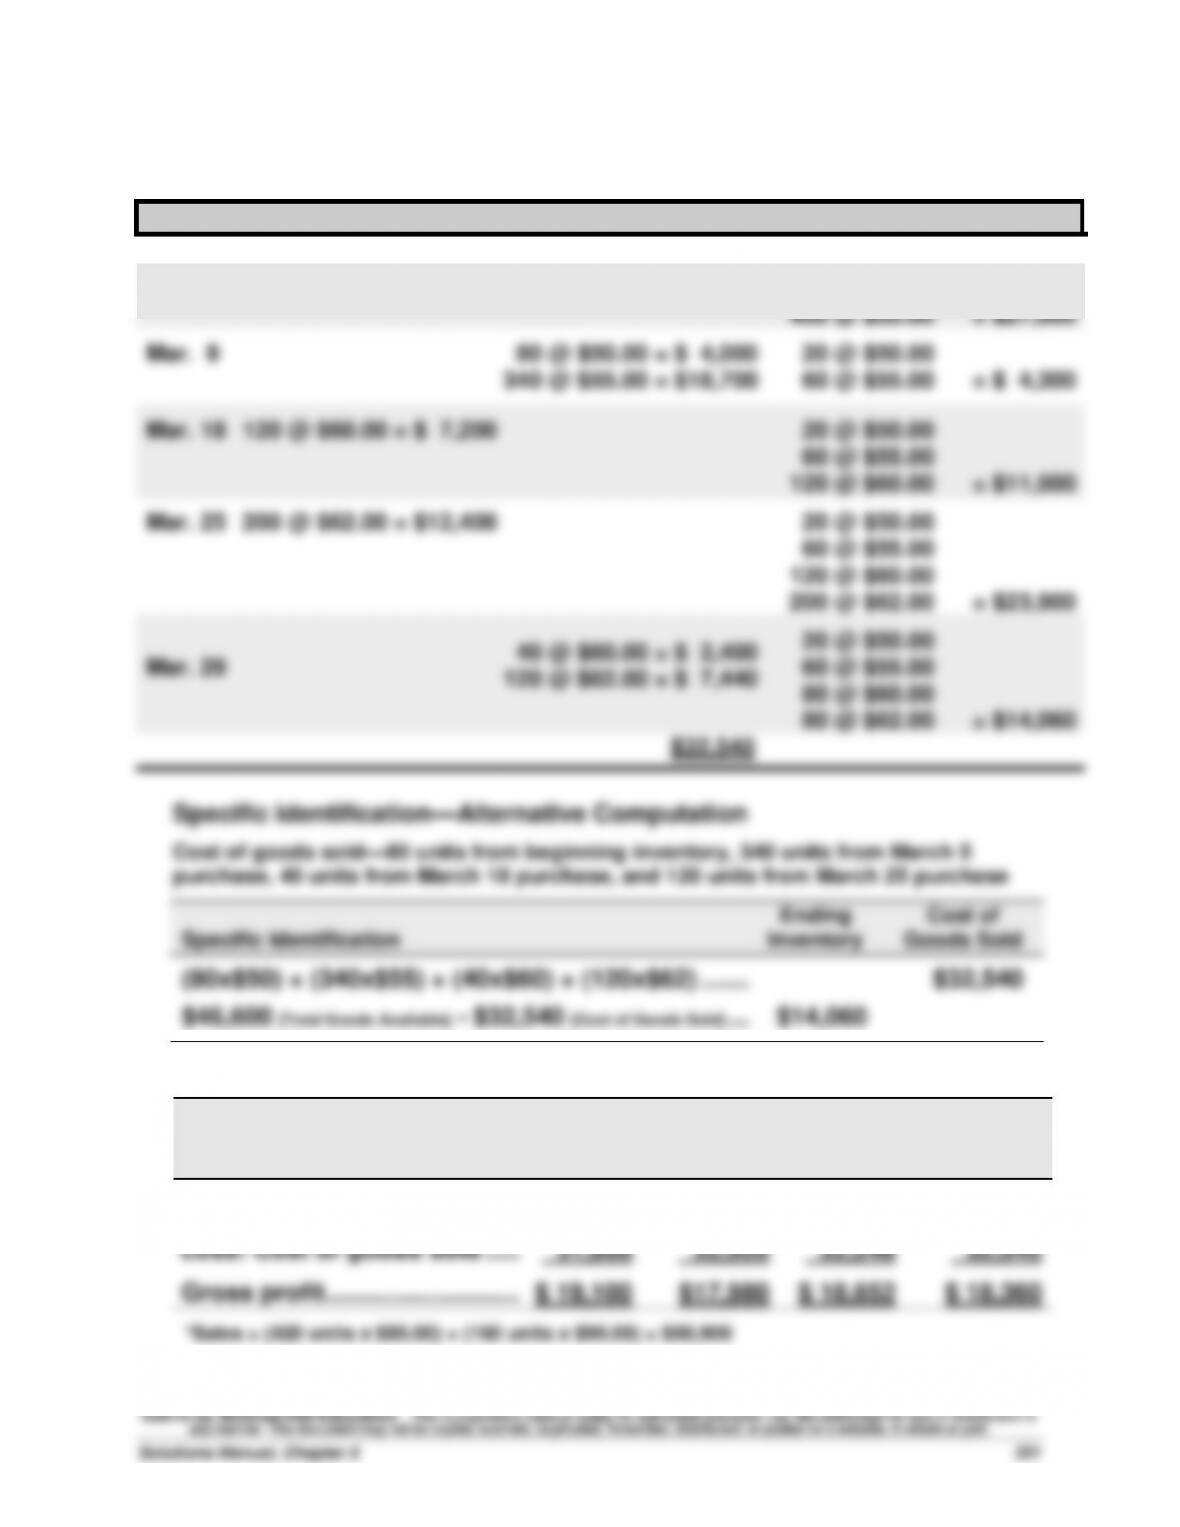
Problem 5-1A (Concluded)
3d. Specific Identification
Date
Goods Purchased
Cost of Goods Sold
Inventory Balance
Mar. 1
100 @ $50.00 = $ 5,000
Mar. 5
400 @ $55.00 = $22,000
100 @ $50.00
400 @ $55.00 = $27,000
Mar. 9
80 @ $50.00 = $ 4,000
340 @ $55.00 = $18,700
20 @ $50.00
60 @ $55.00 = $ 4,300
Mar. 18
120 @ $60.00 = $ 7,200
20 @ $50.00
60 @ $55.00
120 @ $60.00 = $11,500
Mar. 25
200 @ $62.00 = $12,400
20 @ $50.00
60 @ $55.00
120 @ $60.00
200 @ $62.00 = $23,900
Mar. 29
40 @ $60.00 = $ 2,400
120 @ $62.00 = $ 7,440
20 @ $50.00
60 @ $55.00
80 @ $60.00
80 @ $62.00 = $14,060
$32,540
Specific identification—Alternative Computation
Cost of goods sold—80 units from beginning inventory, 340 units from March 5
purchase, 40 units from March 18 purchase, and 120 units from March 25 purchase
Ending Cost of
Specific Identification Inventory Goods Sold
(80x$50) + (340x$55) + (40x$60) + (120x$62) ……. $32,540
$46,600 [Total Goods Available] – $32,540 [Cost of Goods Sold] … $14,060
4.
FIFO
LIFO
Weighted
Average
Specific
Identifi-
cation
Sales* ………………………………..
$50,900
$50,900
$50,900
$50,900
Less: Cost of goods sold …...
31,800
32,920
32,248
32,540
Gross profit ………………………..
$ 19,100
$17,980
$ 18,652
$ 18,360
*Sales = (420 units x $85.00) + (160 units x $95.00) = $50,900
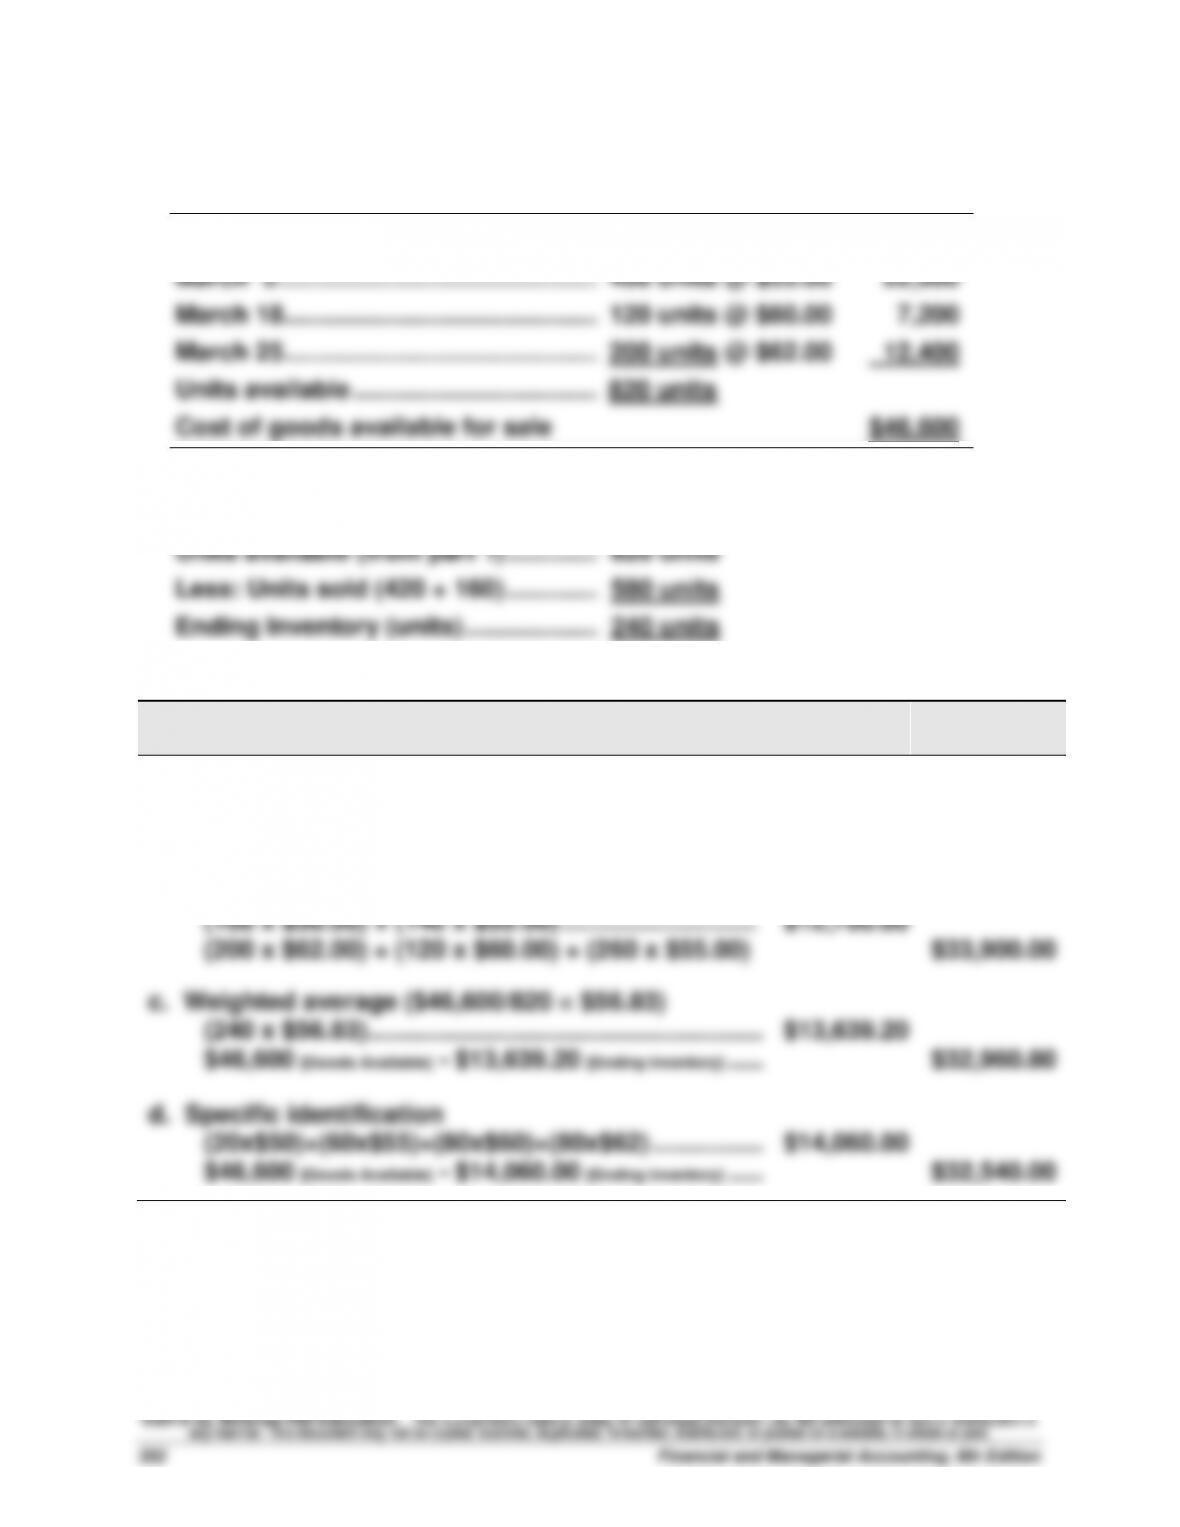
Problem 5-2A (40 minutes)
1. Compute cost of goods available for sale and units available for sale
Beginning inventory ……………………...
100 units @ $50.00
$ 5,000
March 5 ………………………………………...
400 units @ $55.00
22,000
March 18 ………………………………………..
120 units @ $60.00
7,200
March 25 ………………………………………..
200 units @ $62.00
12,400
Units available ……………………………….
820 units
Cost of goods available for sale
$46,600
2. Units in ending inventory
Units available (from part 1) …………..…………..
820 units
Less: Units sold (420 + 160) …………..…………..
580 units
Ending Inventory (units) ………………..…………
240 units
3.
Periodic Inventory
Ending
Inventory
Cost of
Goods Sold
a. FIFO
(200 x $62.00) + (40 x $60.00) ………………………….
$14,800.00
(100 x $50.00) + (400 x $55.00) + (80 x $60.00) …
$31,800.00
b. LIFO
(100 x $50.00) + (140 x $55.00) ……………………….
$12,700.00
(200 x $62.00) + (120 x $60.00) + (260 x $55.00)
$33,900.00
c. Weighted average ($46,600/820 = $56.83)
(240 x $56.83)…………………………..…………………….
$13,639.20
$46,600 [Goods Available] – $13,639.20 [Ending Inventory] …..
$32,960.80
d. Specific identification
(20x$50)+(60x$55)+(80x$60)+(80x$62) …………….
$14,060.00
$46,600 [Goods Available] – $14,060.00 [Ending Inventory] …..
$32,540.00
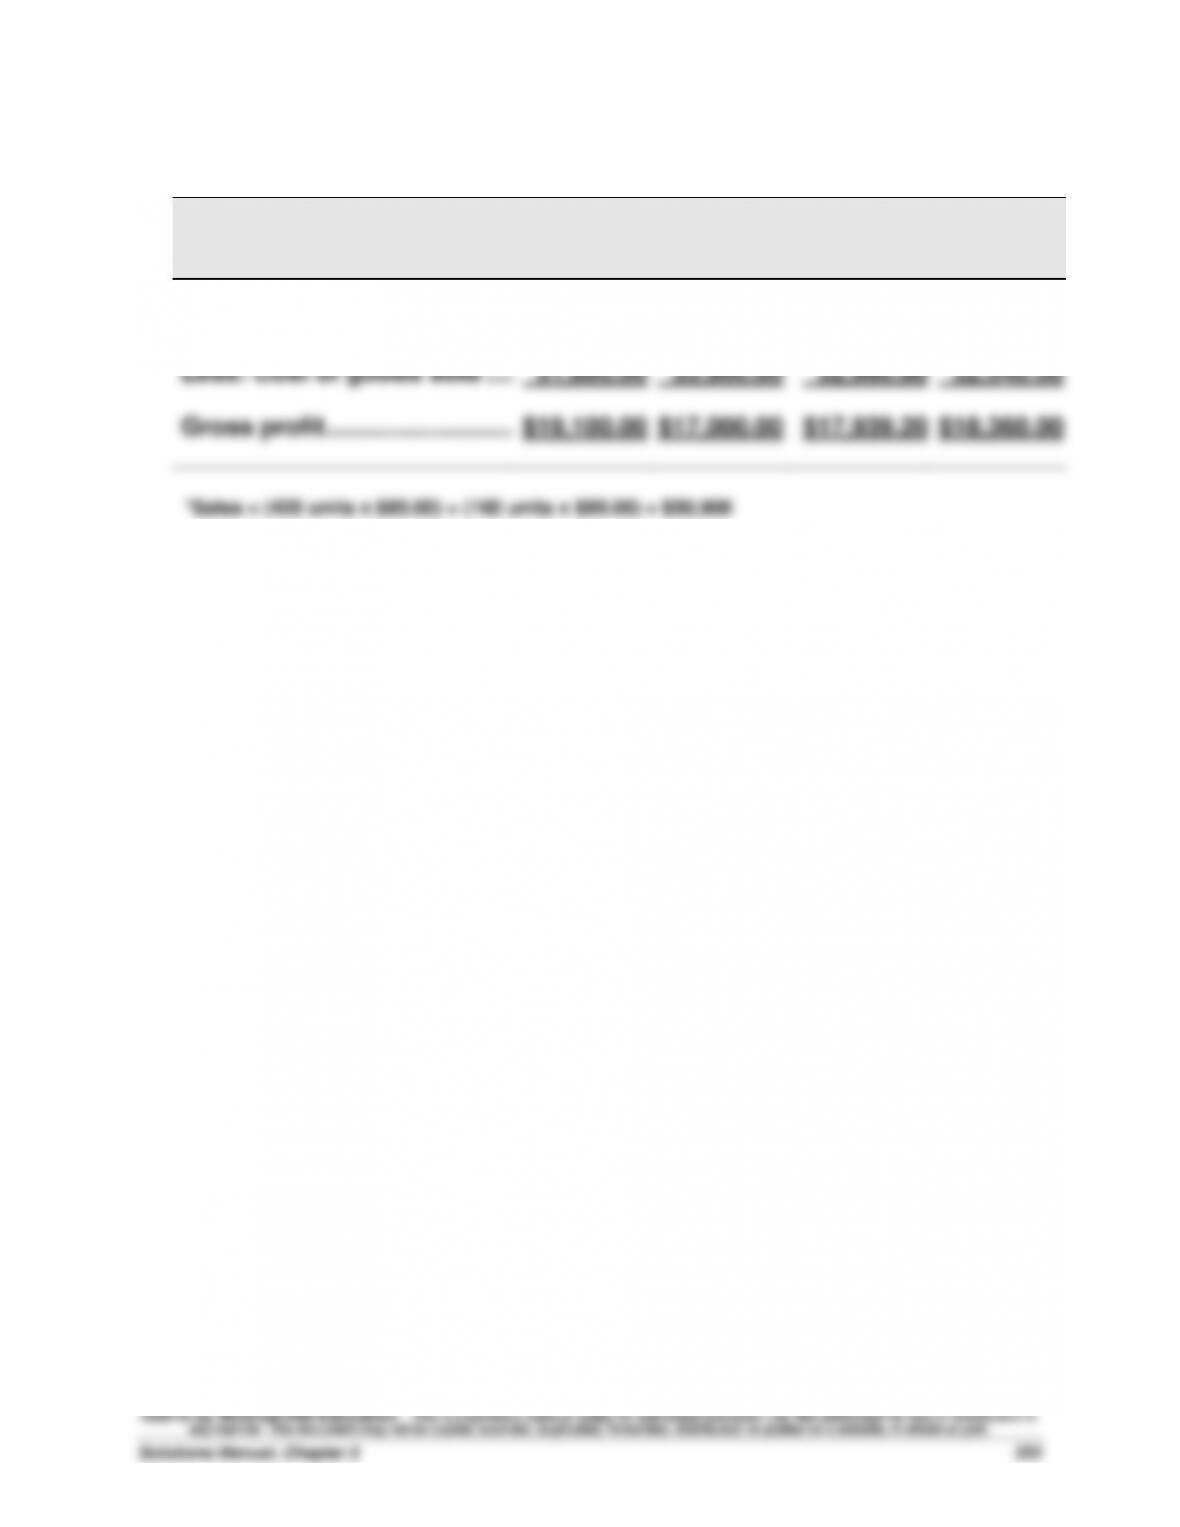
Problem 5-2A (Concluded)
4.
FIFO
LIFO
Weighted
Average
Specific
Identifi-
cation
Sales* ………………………………..
$50,900.00
$50,900.00
$50,900.00
$50,900.00
Less: Cost of goods sold …...
31,800.00
33,900.00
32,960.80
32,540.00
Gross profit ………………………..
$19,100.00
$17,000.00
$17,939.20
$18,360.00
*Sales = (420 units x $85.00) + (160 units x $95.00) = $50,900
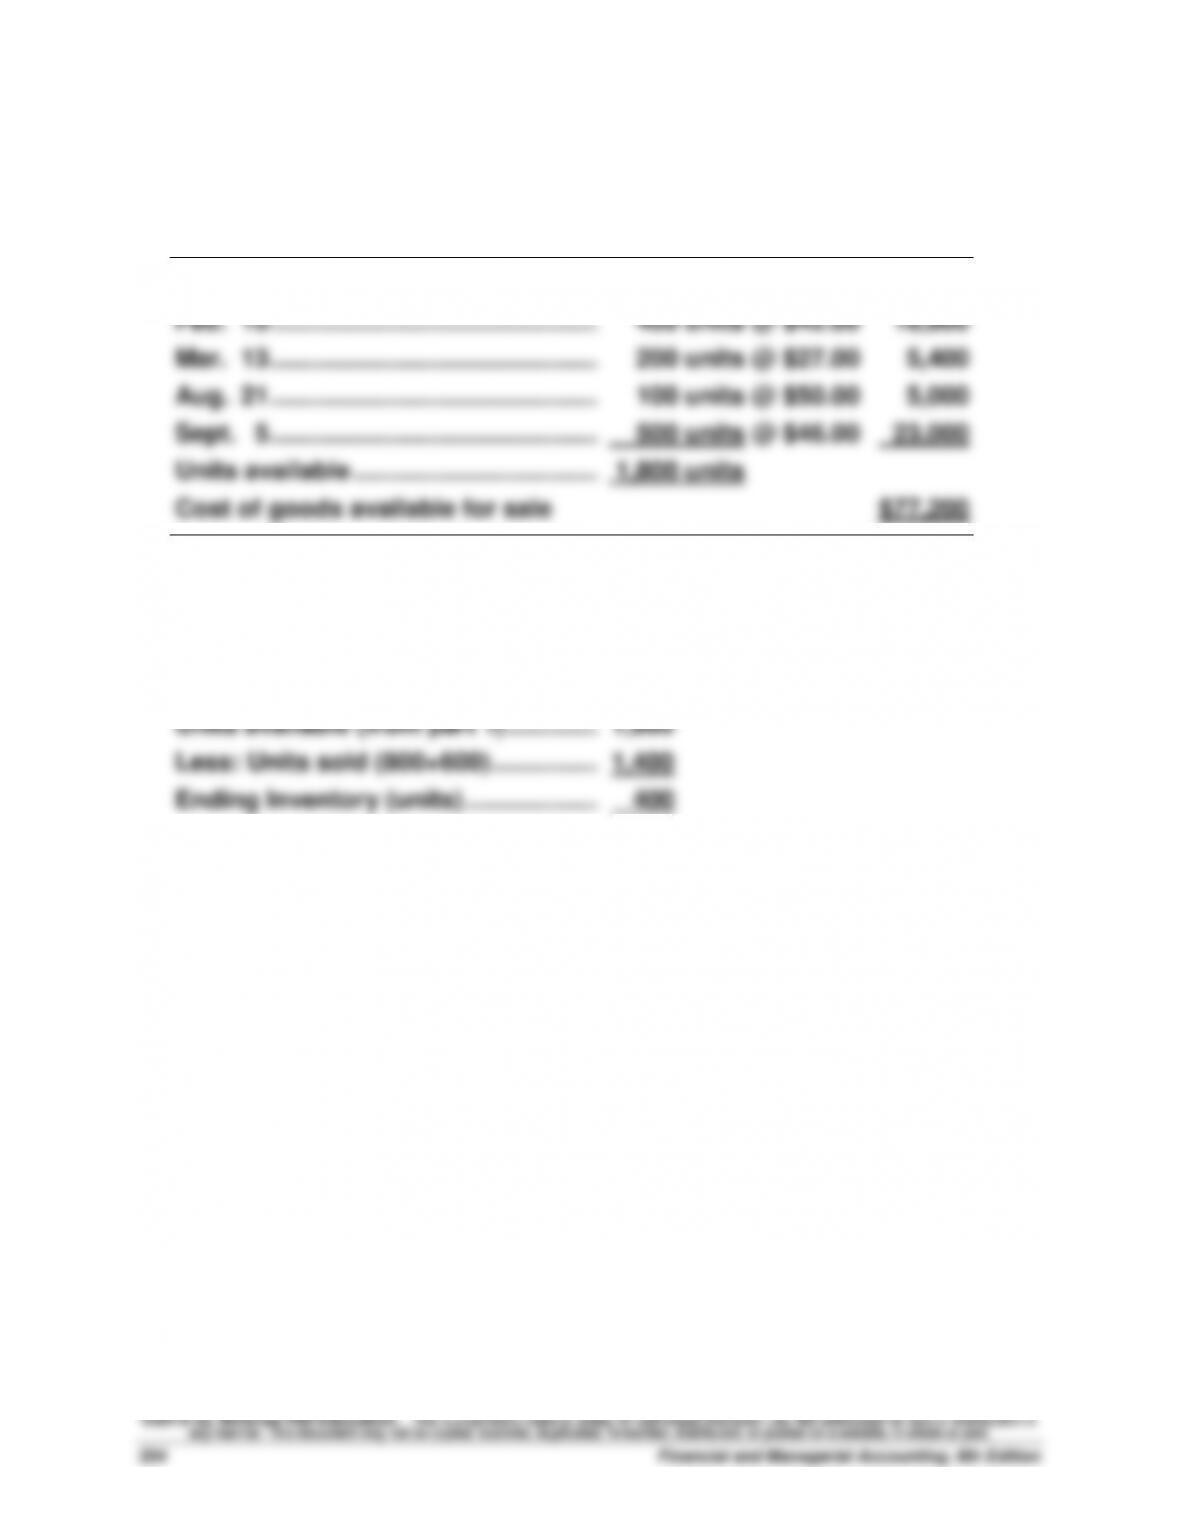
Problem 5-3A (40 minutes)
1. Calculate cost of goods available for sale and units available for sale
Beginning inventory ……………………...
600 units @ $45.00
$27,000
Feb. 10 …………………………..……………..
400 units @ $42.00
16,800
Mar. 13 ………………………………………….
200 units @ $27.00
5,400
Aug. 21 ………………………………………….
100 units @ $50.00
5,000
Sept. 5 ………………………………………….
500 units @ $46.00
23,000
Units available ……………………………….
1,800 units
Cost of goods available for sale
$77,200
2. Units in ending inventory
Units available (from part 1) …………..…………..
1,800
Less: Units sold (800+600) …………….…………..
1,400
Ending Inventory (units) ………………..…………
400
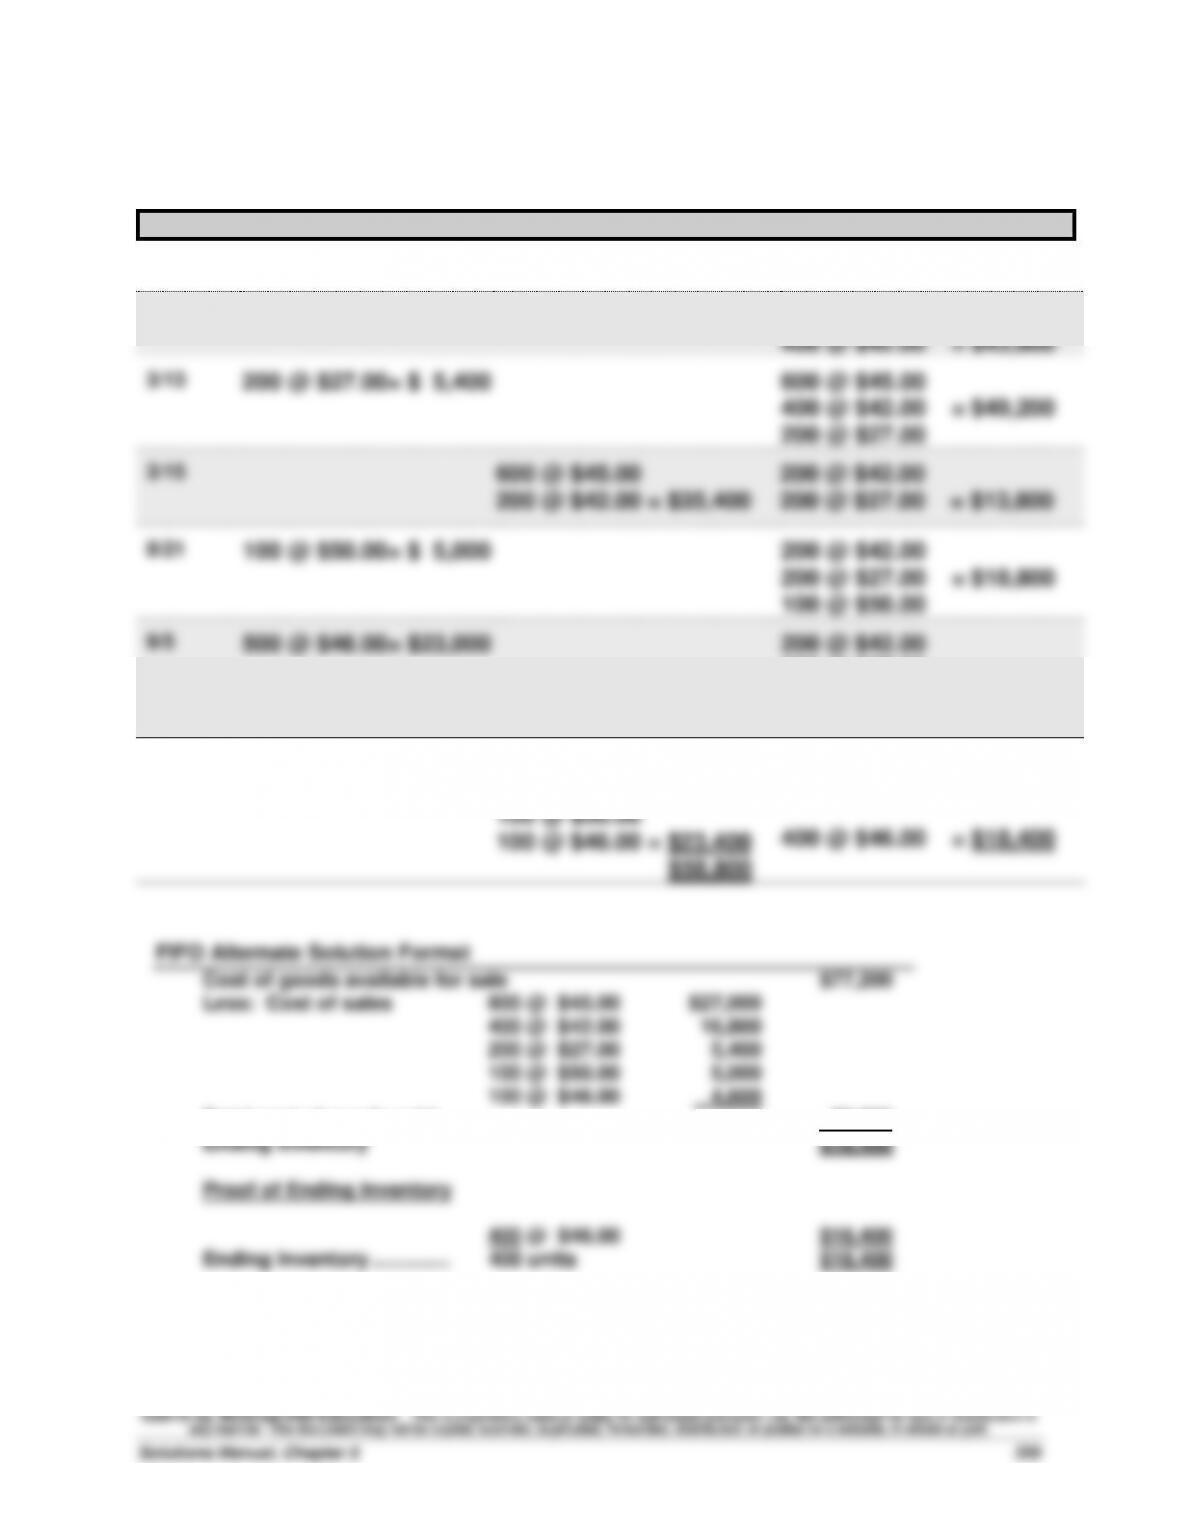
Problem 5-3A (Continued)
3a. FIFO perpetual
Date
Goods Purchasd
Cost of Goods Sold
Inventory Balance
1/1
600 @ $45.00 = $27,000
2/10
400 @ $42.00= $16,800
600 @ $45.00
400 @ $42.00 = $43,800
3/13
200 @ $27.00= $ 5,400
600 @ $45.00
400 @ $42.00 = $49,200
200 @ $27.00
3/15
600 @ $45.00
200 @ $42.00 = $35,400
200 @ $42.00
200 @ $27.00 = $13,800
8/21
100 @ $50.00= $ 5,000
200 @ $42.00
200 @ $27.00 = $18,800
100 @ $50.00
9/5
500 @ $46.00= $23,000
200 @ $42.00
200 @ $27.00
100 @ $50.00
500 @ $46.00 = $41,800
9/10
200 @ $42.00
200 @ $27.00
100 @ $50.00
100 @ $46.00 = $23,400
400 @ $46.00 = $18,400
$58,800
FIFO Alternate Solution Format
Cost of goods available for sale
$77,200
Less: Cost of sales
600 @ $45.00
$27,000
400 @ $42.00
16,800
200 @ $27.00
5,400
100 @ $50.00
5,000
100 @ $46.00
4,600
Total cost of goods sold
58,800
Ending Inventory
$18,400
Proof of Ending Inventory
400 @ $46.00
$18,400
Ending Inventory ……………..
400 units
$18,400
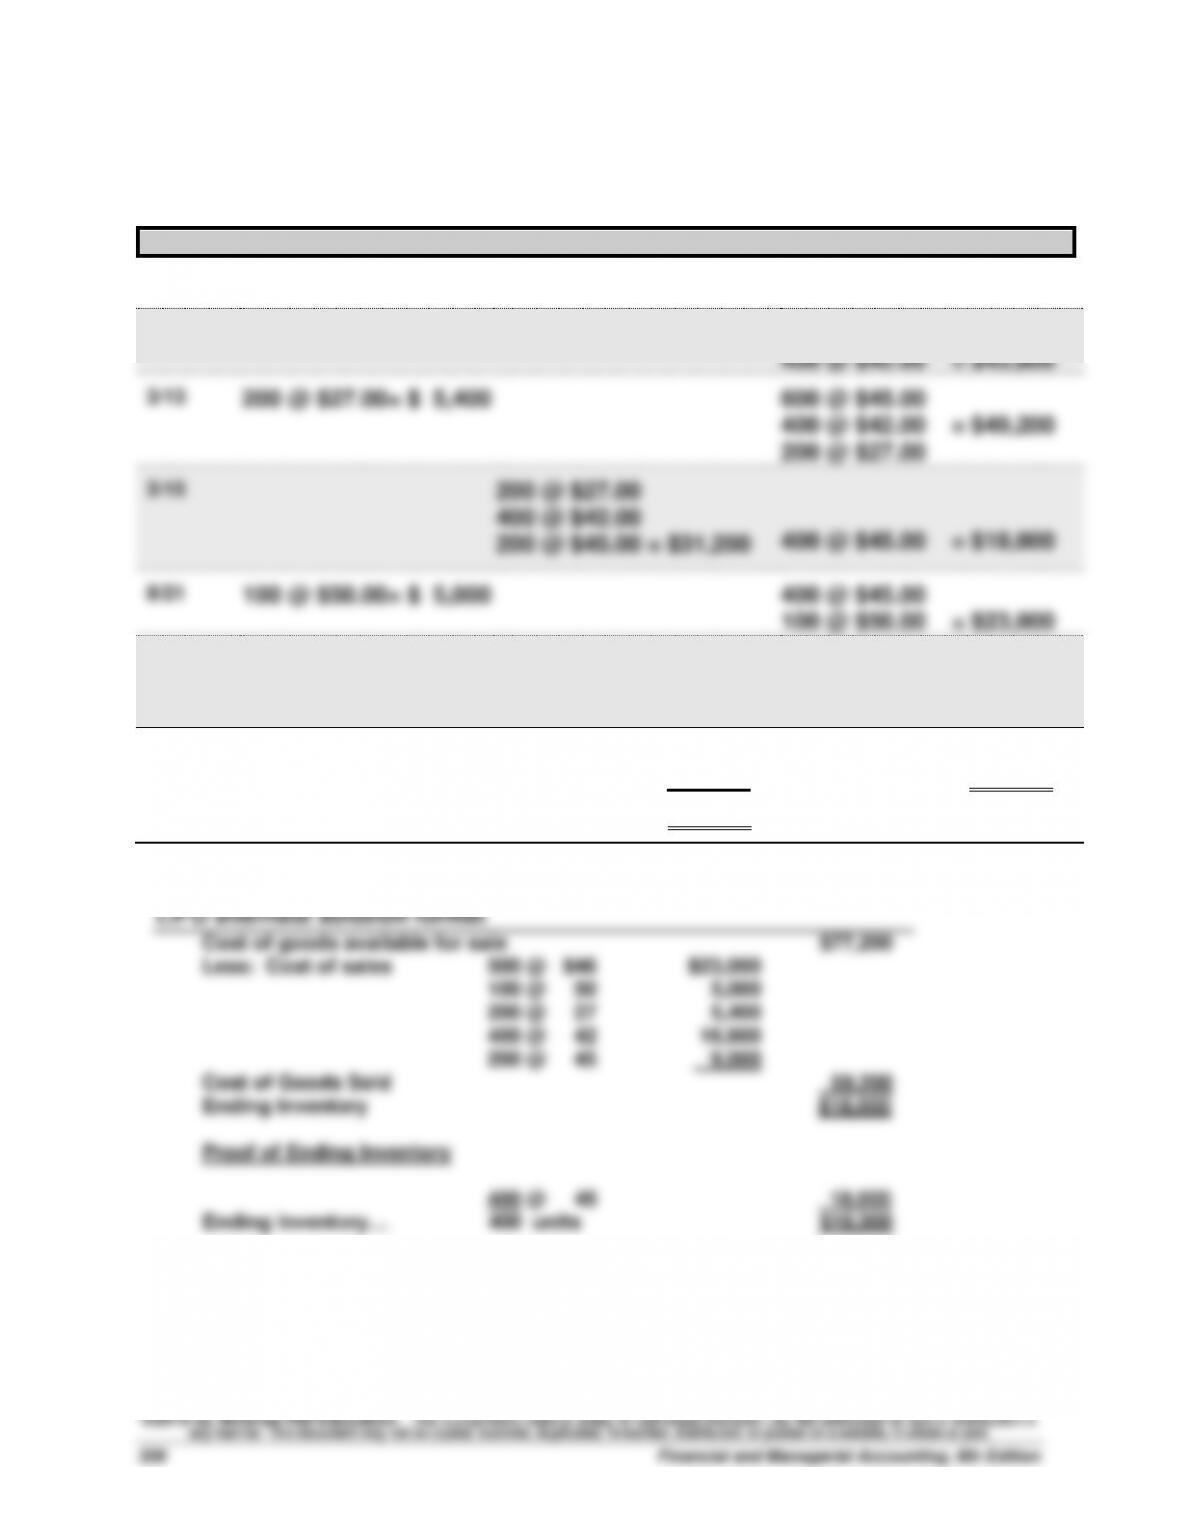
Problem 5-3A (Continued)
3b. LIFO perpetual
Date
Goods Purchased
Cost of Goods Sold
Inventory Balance
1/1
600 @ $45.00 = $27,000
2/10
400 @ $42.00= $16,800
600 @ $45.00
400 @ $42.00 = $43,800
3/13
200 @ $27.00= $ 5,400
600 @ $45.00
400 @ $42.00 = $49,200
200 @ $27.00
3/15
200 @ $27.00
400 @ $42.00
200 @ $45.00 = $31,200
400 @ $45.00 = $18,000
8/21
100 @ $50.00= $ 5,000
400 @ $45.00
100 @ $50.00 = $23,000
9/5
500 @ $46.00= $23,000
400 @ $45.00
100 @ $50.00
500 @ $46.00 = $46,000
9/10
500 @ $46.00
100 @ $50.00 = $28,000
400 @ $45.00 = $18,000
$59,200