PROBLEM SET B
Problem 24-1B (50 minutes)
Part 1
Annual straight-line depreciation = = $70,000
Part 2
Net
Net Cash
Income
Flow
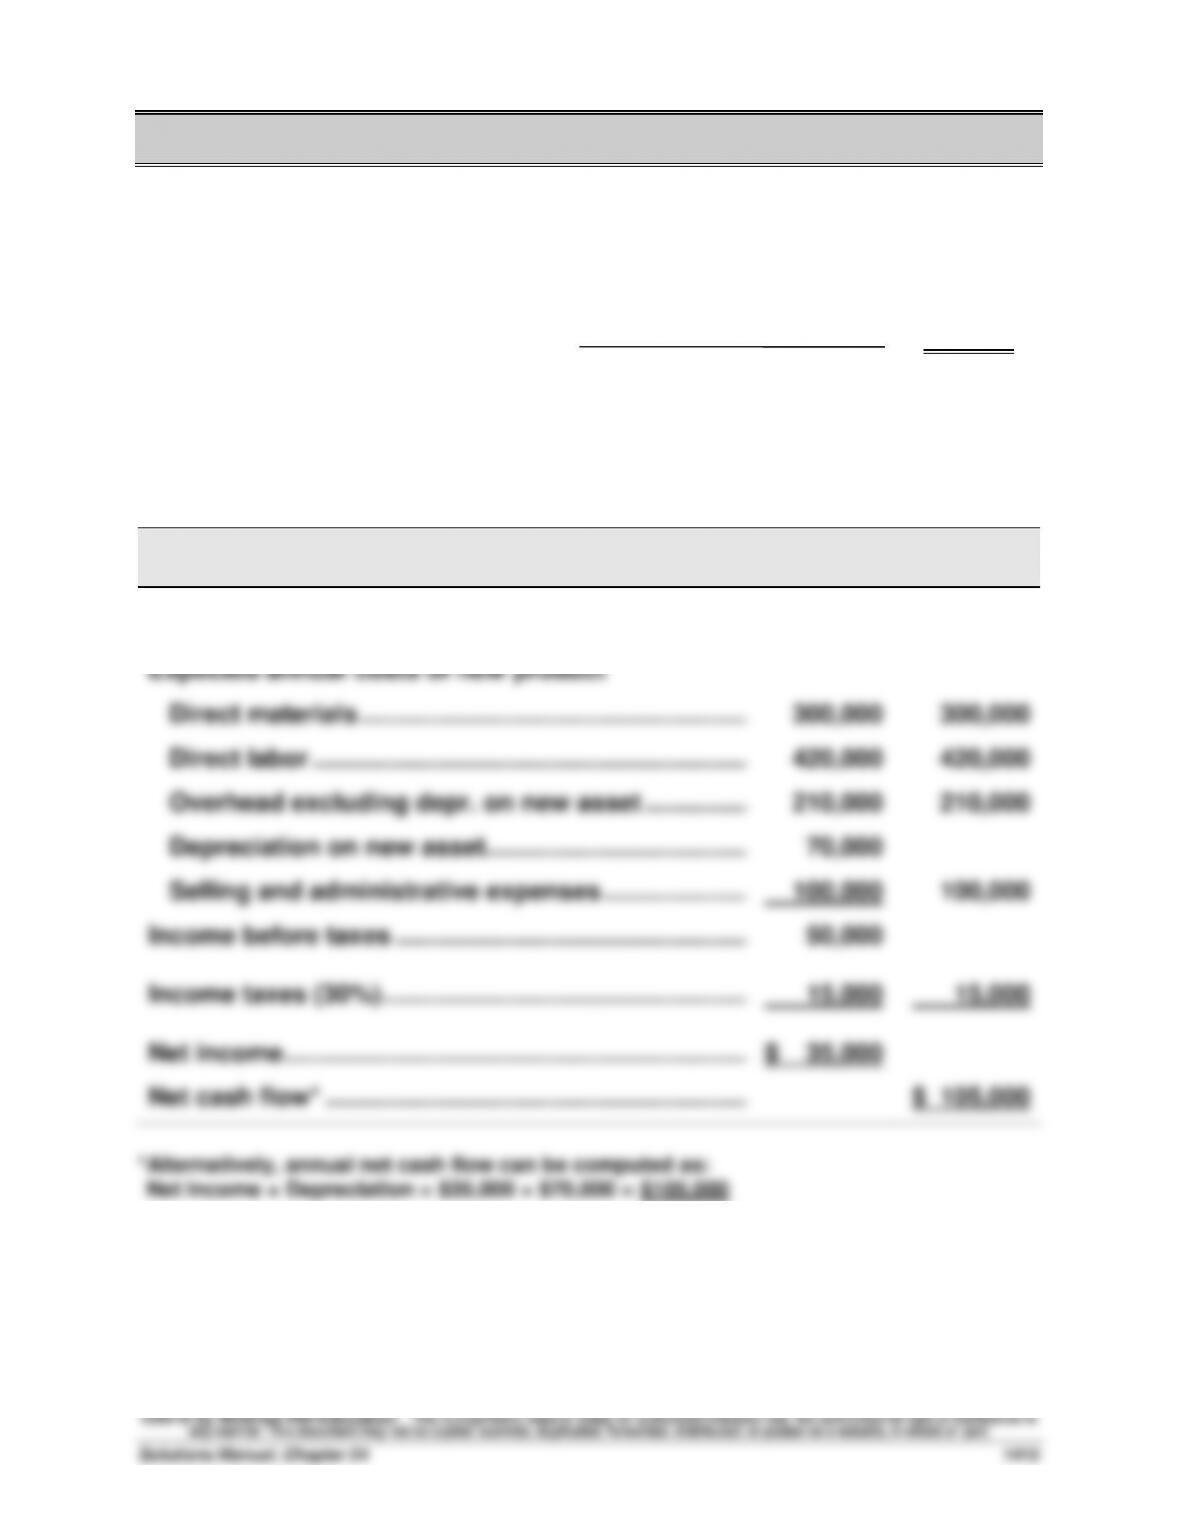
Expected annual sales of new product ………………..…
$1,150,000
$1,150,000
Expected annual costs of new product
Direct materials ………………………………………………..…
300,000
300,000
Direct labor …………………………..…………………………..
420,000
420,000
Overhead excluding depr. on new asset ………………
210,000
210,000
Depreciation on new asset………………………………..…
70,000
Selling and administrative expenses ……………………
100,000
100,000
Income before taxes ………………………………………………
50,000
Income taxes (30%)……………………………………………..…
15,000
15,000
Net income ………………………………………………………….…
$ 35,000
Net cash flow* …………………………………………………….…
$ 105,000
*Alternatively, annual net cash flow can be computed as:
Net income + Depreciation = $35,000 + $70,000 = $105,000
$300,000 – $20,000
4 years
Problem 24–1B (Continued)
Part 3
Payback Period = = 2.86 years
Part 4
Accounting rate of return = = 21.88%
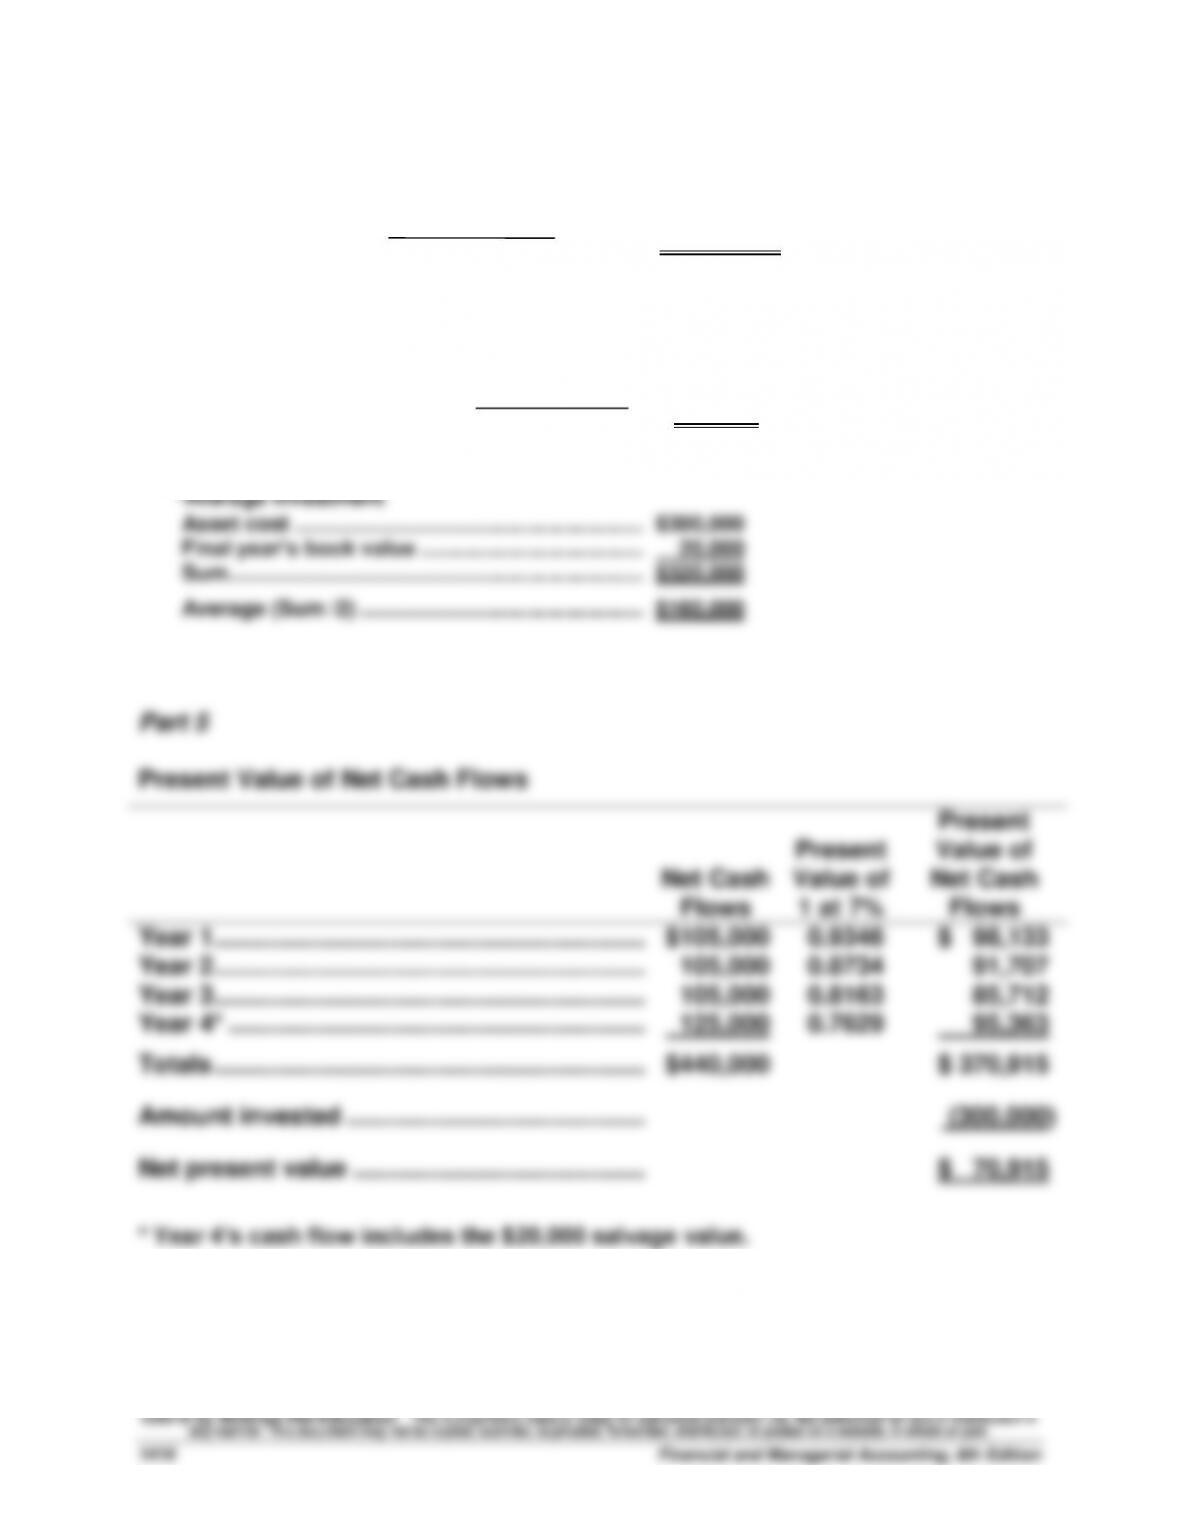
*Average investment
Asset cost …………………………..……………………....
$300,000
Final year’s book value ………………………………...
20,000
Sum ……………………………………………………………..
$320,000
Average (Sum /2) ………………………………………....
$160,000
Part 5
Present Value of Net Cash Flows
Present
Present
Value of
Net Cash
Flows
Value of
1 at 7%
Net Cash
Flows
Year 1 ……………………………………………………..
$105,000
0.9346
$ 98,133
Year 2 ……………………………………………………..
105,000
0.8734
91,707
Year 3 ……………………………………………………..
105,000
0.8163
85,712
Year 4* ……………………………………………………
125,000
0.7629
95,363
Totals ……………………………………………………..
$440,000
$ 370,915
Amount invested …………………………………….
(300,000)
Net present value ……………………………………
$ 70,915
* Year 4’s cash flow includes the $20,000 salvage value.
$35,000
$160,000*
$300,000
$105,000
Problem 24-2B (55 minutes)
Part 1
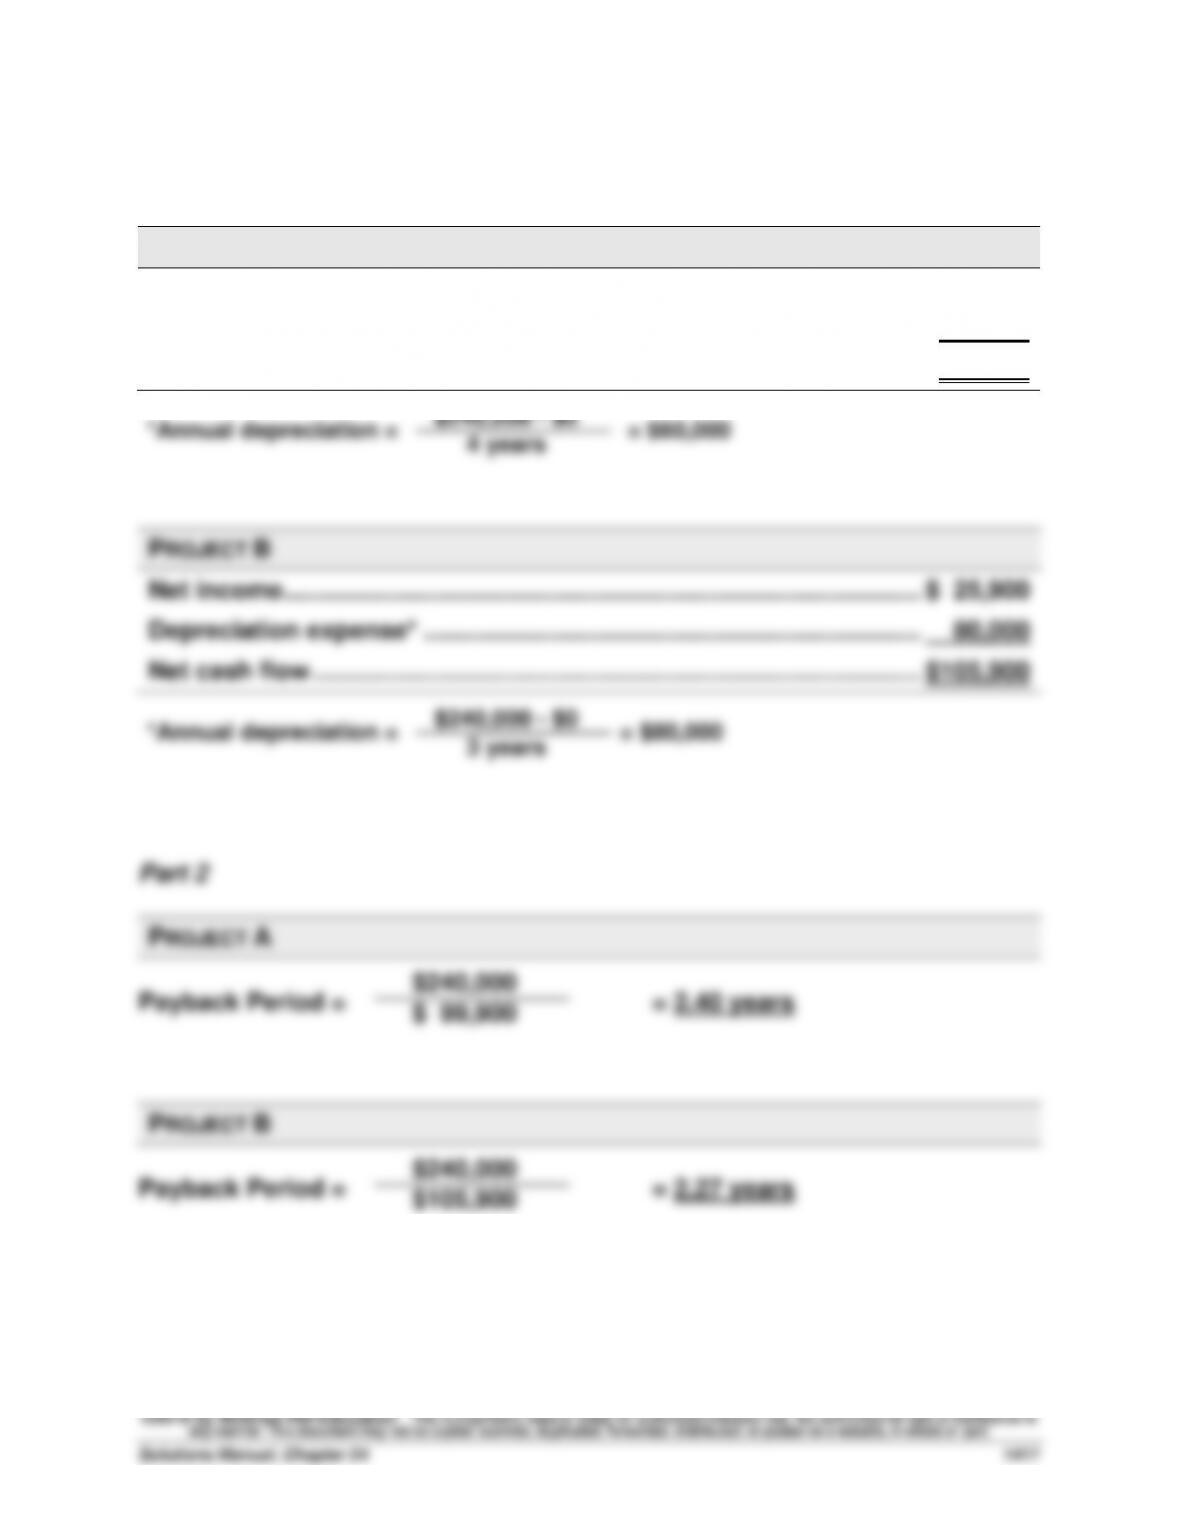
PROJECT A
Net income ………………………………………………………………………………..…
$39,900
Depreciation expense* …………………………………………………………………
60,000
Net cash flow …………………………………………………………………………….…
$99,900
$240,000 – $0
Problem 24–2B (Continued)
Part 3
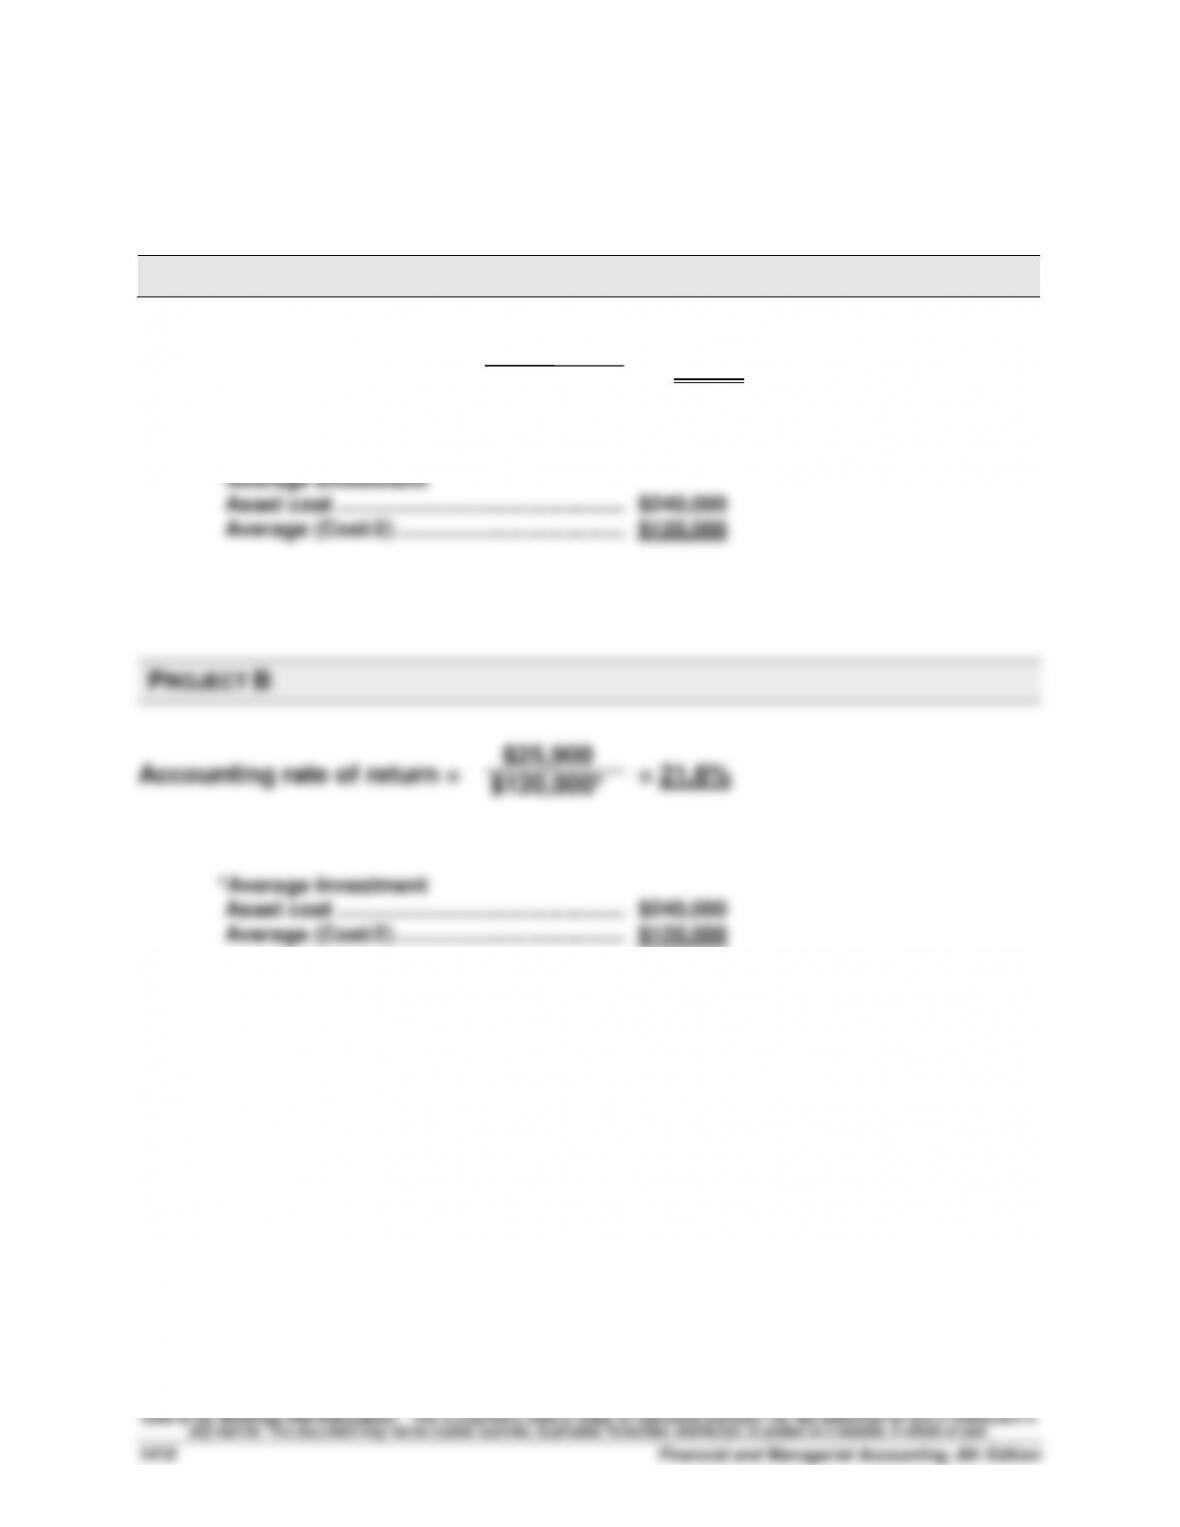
PROJECT A
Accounting rate of return = = 33.3%
*Average investment
Asset cost ………………………………………….
$240,000
Average (Cost/2) ………………………………...
$120,000
PROJECT B
Accounting rate of return = = 21.6%
*Average investment
Asset cost ………………………………………….
$240,000
Average (Cost/2) ………………………………...
$120,000
$39,900
$120,000*
$25,900
$120,000*
Problem 24–2B (Continued)
Part 4
PROJECT A
Present Value of Net Cash Flows
Present
Present
Value of
Value of
Net Cash
Flows
1 at 8%
Annuity
Net Cash
Flows
Years 1-4 …………………………..…………………..
$99,900
3.3121
$330,879
Amount invested ……………………………………
(240,000)
Net present value …………………………..………
$ 90,879
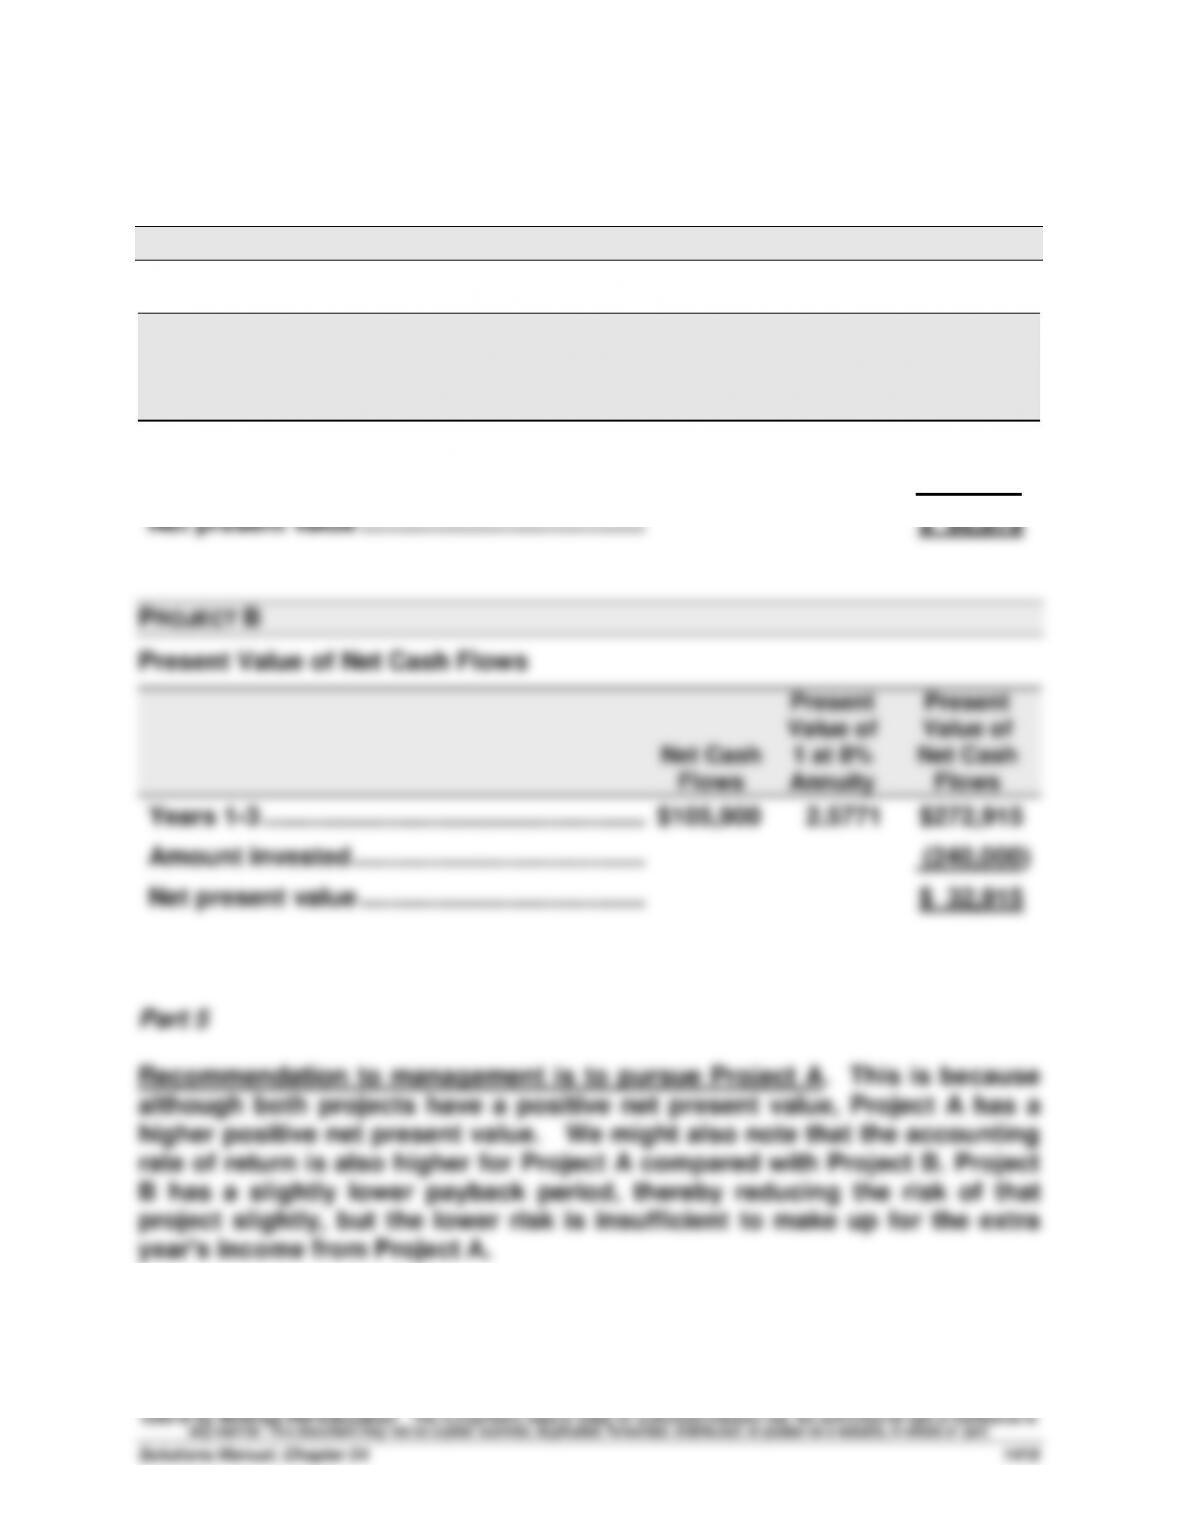
PROJECT B
Present Value of Net Cash Flows
Present
Present
Value of
Value of
Net Cash
Flows
1 at 8%
Annuity
Net Cash
Flows
Years 1-3 …………………………..…………………..
$105,900
2.5771
$272,915
Amount invested ……………………………………
(240,000)
Net present value …………………………..………
$ 32,915
Part 5
Recommendation to management is to pursue Project A. This is because
although both projects have a positive net present value, Project A has a
higher positive net present value. We might also note that the accounting
rate of return is also higher for Project A compared with Project B. Project
B has a slightly lower payback period, thereby reducing the risk of that
project slightly, but the lower risk is insufficient to make up for the extra
year’s income from Project A.
Problem 24-3B (60 minutes)
Part 1
RESULTS USING STRAIGHT-LINE DEPRECIATION
(a)
Income
Before
Deprec.
(b)
Straight–
Line
Deprec.
(c)
Taxable
Income
(a) – (b)
(d)
40%
Income
Taxes
(e)
Net Cash
Flows
(a) – (d)
Year 1 ……….………………
$12,000
$3,000
$ 9,000
$3,600
$8,400
Year 2 ……….………………
12,000
6,000
6,000
2,400
9,600
Year 3 ……….………………
12,000
6,000
6,000
2,400
9,600
Year 4 ……….………………
12,000
6,000
6,000
2,400
9,600
Year 5 ……….………………
12,000
6,000
6,000
2,400
9,600
Year 6 ……….………………
12,000
3,000
9,000
3,600
8,400
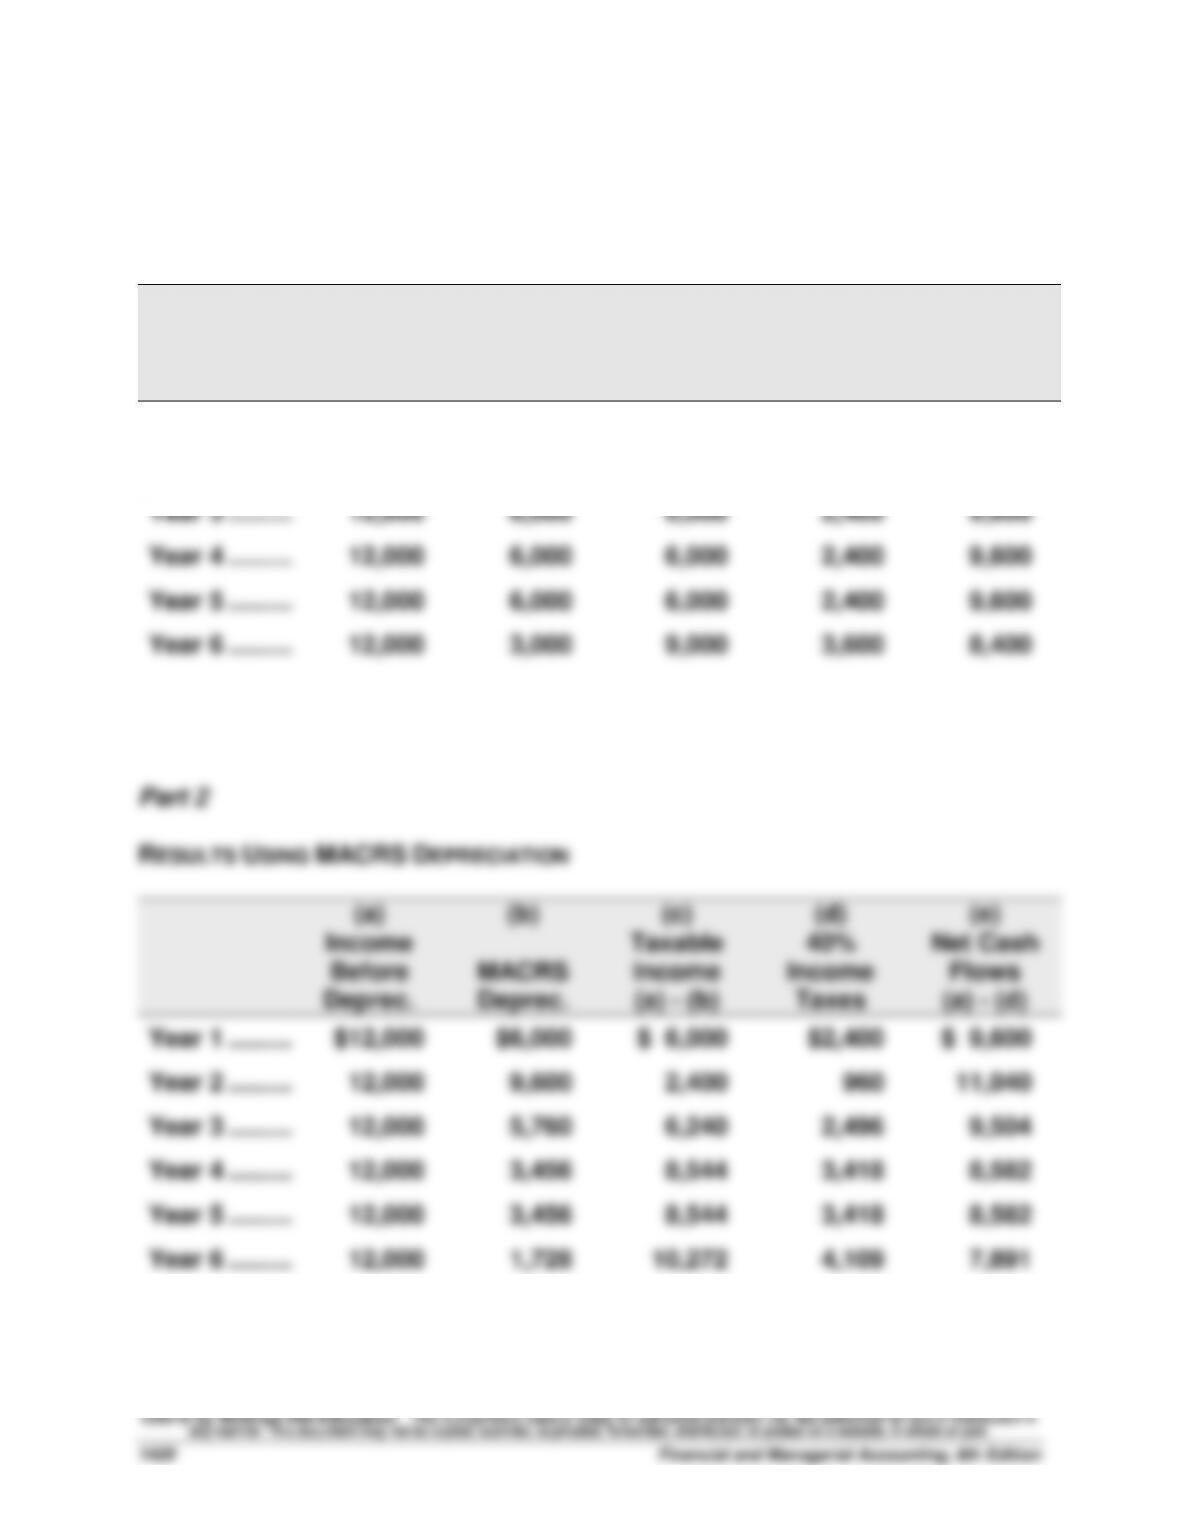
Part 2
RESULTS USING MACRS DEPRECIATION
(a)
Income
Before
Deprec.
(b)
MACRS
Deprec.
(c)
Taxable
Income
(a) – (b)
(d)
40%
Income
Taxes
(e)
Net Cash
Flows
(a) – (d)
Year 1 ……….………………
$12,000
$6,000
$ 6,000
$2,400
$ 9,600
Year 2 ……….………………
12,000
9,600
2,400
960
11,040
Year 3 ……….………………
12,000
5,760
6,240
2,496
9,504
Year 4 ……….………………
12,000
3,456
8,544
3,418
8,582
Year 5 ……….………………
12,000
3,456
8,544
3,418
8,582
Year 6 ……….………………
12,000
1,728
10,272
4,109
7,891
Problem 24–3B (Continued)
Part 3
NET PRESENT VALUE OF ASSET USING STRAIGHT-LINE DEPRECIATION
Present
Present
Net Cash
Value of
Value of Net
Flows
1 at 10%
Cash Flows
Year 1 …………………………………………………..
$ 8,400
0.9091
$ 7,636
Year 2 …………………………………………………..
9,600
0.8264
7,933
Year 3 …………………………………………………..
9,600
0.7513
7,212
Year 4 …………………………………………………..
9,600
0.6830
6,557
Year 5 …………………………………………………..
9,600
0.6209
5,961
Year 6 …………………………………………………..
8,400
0.5645
4,742
Totals …………………………………………………..
$55,200
$40,041
Amount invested …………………………………..
(30,000)
Net present value …………………………..……..
$10,041
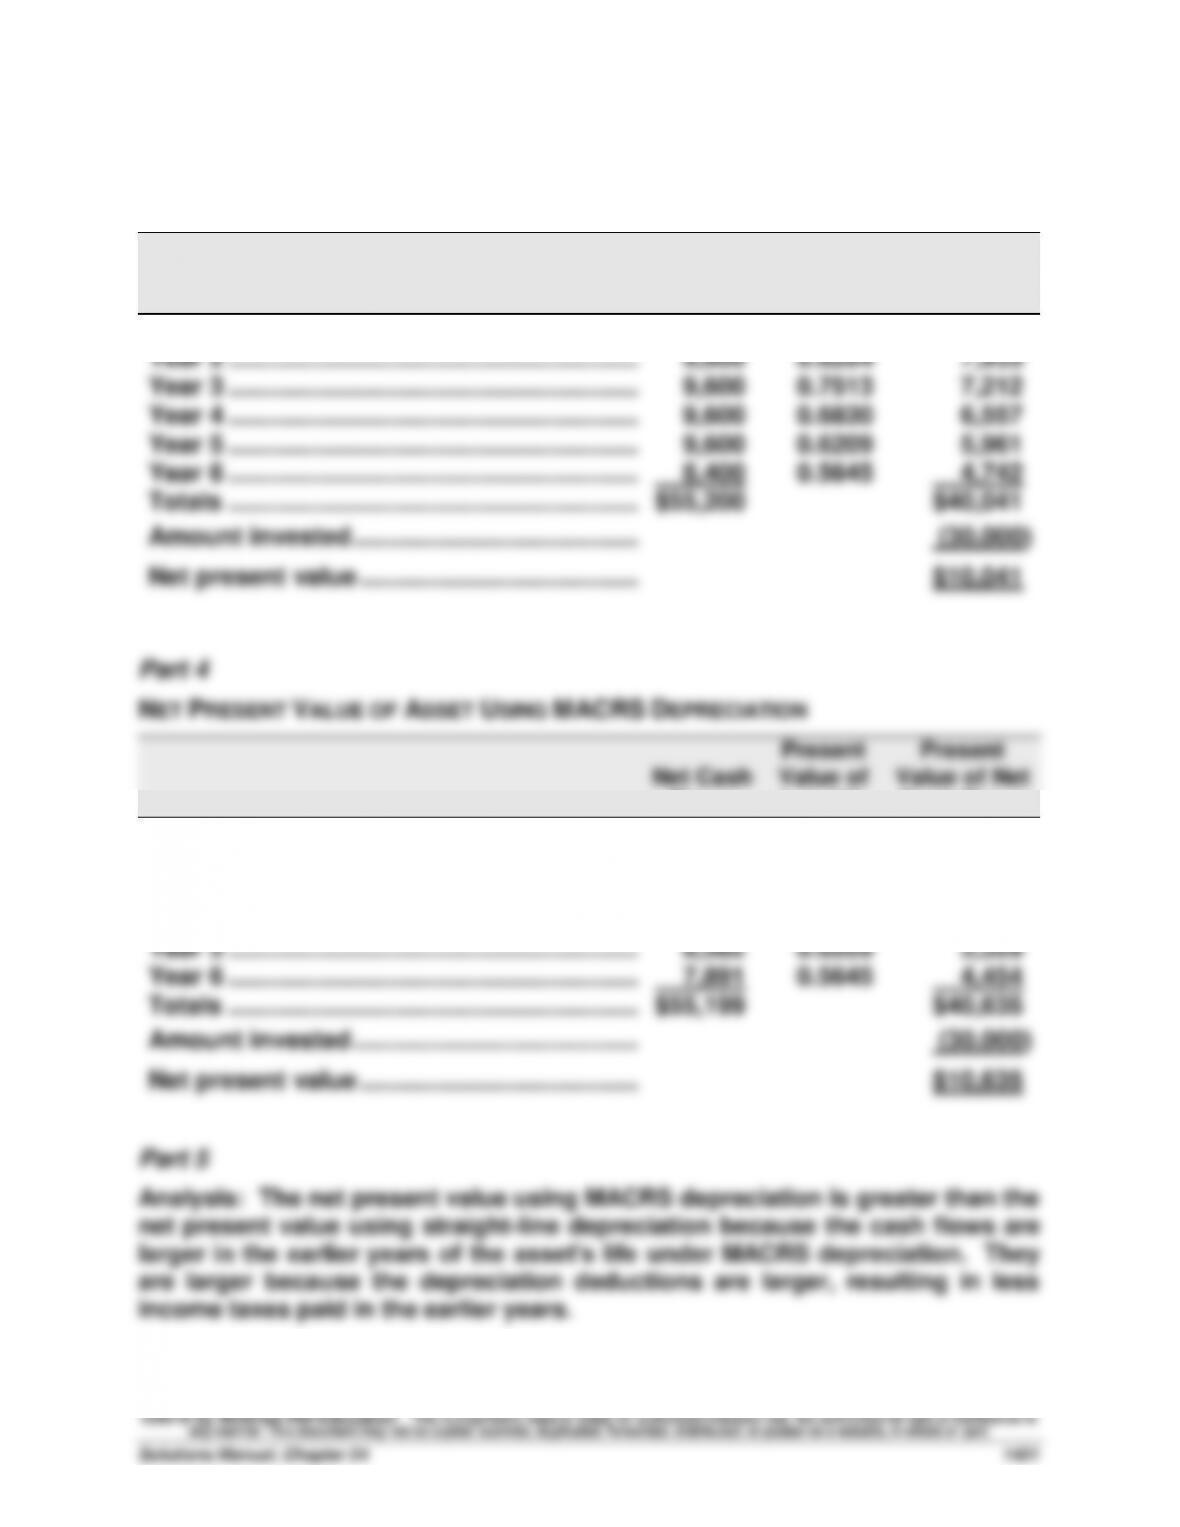
Part 4
NET PRESENT VALUE OF ASSET USING MACRS DEPRECIATION
Present
Present
Net Cash
Value of
Value of Net
Flows
1 at 10%
Cash Flows
Year 1 …………………………………………………..
$ 9,600
0.9091
$ 8,727
Year 2 …………………………………………………..
11,040
0.8264
9,123
Year 3 …………………………………………………..
9,504
0.7513
7,140
Year 4 …………………………………………………..
8,582
0.6830
5,862
Year 5 …………………………………………………..
8,582
0.6209
5,329
Year 6 …………………………………………………..
7,891
0.5645
4,454
Totals …………………………………………………..
$55,199
$40,635
Amount invested …………………………………..
(30,000)
Net present value …………………………..……..
$10,635
Part 5
Analysis: The net present value using MACRS depreciation is greater than the
net present value using straight-line depreciation because the cash flows are
larger in the earlier years of the asset’s life under MACRS depreciation. They
are larger because the depreciation deductions are larger, resulting in less
income taxes paid in the earlier years.
Problem 24-4B (45 minutes)
Part 1
Alternative 1: Keep the old freezer and have it repaired
Item
Period
Cash Flow
Present
Value Factor
at 10%
Present
Value of
Cash Flows
Revenues ………………………….
1 – 8
$63,000
5.3349
$ 336,099
Operating costs …………………
1 – 8
(55,000)
5.3349
(293,420)
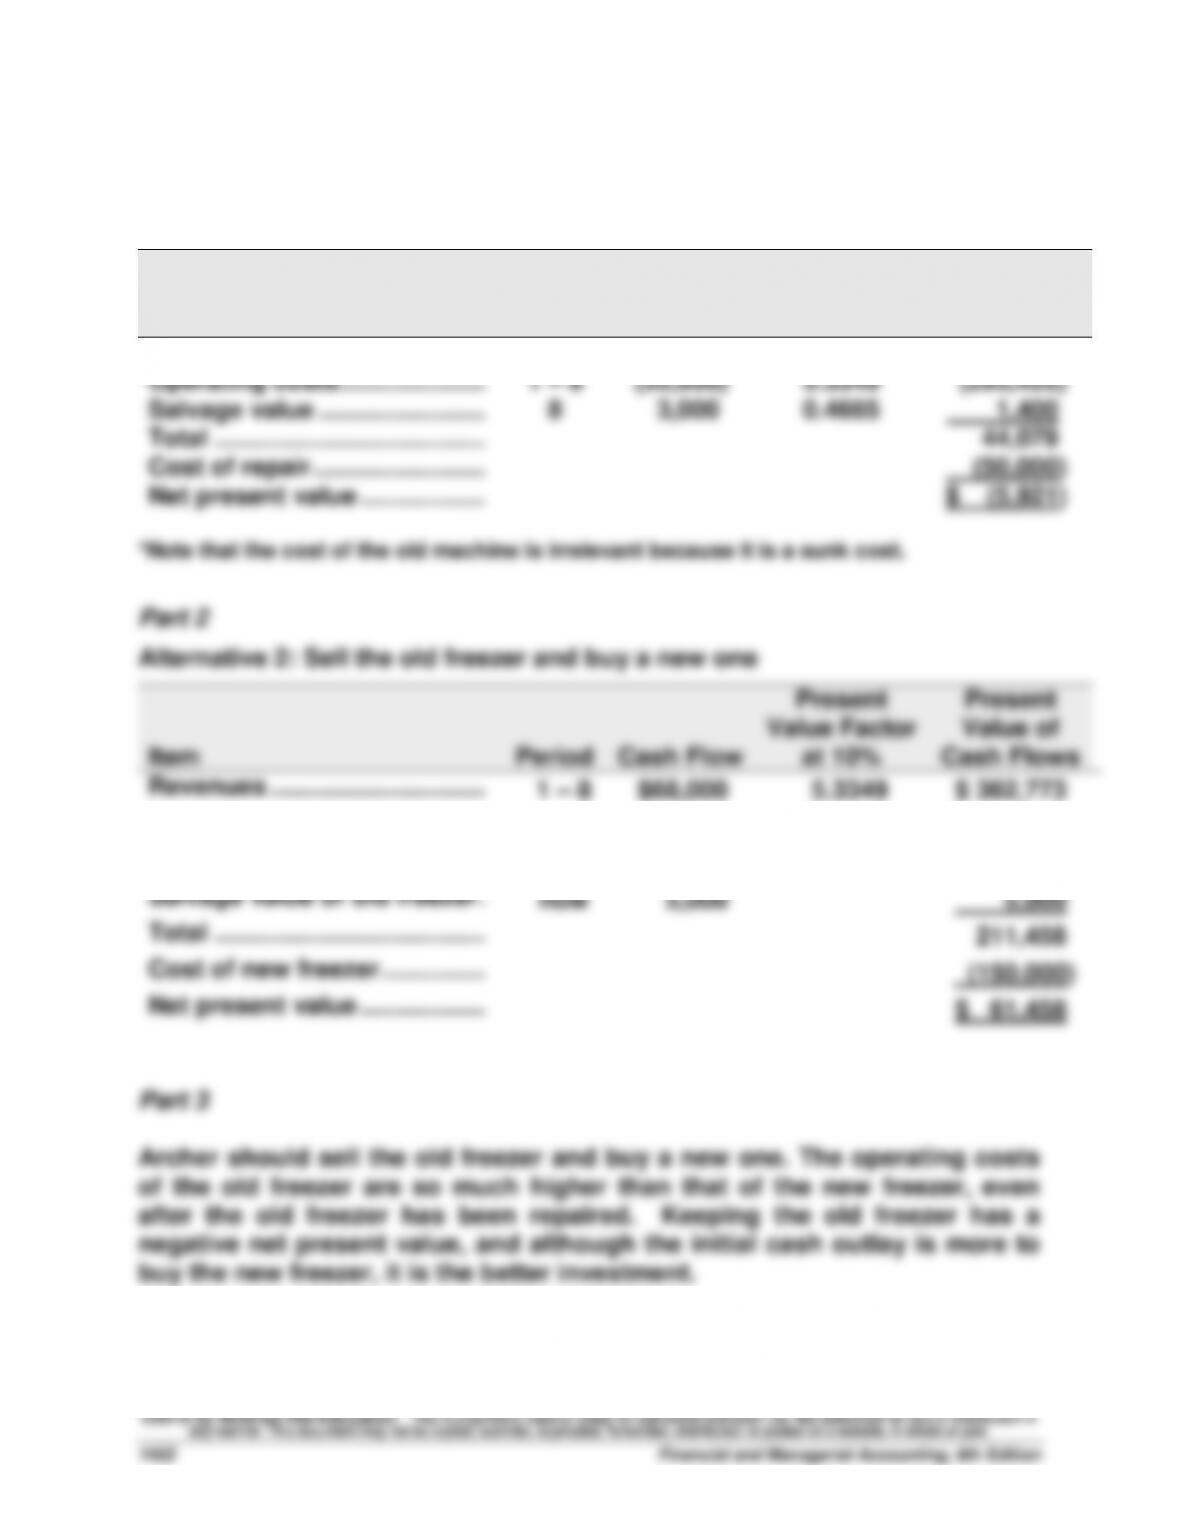
Salvage value ……………………
8
3,000
0.4665
1,400
Total …………………………………
44,079
Cost of repair …………………….
(50,000)
Net present value ………………
$ (5,921)
*Note that the cost of the old machine is irrelevant because it is a sunk cost.
Part 2
Alternative 2: Sell the old freezer and buy a new one
Item
Period
Cash Flow
Present
Value Factor
at 10%
Present
Value of
Cash Flows
Revenues ………………………….
1 – 8
$68,000
5.3349
$ 362,773
Operating costs …………………
1 – 8
(30,000)
5.3349
(160,047)
Salvage value of new freezer
8
8,000
0.4665
3,732
Salvage value of old freezer.
now
5,000
5,000
Total …………………………………
211,458
Cost of new freezer ……………
(150,000)
Net present value ………………
$ 61,458
Part 3
Archer should sell the old freezer and buy a new one. The operating costs
of the old freezer are so much higher than that of the new freezer, even
after the old freezer has been repaired. Keeping the old freezer has a
negative net present value, and although the initial cash outlay is more to
buy the new freezer, it is the better investment.
Problem 24-5B (40 minutes)
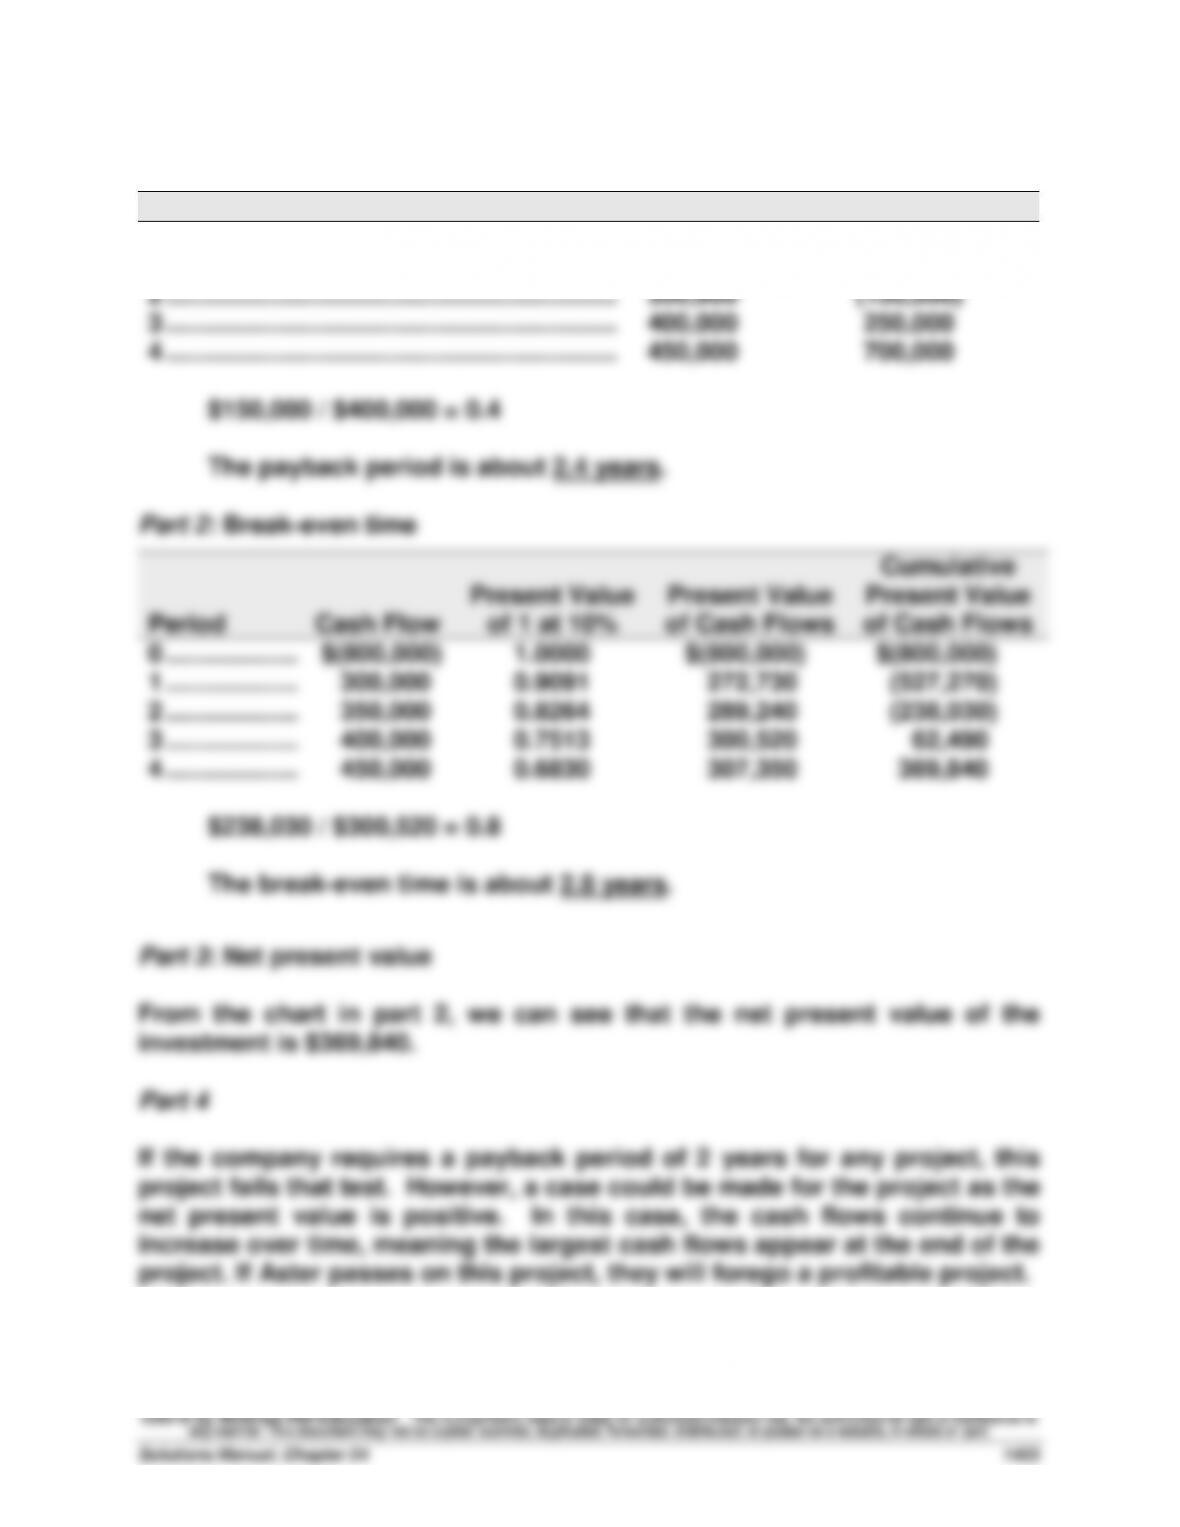
Part 1: Payback period
Period
Cash flow
Cumulative cash flow
0 …………………………..………………………………………
$(800,000)
$(800,000)
1 …………………………..………………………………………
300,000
(500,000)
2 …………………………..………………………………………
350,000
(150,000)
3 …………………………..………………………………………
400,000
250,000
4 …………………………..………………………………………
450,000
700,000
$150,000 / $400,000 = 0.4
The payback period is about 2.4 years.
Part 2: Break-even time
Period
Cash Flow
Present Value
of 1 at 10%
Present Value
of Cash Flows
Cumulative
Present Value
of Cash Flows
0 ……………….
$(800,000)
1.0000
$(800,000)
$(800,000)
1 ……………….
300,000
0.9091
272,730
(527,270)
2 ……………….
350,000
0.8264
289,240
(238,030)
3 ……………….
400,000
0.7513
300,520
62,490
4 ……………….
450,000
0.6830
307,350
369,840
$238,030 / $300,520 = 0.8
The break-even time is about 2.8 years.
Part 3: Net present value
From the chart in part 2, we can see that the net present value of the
investment is $369,840.
Part 4
If the company requires a payback period of 2 years for any project, this
project fails that test. However, a case could be made for the project as the
net present value is positive. In this case, the cash flows continue to
increase over time, meaning the largest cash flows appear at the end of the
project. If Aster passes on this project, they will forego a profitable project.
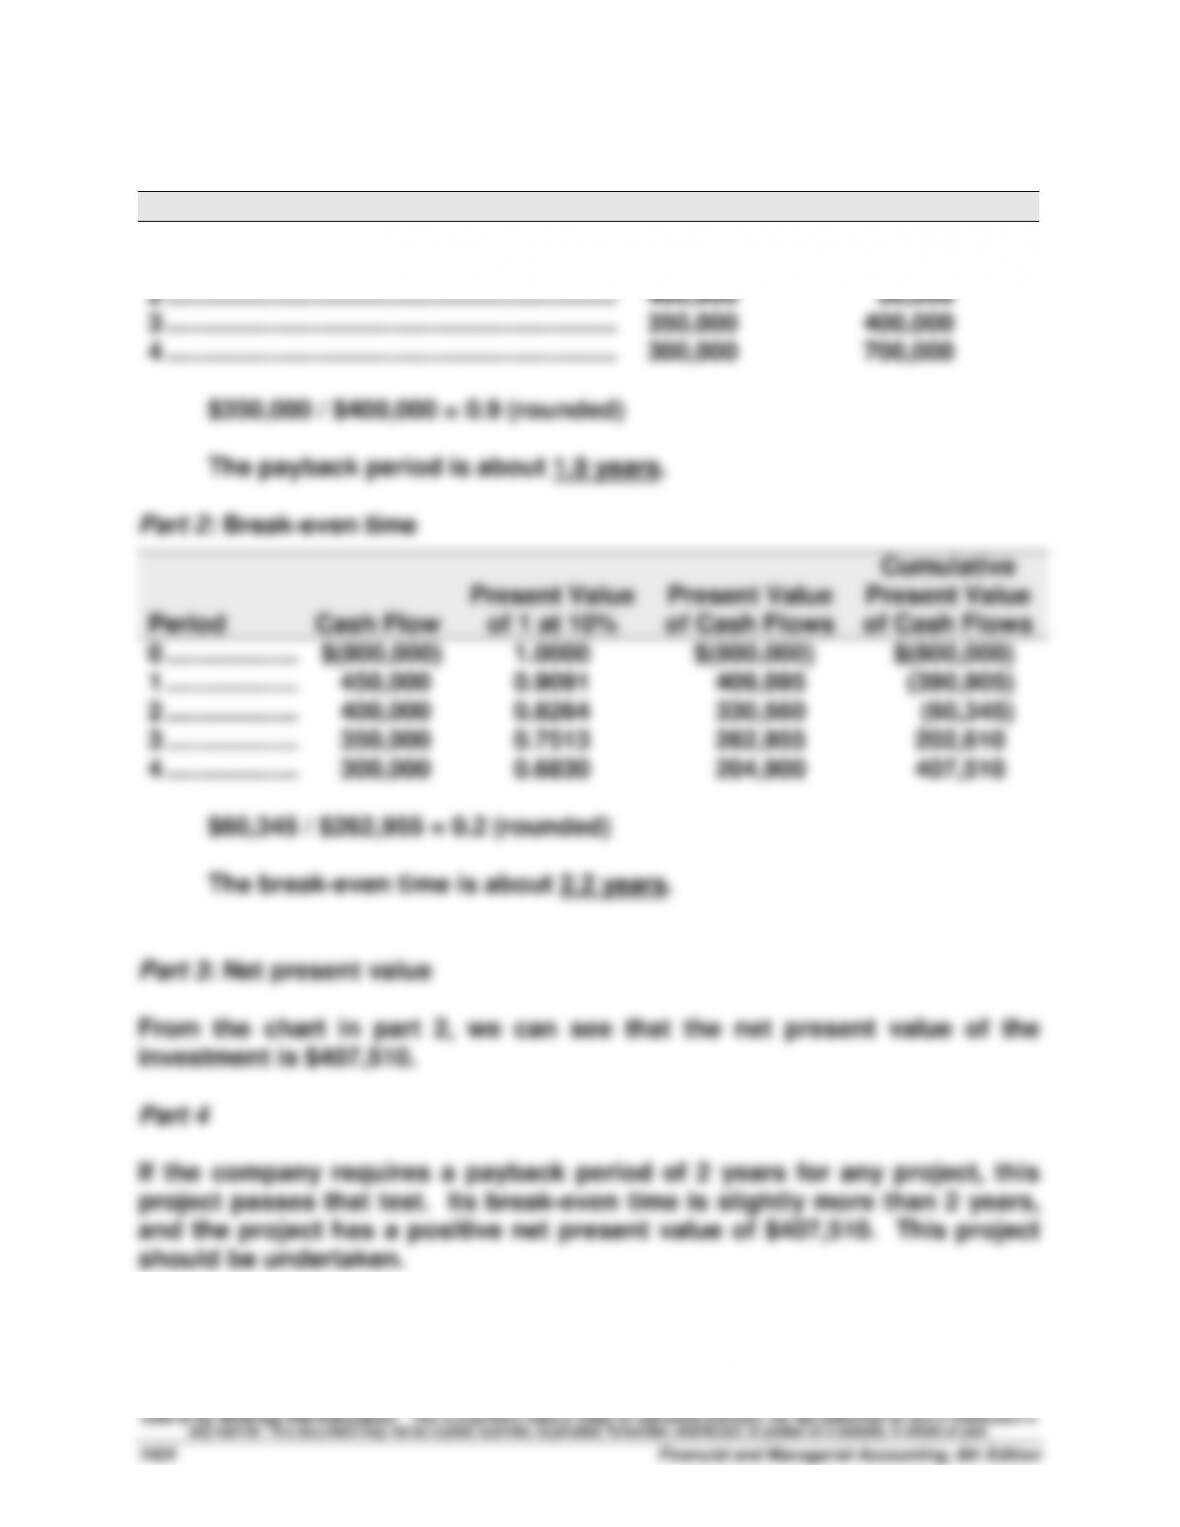
Problem 24-6B (40 minutes)
Part 1: Payback period
Period
Cash flow
Cumulative cash flow
0 …………………………..………………………………………
$(800,000)
$(800,000)
1 …………………………..………………………………………
450,000
(350,000)
2 …………………………..………………………………………
400,000
50,000
3 …………………………..………………………………………
350,000
400,000
4 …………………………..………………………………………
300,000
700,000
$350,000 / $400,000 = 0.9 (rounded)
The payback period is about 1.9 years.
Part 2: Break-even time
Period
Cash Flow
Present Value
of 1 at 10%
Present Value
of Cash Flows
Cumulative
Present Value
of Cash Flows
0 ……………….
$(800,000)
1.0000
$(800,000)
$(800,000)
1 ……………….
450,000
0.9091
409,095
(390,905)
2 ……………….
400,000
0.8264
330,560
(60,345)
3 ……………….
350,000
0.7513
262,955
202,610
4 ……………….
300,000
0.6830
204,900
407,510
$60,345 / $262,955 = 0.2 (rounded)
The break-even time is about 2.2 years.
Part 3: Net present value
From the chart in part 2, we can see that the net present value of the
investment is $407,510.
Part 4
If the company requires a payback period of 2 years for any project, this
project passes that test. Its break-even time is slightly more than 2 years,
and the project has a positive net present value of $407,510. This project
should be undertaken.