Problem 24-1A (Continued)
Part 4
Accounting rate of return = = 21.56%
* Average investment
Asset cost ………………………………………………………………..……..
$480,000
Final year’s book value ……………………………………………..……..
20,000
Sum ………………………………………………………………………………..
$500,000
Average (Sum /2) ……………………………………………………….
$250,000
Part 5
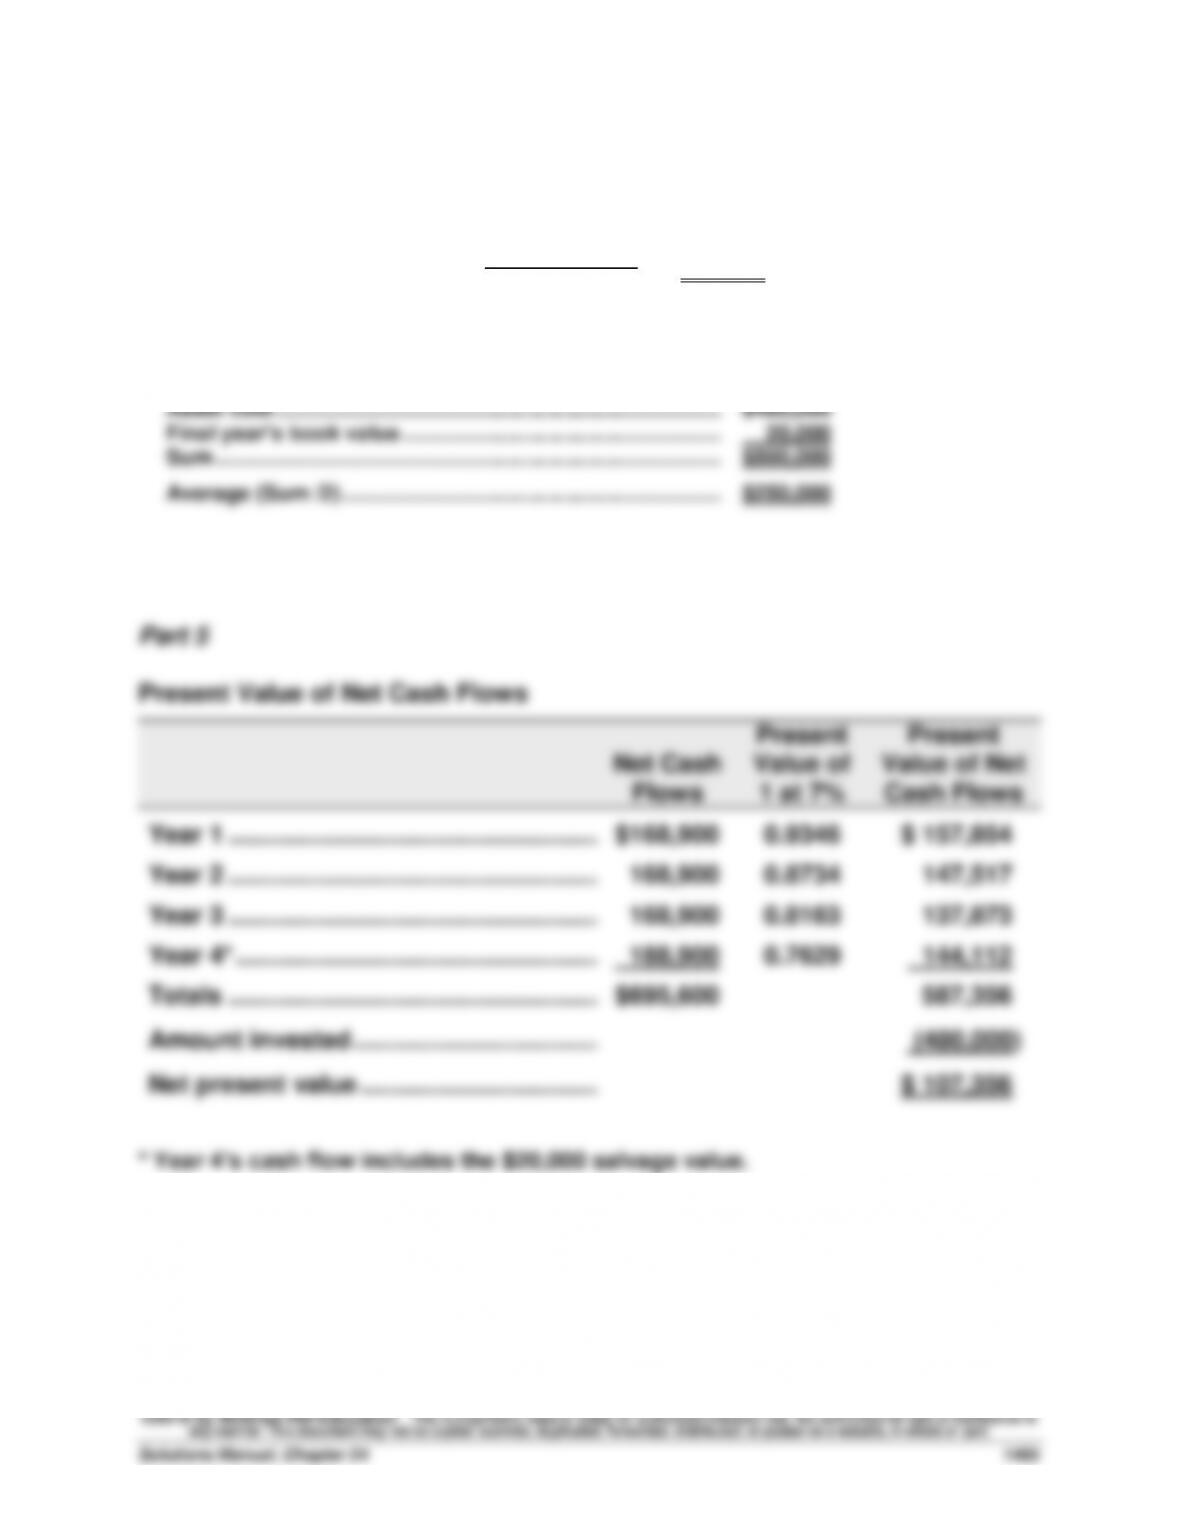
Present Value of Net Cash Flows
Present
Present
Net Cash
Value of
Value of Net
Flows
1 at 7%
Cash Flows
Year 1 ………………………………………………….
$168,900
0.9346
$ 157,854
Year 2 ………………………………………………….
168,900
0.8734
147,517
Year 3 ………………………………………………….
168,900
0.8163
137,873
Year 4* ……………………………………………..….
188,900
0.7629
144,112
Totals ………………………………………………….
$695,600
587,356
Amount invested ………………………………….
(480,000)
Net present value ……………………………..….
$ 107,356
* Year 4’s cash flow includes the $20,000 salvage value.
$53,900
$250,000*
Problem 24-2A (55 minutes)
Part 1
PROJECT Y
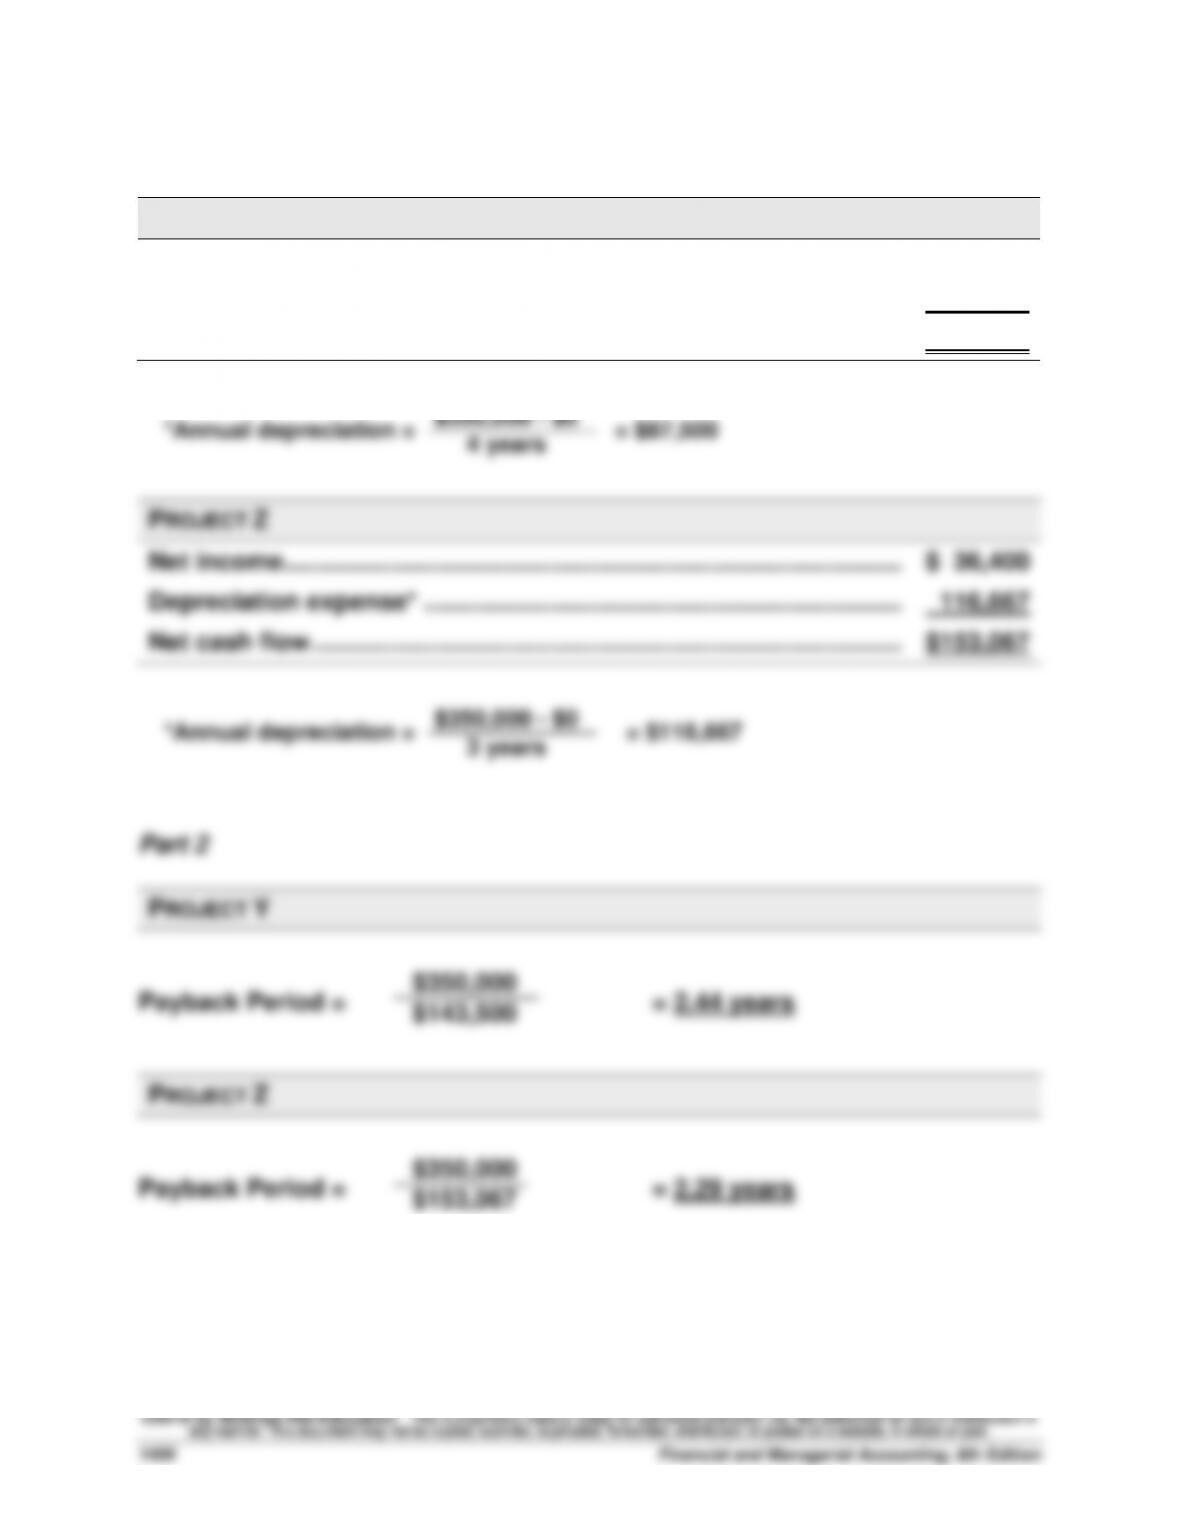
Net income ……………………………………………………………………………...
$ 56,000
Depreciation expense* …………………………………………………………….
87,500
Net cash flow …………………………………………………………………………..
$143,500
Depreciation expense* …………………………………………………………….
Net cash flow …………………………………………………………………………..
PROJECT Y
PROJECT Z
$350,000 – $0
Problem 24–2A (Continued)
Part 3
PROJECT Y
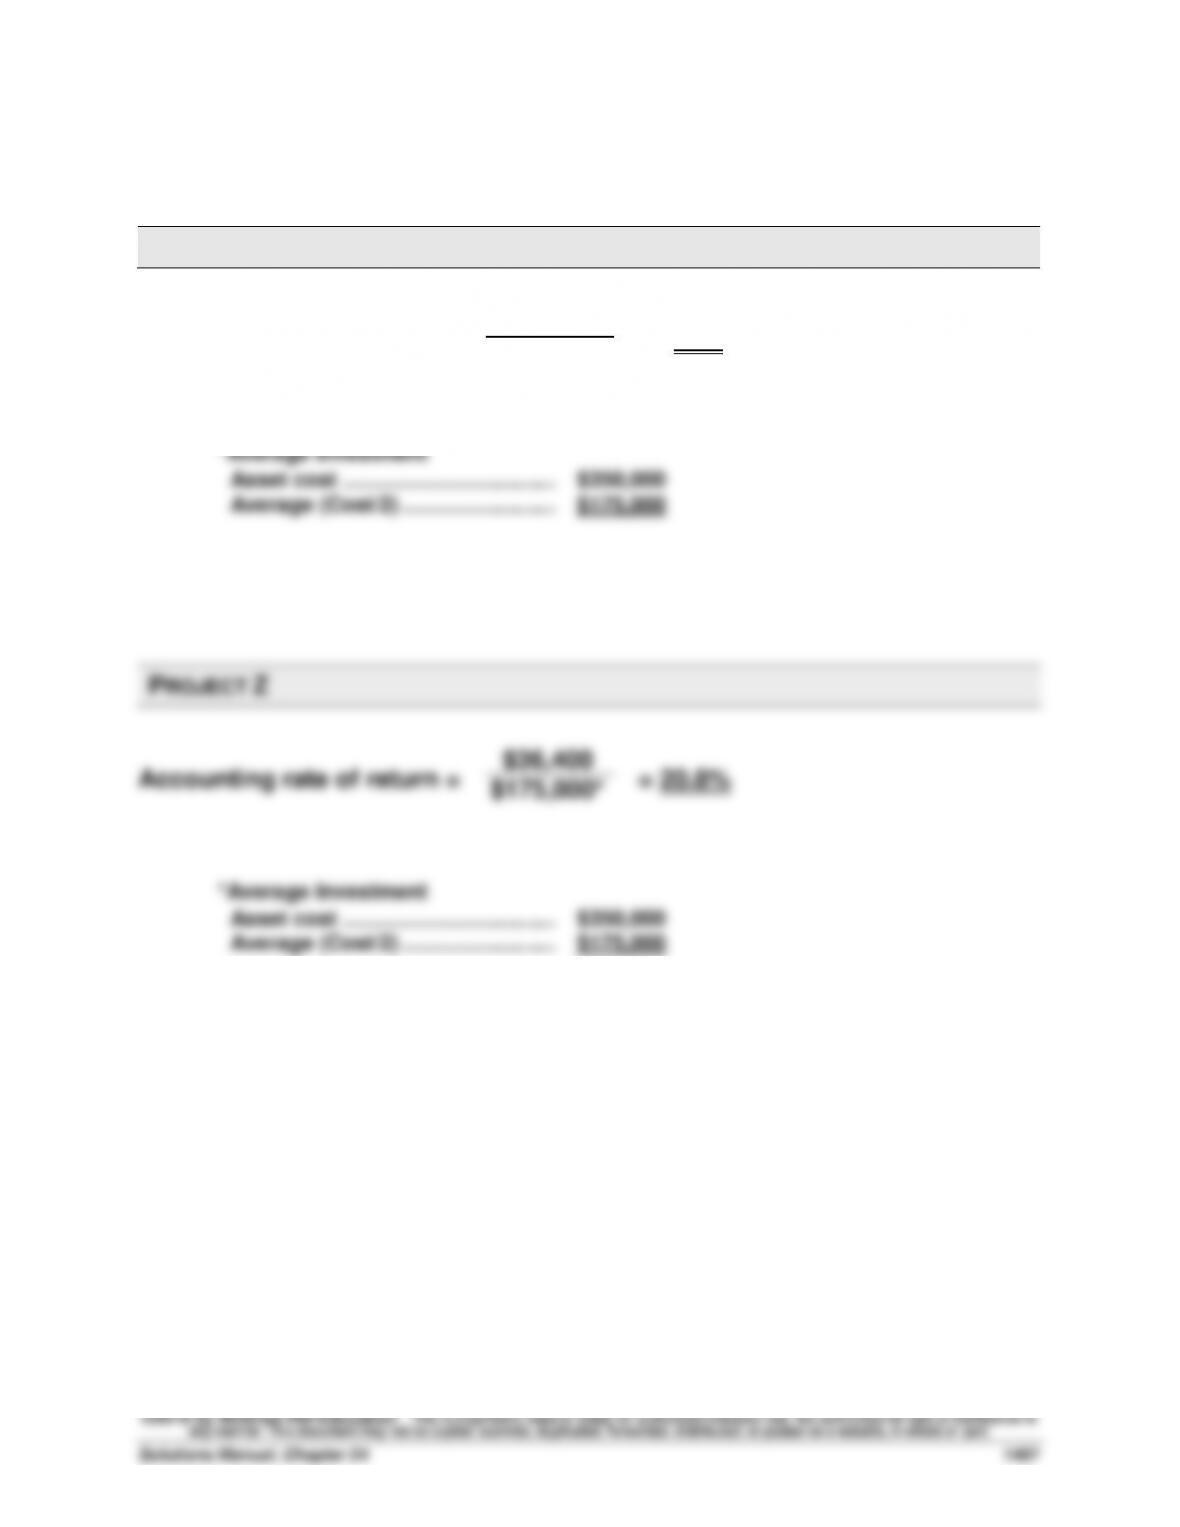
Accounting rate of return = = 32%
*Average investment
Asset cost …………………………………………
$350,000
Average (Cost/2) ……………………..……
$175,000
PROJECT Z
Accounting rate of return = = 20.8%
*Average investment
Asset cost …………………………………………
$350,000
Average (Cost/2) ……………………..……
$175,000
$56,000
$175,000*
$36,400
$175,000*
Problem 24–2A (Continued)
Part 4
PROJECT Y
Present Value of Net Cash Flows
Present
Present
Value of
Value of
Net Cash
Flows
1 at 8%
Annuity
Net Cash
Flows
Years 1-4 ………………………………………………
$143,500
3.3121
$475,286
Amount invested …………………………………..
(350,000)
Net present value ………………………………….
$125,286
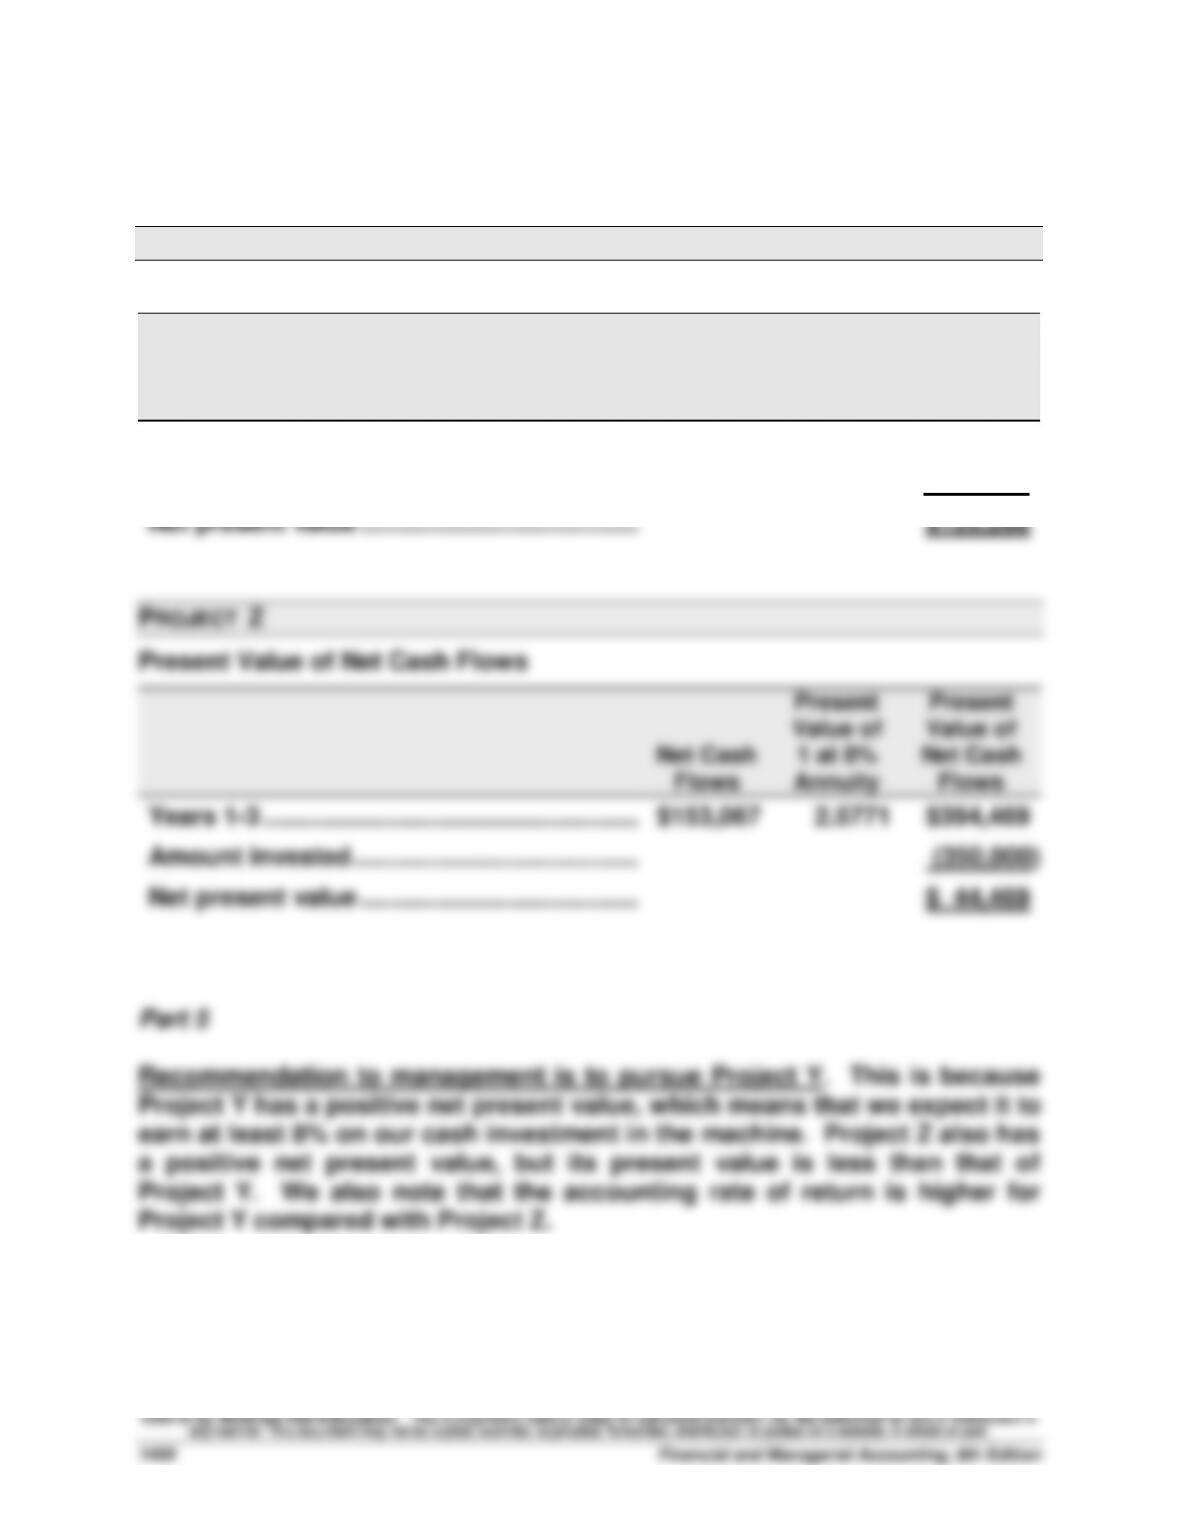
PROJECT Z
Present Value of Net Cash Flows
Present
Present
Value of
Value of
Net Cash
Flows
1 at 8%
Annuity
Net Cash
Flows
Years 1-3 …………………………..………………….
$153,067
2.5771
$394,469
Amount invested …………………………………..
(350,000)
Net present value ………………………………….
$ 44,469
Part 5
Recommendation to management is to pursue Project Y. This is because
Project Y has a positive net present value, which means that we expect it to
earn at least 8% on our cash investment in the machine. Project Z also has
a positive net present value, but its present value is less than that of
Project Y. We also note that the accounting rate of return is higher for
Project Y compared with Project Z.
Problem 24-3A (60 minutes)
Part 1
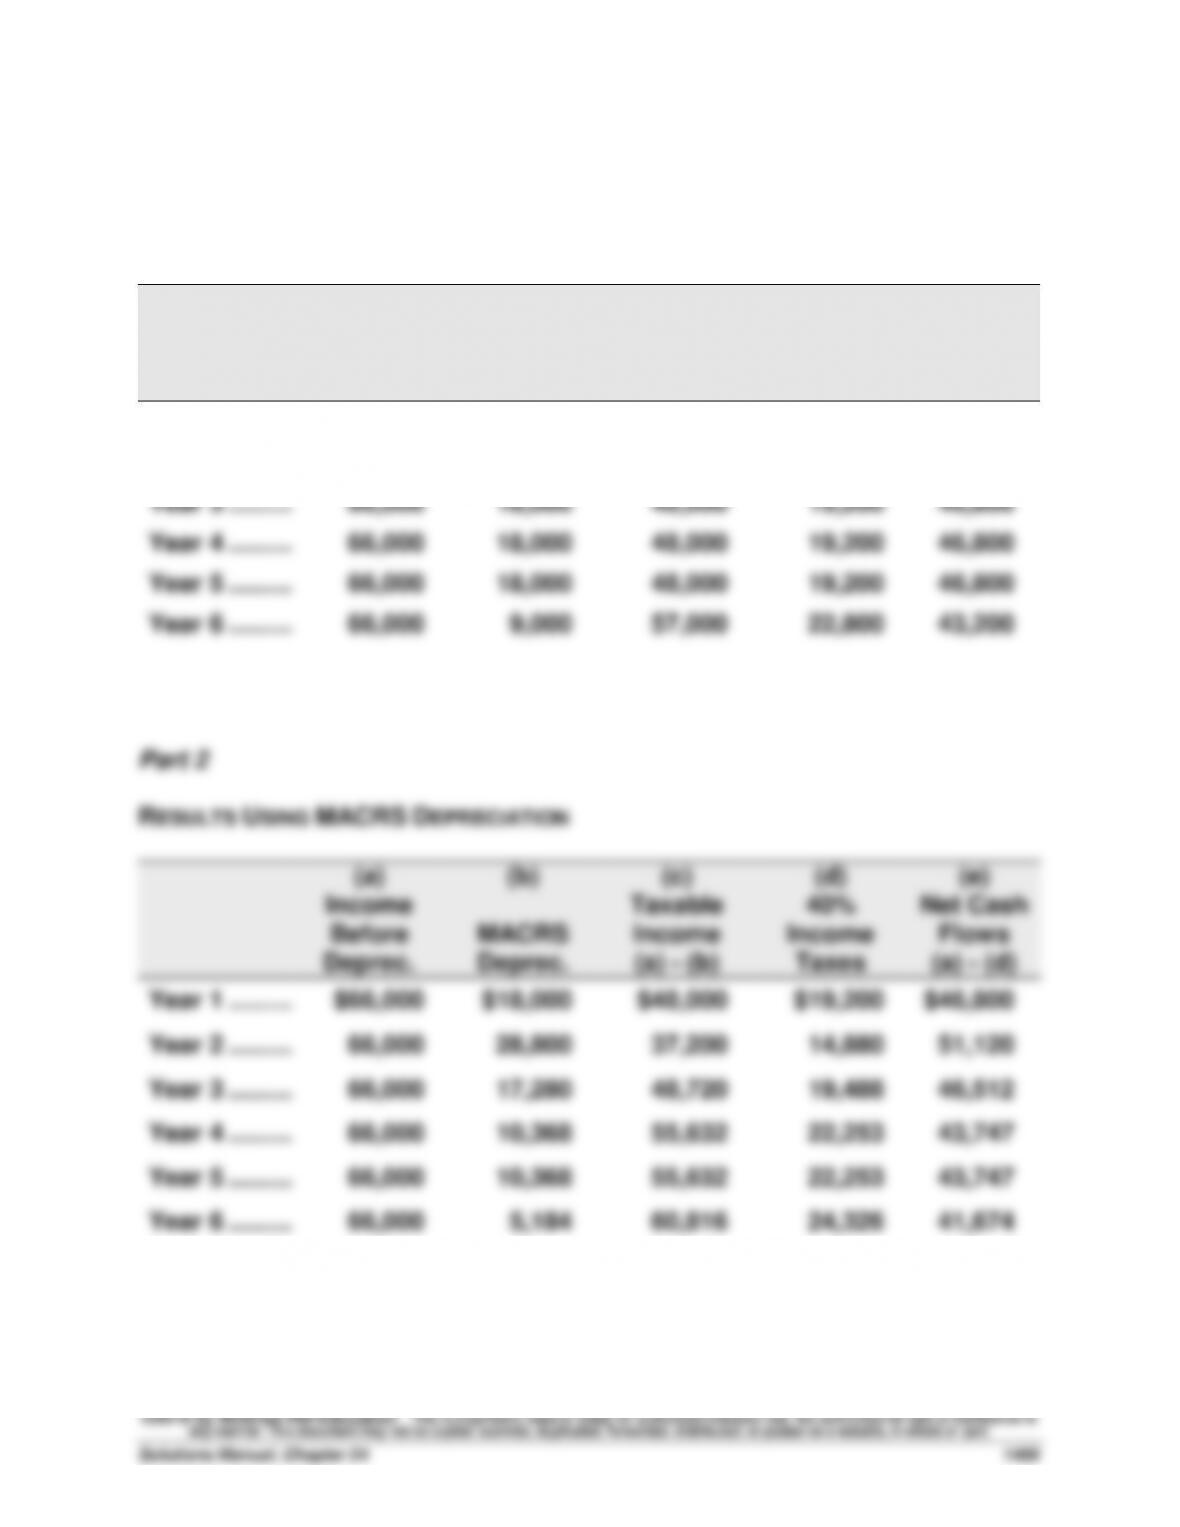
RESULTS USING STRAIGHT-LINE DEPRECIATION
(a)
Income
Before
Deprec.
(b)
Straight–
Line
Deprec.
(c)
Taxable
Income
(a) – (b)
(d)
40%
Income
Taxes
(e)
Net Cash
Flows
(a) – (d)
Year 1 ……….………………
$66,000
$ 9,000
$57,000
$22,800
$43,200
Year 2 ……….………………
66,000
18,000
48,000
19,200
46,800
Year 3 ……….………………
66,000
18,000
48,000
19,200
46,800
Year 4 ……….………………
66,000
18,000
48,000
19,200
46,800
Year 5 ……….………………
66,000
18,000
48,000
19,200
46,800
Year 6 ……….………………
66,000
9,000
57,000
22,800
43,200
Part 2
RESULTS USING MACRS DEPRECIATION
(a)
Income
Before
Deprec.
(b)
MACRS
Deprec.
(c)
Taxable
Income
(a) – (b)
(d)
40%
Income
Taxes
(e)
Net Cash
Flows
(a) – (d)
Year 1 ……….………………
$66,000
$18,000
$48,000
$19,200
$46,800
Year 2 ……….………………
66,000
28,800
37,200
14,880
51,120
Year 3 ……….………………
66,000
17,280
48,720
19,488
46,512
Year 4 ……….………………
66,000
10,368
55,632
22,253
43,747
Year 5 ……….………………
66,000
10,368
55,632
22,253
43,747
Year 6 ……….………………
66,000
5,184
60,816
24,326
41,674
Problem 24–3A (Continued)
Part 3
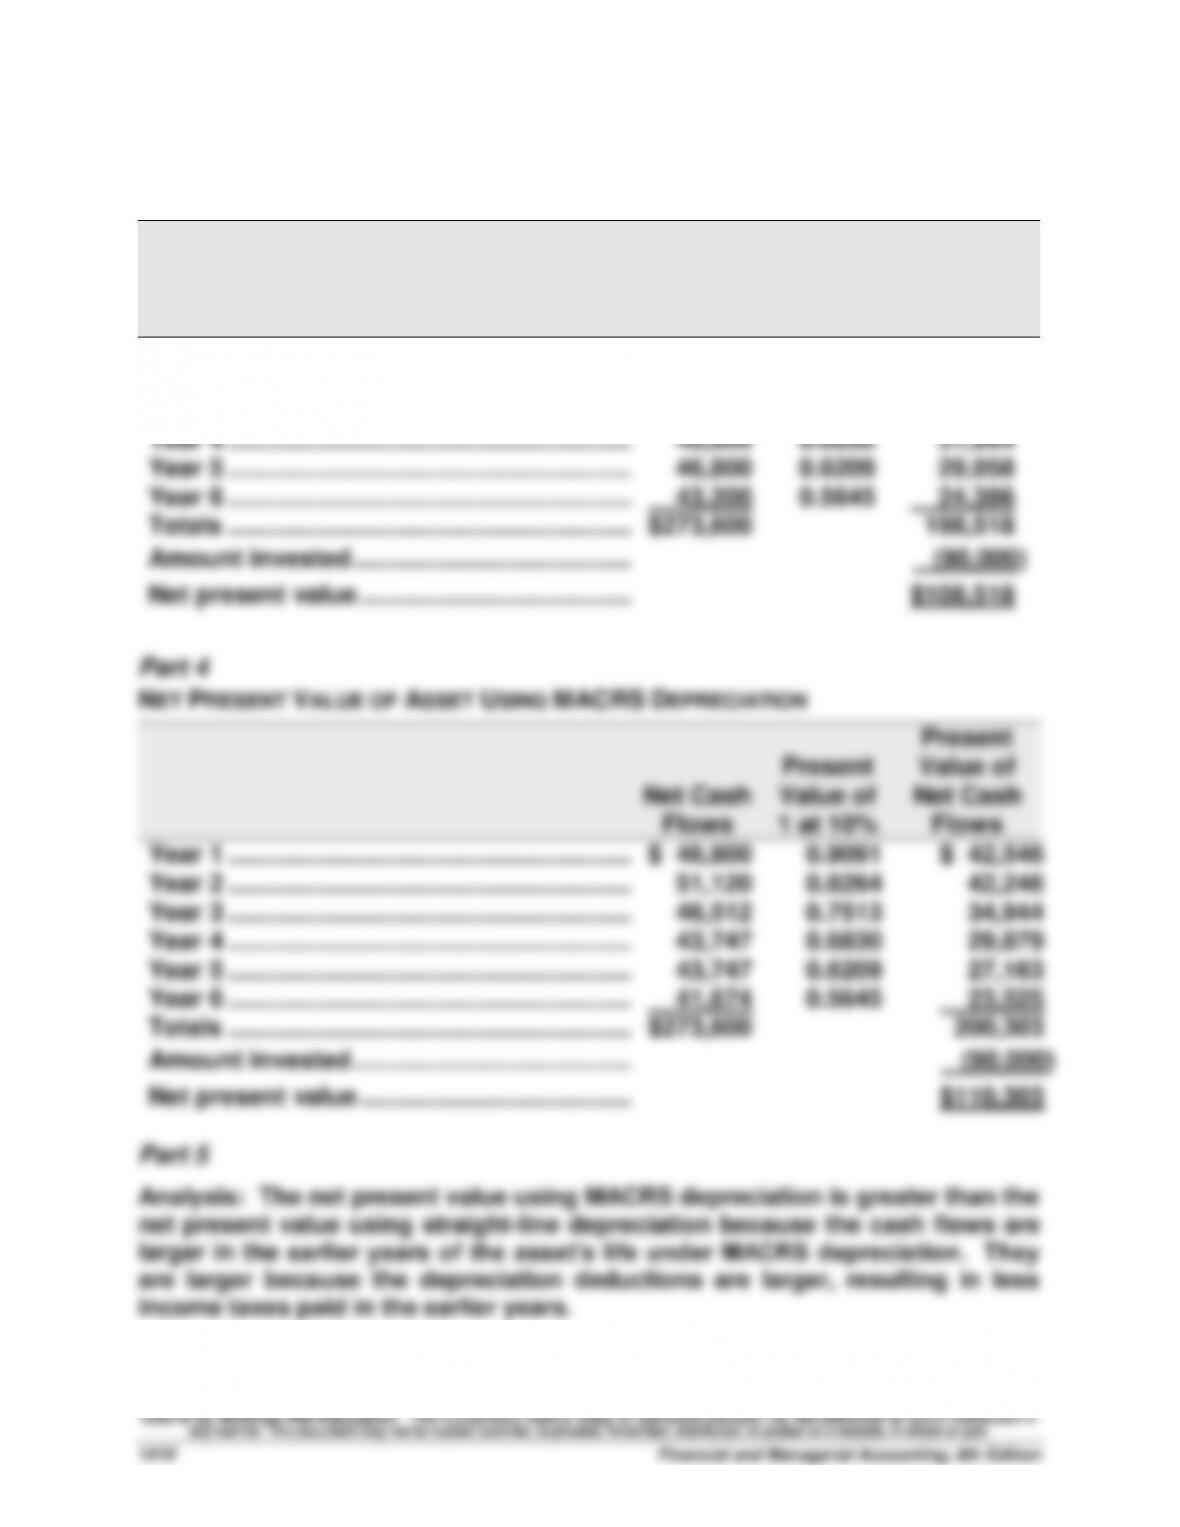
NET PRESENT VALUE OF ASSET USING STRAIGHT-LINE DEPRECIATION
Present
Present
Value of
Net Cash
Flows
Value of
1 at 10%
Net Cash
Flows
Year 1 ………………………………………………….
$ 43,200
0.9091
$ 39,273
Year 2 ………………………………………………….
46,800
0.8264
38,676
Year 3 ………………………………………………….
46,800
0.7513
35,161
Year 4 ………………………………………………….
46,800
0.6830
31,964
Year 5 ………………………………………………….
46,800
0.6209
29,058
Year 6 ………………………………………………….
43,200
0.5645
24,386
Totals ………………………………………………….
$273,600
198,518
Amount invested ………………………………….
(90,000)
Net present value …………………………………
$108,518
Part 4
NET PRESENT VALUE OF ASSET USING MACRS DEPRECIATION
Present
Present
Value of
Net Cash
Flows
Value of
1 at 10%
Net Cash
Flows
Year 1 ………………………………………………….
$ 46,800
0.9091
$ 42,546
Year 2 ………………………………………………….
51,120
0.8264
42,246
Year 3 ………………………………………………….
46,512
0.7513
34,944
Year 4 ………………………………………………….
43,747
0.6830
29,879
Year 5 ………………………………………………….
43,747
0.6209
27,163
Year 6 ………………………………………………….
41,674
0.5645
23,525
Totals ………………………………………………….
$273,600
200,303
Amount invested ………………………………….
(90,000)
Net present value …………………………………
$110,303
Part 5
Analysis: The net present value using MACRS depreciation is greater than the
net present value using straight-line depreciation because the cash flows are
larger in the earlier years of the asset’s life under MACRS depreciation. They
are larger because the depreciation deductions are larger, resulting in less
income taxes paid in the earlier years.
Problem 24-4A (45 minutes)
Part 1
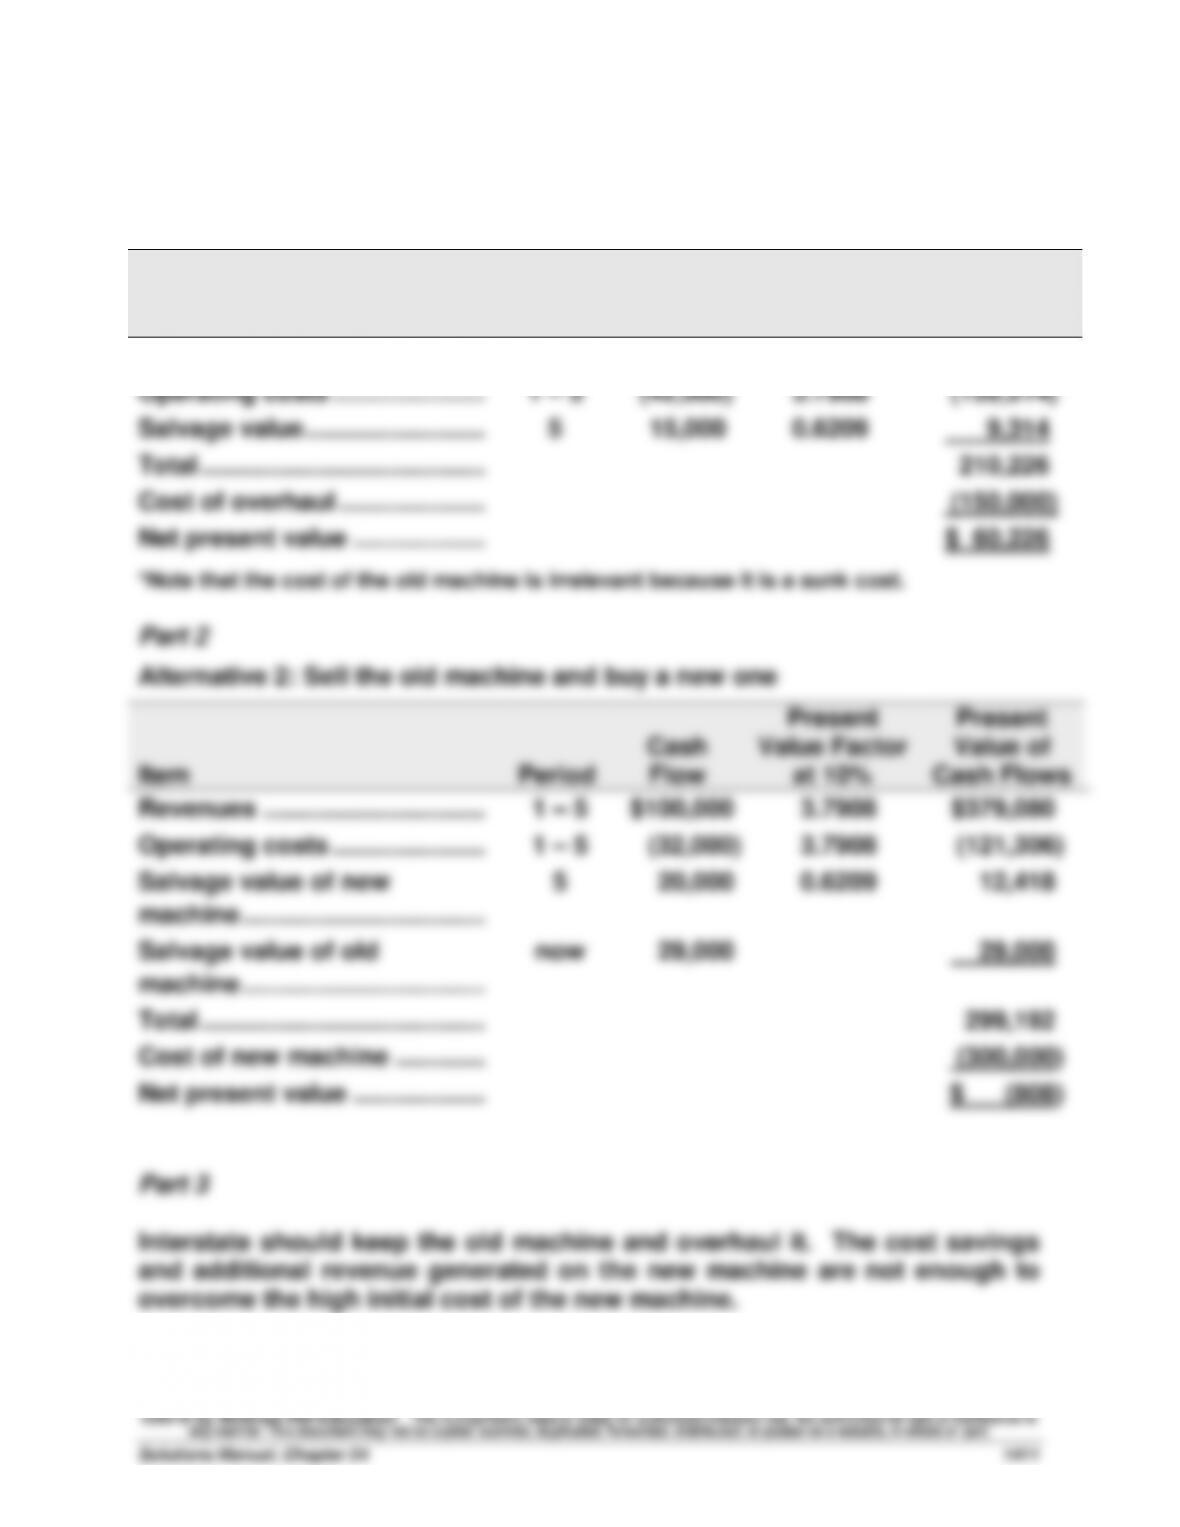
Alternative 1: Keep the old machine and have it overhauled
Item
Period
Cash
Flow
Present
Value Factor
at 10%
Present
Value of
Cash Flows
Revenues …………………………..
1 – 5
$95,000
3.7908
$360,126
Operating costs ………………….
1 – 5
(42,000)
3.7908
(159,214)
Salvage value ……………………..
5
15,000
0.6209
9,314
Total …………………………………..
210,226
Cost of overhaul …………………
(150,000)
Net present value ……………….
$ 60,226
*Note that the cost of the old machine is irrelevant because it is a sunk cost.
Part 2
Alternative 2: Sell the old machine and buy a new one
Item
Period
Cash
Flow
Present
Value Factor
at 10%
Present
Value of
Cash Flows
Revenues …………………………..
1 – 5
$100,000
3.7908
$379,080
Operating costs ………………….
1 – 5
(32,000)
3.7908
(121,306)
Salvage value of new
machine …………………………..…
5
20,000
0.6209
12,418
Salvage value of old
machine …………………………..…
now
29,000
29,000
Total …………………………………..
299,192
Cost of new machine ………….
(300,000)
Net present value ……………….
$ (808)
Part 3
Interstate should keep the old machine and overhaul it. The cost savings
and additional revenue generated on the new machine are not enough to
overcome the high initial cost of the new machine.
Problem 24-5A (40 minutes)
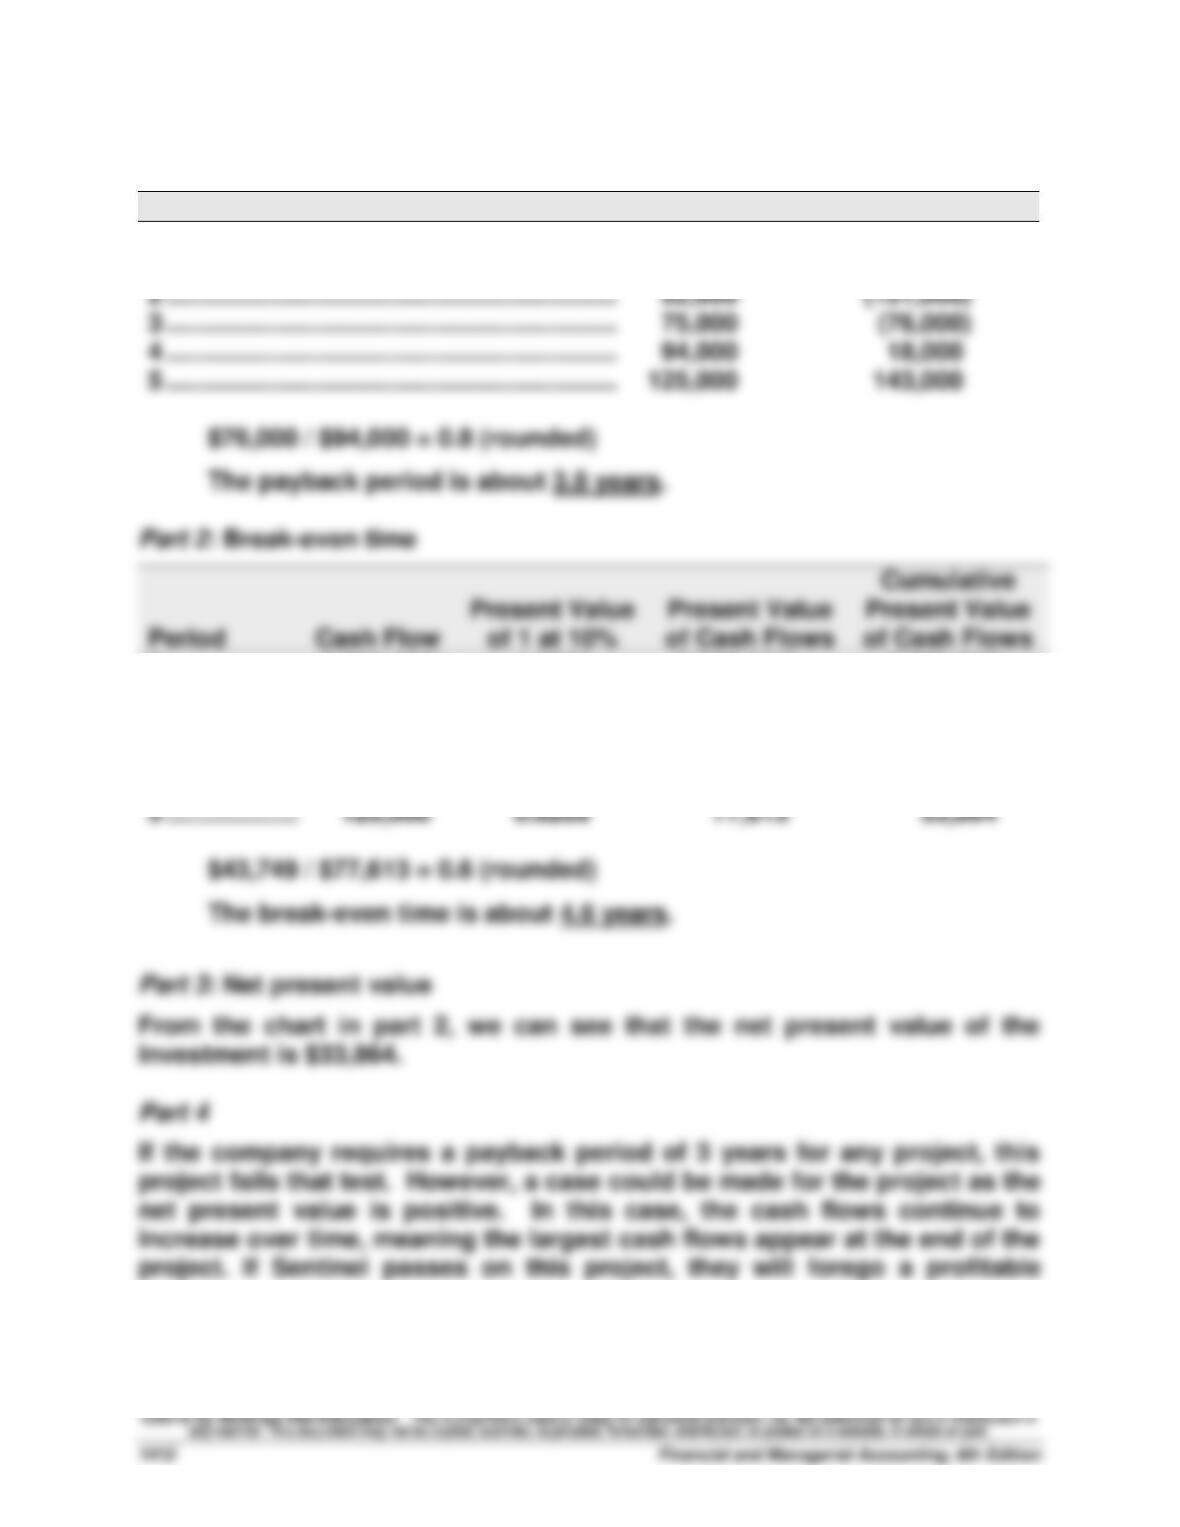
Part 1: Payback period
Period
Cash flow
Cumulative cash flow
0 …………………………..………………………………………
$(250,000)
$(250,000)
1 …………………………..………………………………………
47,000
(203,000)
2 …………………………..………………………………………
52,000
(151,000)
3 …………………………..………………………………………
75,000
(76,000)
4 …………………………..………………………………………
94,000
18,000
5 …………………………..………………………………………
125,000
143,000
$76,000 / $94,000 = 0.8 (rounded)
The payback period is about 3.8 years.
Part 2: Break-even time
Period
Cash Flow
Present Value
of 1 at 10%
Present Value
of Cash Flows
Cumulative
Present Value
of Cash Flows
0 ……………….
$(250,000)
1.0000
$(250,000)
$(250,000)
1 ……………….
47,000
0.9091
42,728
(207,272)
2 ……………….
52,000
0.8264
42,973
(164,299)
3 ……………….
75,000
0.7513
56,348
(107,951)
4 ……………….
94,000
0.6830
64,202
(43,749)
5 ……………….
125,000
0.6209
77,613
33,864
$43,749 / $77,613 = 0.6 (rounded)
The break-even time is about 4.6 years.
Part 3: Net present value
From the chart in part 2, we can see that the net present value of the
investment is $33,864.
Part 4
If the company requires a payback period of 3 years for any project, this
project fails that test. However, a case could be made for the project as the
net present value is positive. In this case, the cash flows continue to
increase over time, meaning the largest cash flows appear at the end of the
project. If Sentinel passes on this project, they will forego a profitable
project.
Problem 24-6A (40 minutes)
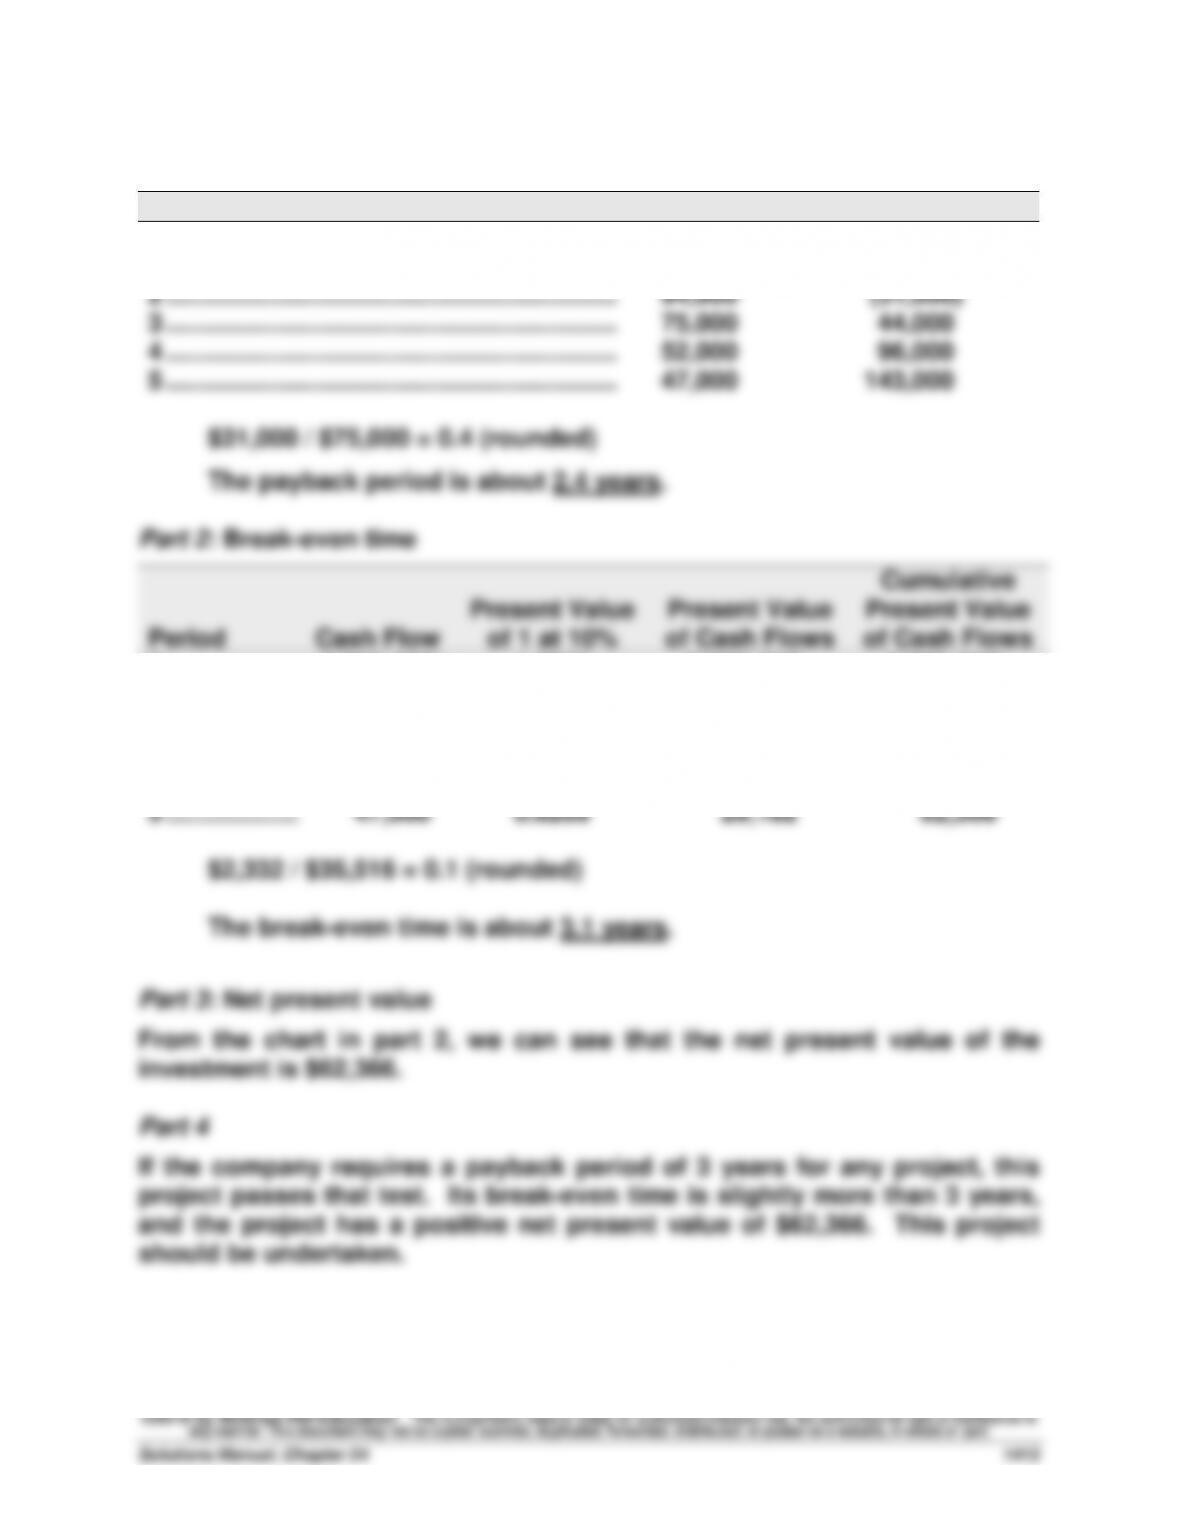
Part 1: Payback period
Period
Cash flow
Cumulative cash flow
0 …………………………..………………………………………
$(250,000)
$(250,000)
1 …………………………..………………………………………
125,000
(125,000)
2 …………………………..………………………………………
94,000
(31,000)
3 …………………………..………………………………………
75,000
44,000
4 …………………………..………………………………………
52,000
96,000
5 …………………………..………………………………………
47,000
143,000
$31,000 / $75,000 = 0.4 (rounded)
The payback period is about 2.4 years.
Part 2: Break-even time
Period
Cash Flow
Present Value
of 1 at 10%
Present Value
of Cash Flows
Cumulative
Present Value
of Cash Flows
0 ……………….
$(250,000)
1.0000
$(250,000)
$(250,000)
1 ……………….
125,000
0.9091
113,638
(136,362)
2 ……………….
94,000
0.8264
77,682
(58,680)
3 ……………….
75,000
0.7513
56,348
(2,332)
4 ……………….
52,000
0.6830
35,516
33,184
5 ……………….
47,000
0.6209
29,182
62,366
$2,332 / $35,516 = 0.1 (rounded)
The break-even time is about 3.1 years.
Part 3: Net present value
From the chart in part 2, we can see that the net present value of the
investment is $62,366.
Part 4
If the company requires a payback period of 3 years for any project, this
project passes that test. Its break-even time is slightly more than 3 years,
and the project has a positive net present value of $62,366. This project
should be undertaken.
Problem 24-6A (Concluded)
Part 5
While the total cash flows are identical to those in Problem 24-5A, the cash