Exercise 24-5 (20 minutes)
a.
Payback period = = = 2.21 years
where
Annual after-tax income ……………………………………………………….
$150,000
Plus depreciation* …………………………………………………………….…..
85,000
Annual net cash flow ………………………………………………………..…..
$235,000
*Annual depreciation = = $85,000
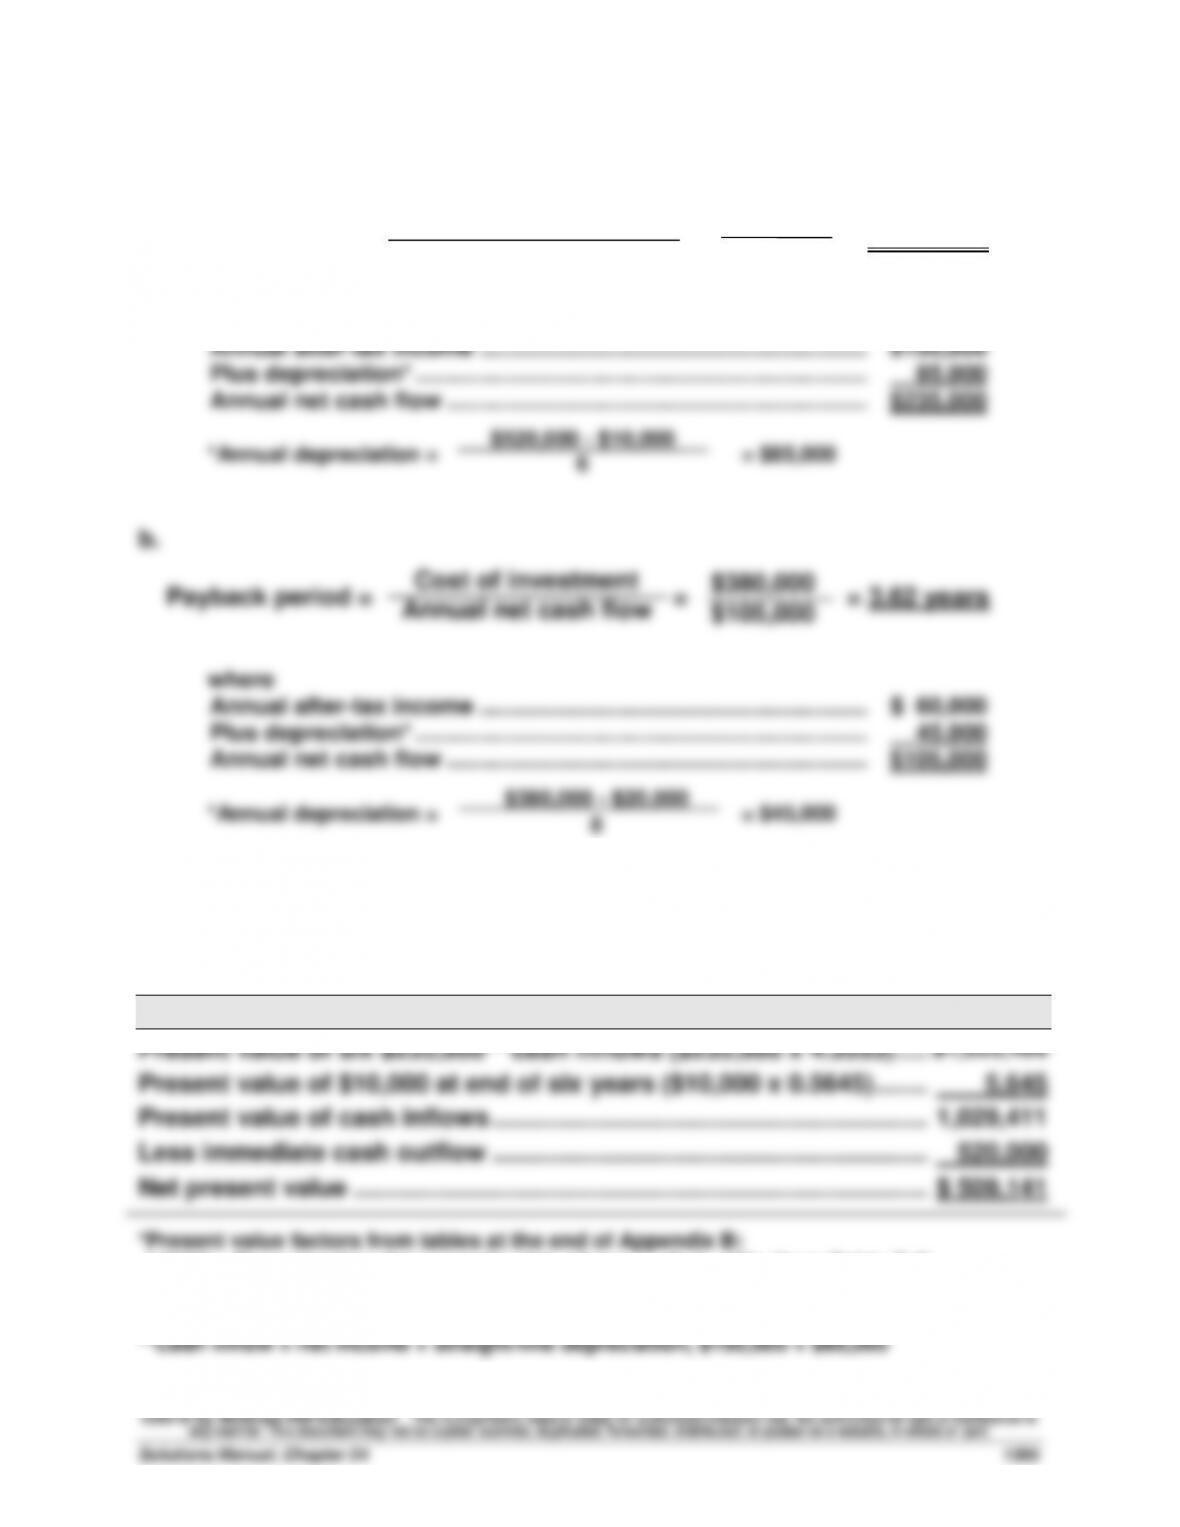
b.
Payback period = = = 3.62 years
where
Annual after-tax income ……………………………………………………….
$ 60,000
Plus depreciation* …………………………………………………………….…..
45,000
Annual net cash flow ………………………………………………………..…..
$105,000
*Annual depreciation = = $45,000
Exercise 24-6 (20 minutes)
a.
Net present value of investment*
Present value of six $235,000** cash inflows ($235,000 x 4.3553) …..……
$1,023,496
Present value of $10,000 at end of six years ($10,000 x 0.5645) ……..……
5,645
Present value of cash inflows ……………………………………………………….
1,029,411
Less immediate cash outflow ……………………………………………………….
520,000
Net present value ………………………………………………………………………..……
$ 509,141
*Present value factors from tables at the end of Appendix B:
4.3553 = Present value of an annuity of 1, where n = 6, i = 10% (from Table B.3)
0.5645 = Present value of 1, where n = 6, i = 10% (from Table B.1)
Cost of investment
Annual net cash flow
$520,000
$235,000
$520,000 – $10,000
6
Cost of investment
Annual net cash flow
$380,000
$105,000
$380,000 – $20,000
8
Exercise 24–6 (continued)
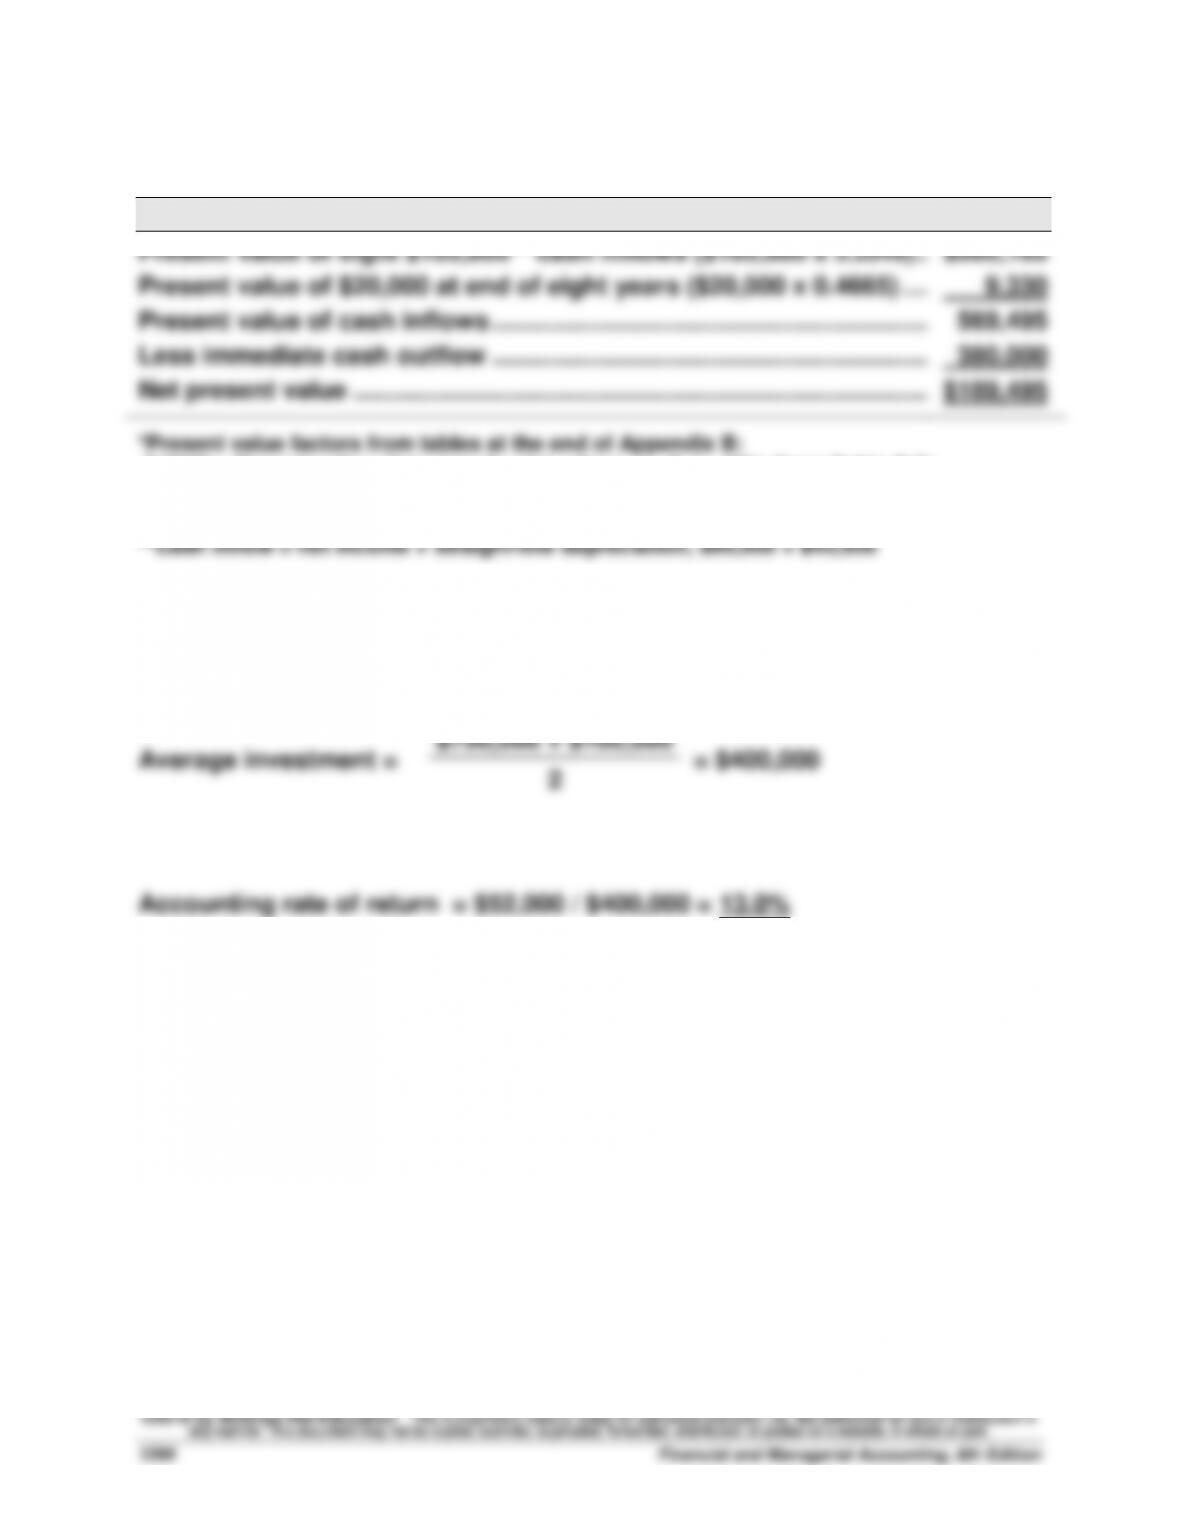
b.
Net present value of investment*
Present value of eight $105,000** cash inflows ($105,000 x 5.3349) ..……
$560,165
Present value of $20,000 at end of eight years ($20,000 x 0.4665) ….……
9,330
Present value of cash inflows ……………………………………………………….
569,495
Less immediate cash outflow ……………………………………………………….
380,000
Net present value ………………………………………………………………………..……
$189,495
*Present value factors from tables at the end of Appendix B:
5.3349 = Present value of an annuity of 1, where n = 8, i = 10% (from Table B.3)
0.4665 = Present value of 1, where n = 8, i = 10% (from Table B.1)
Exercise 24-7 (15 minutes)
$700,000 + $100,000
Exercise 24-8 (20 minutes)
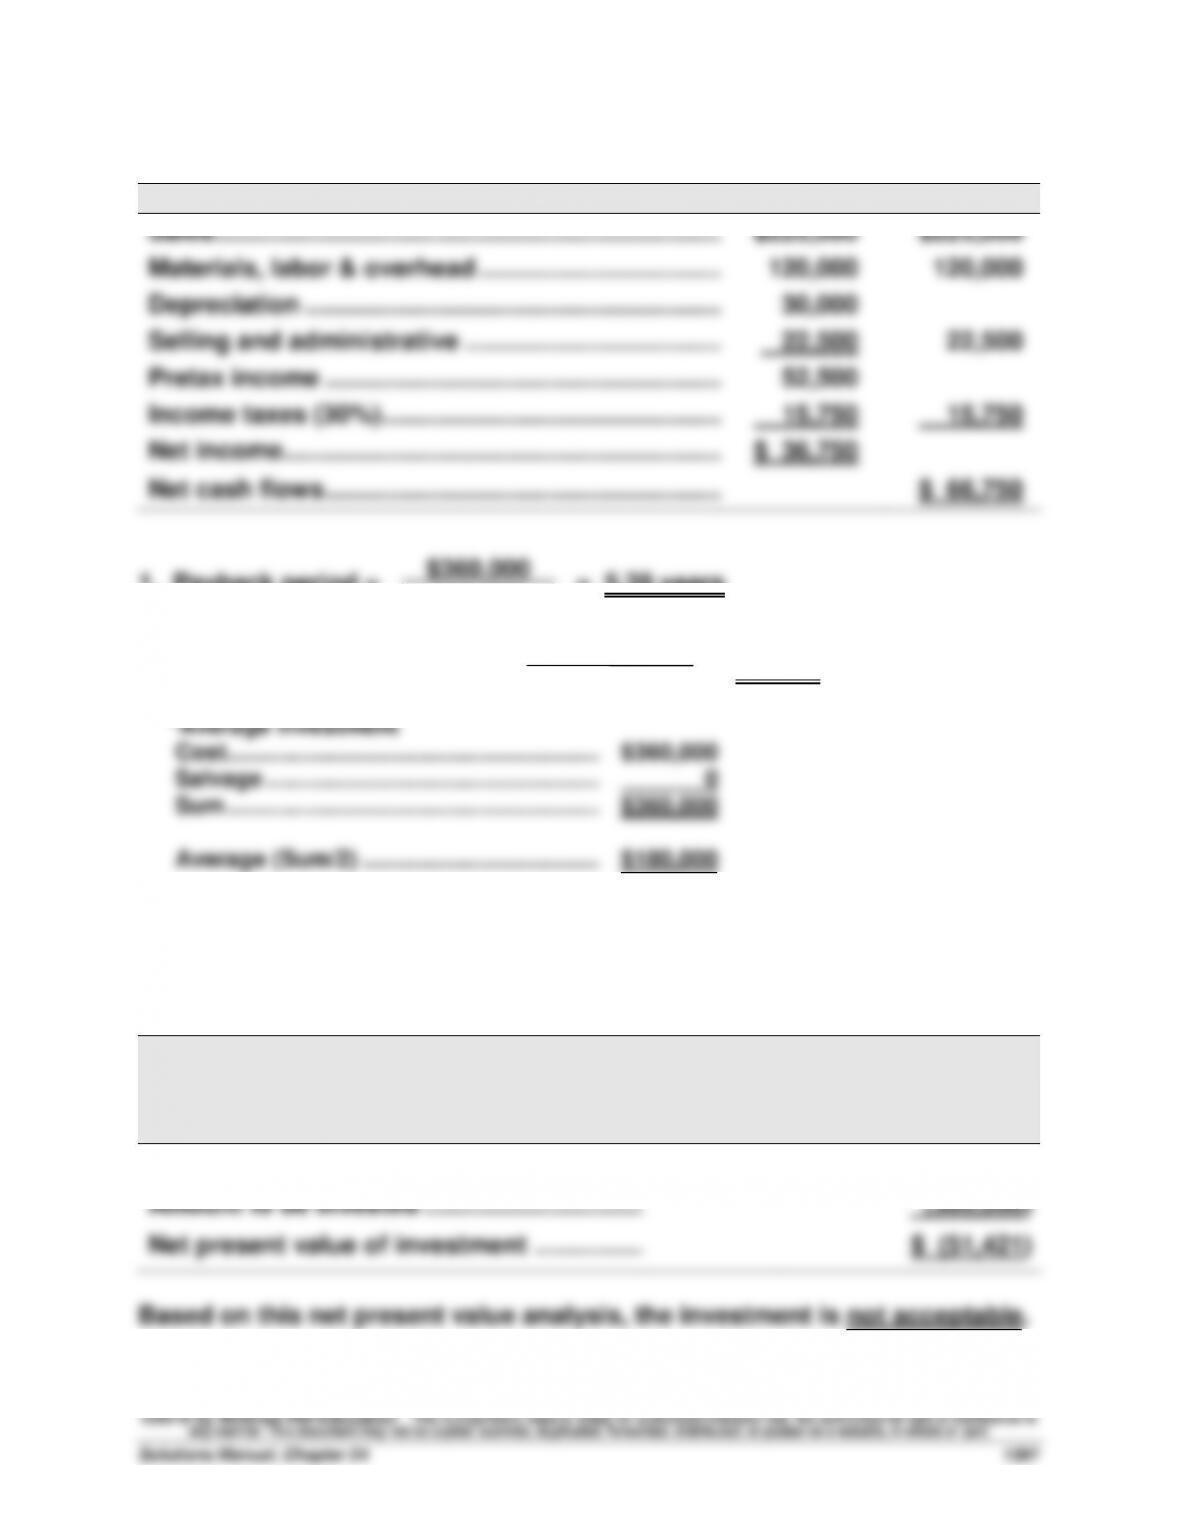
COMPUTING NET CASH FLOWS FROM NET INCOME
Net income
Cash flows
Sales ……………………………………………………………….…….
$225,000
$225,000
Materials, labor & overhead ……………………………..…….
120,000
120,000
Depreciation ……………………………………………………….
30,000
Selling and administrative ……………………………….…….
22,500
22,500
Pretax income ……………………………………………………….
52,500
Income taxes (30%)………………………………………….…….
15,750
15,750
Net income ……………………………………………………….
$ 36,750
Net cash flows ……………………………………………………….
$ 66,750
1. Payback period = = 5.39 years
2. Accounting rate of return = = 20.42%
$360,000
$66,750
$36,750
$180,000*
Exercise 24–10 (20 minutes)
PROJECT A
Net Cash
Flows
Present
Value of
1 at 10%
Present
Value of
Net Cash
Flows
Year 1 ……………………………………………………….
$ 40,000
0.9091
$ 36,364
Year 2 ……………………………………………………….
56,000
0.8264
46,278
Year 3 ……………………………………………………….
80,295
0.7513
60,326
Year 4 ……………………………………………………….
90,400
0.6830
61,743
Year 5 ……………………………………………………….
65,000
0.6209
40,359
Totals ……………………………………………………….
$331,695
245,070
Amount invested …………………………………………..
(160,000)
Net present value …………………………………..……..
$ 85,070
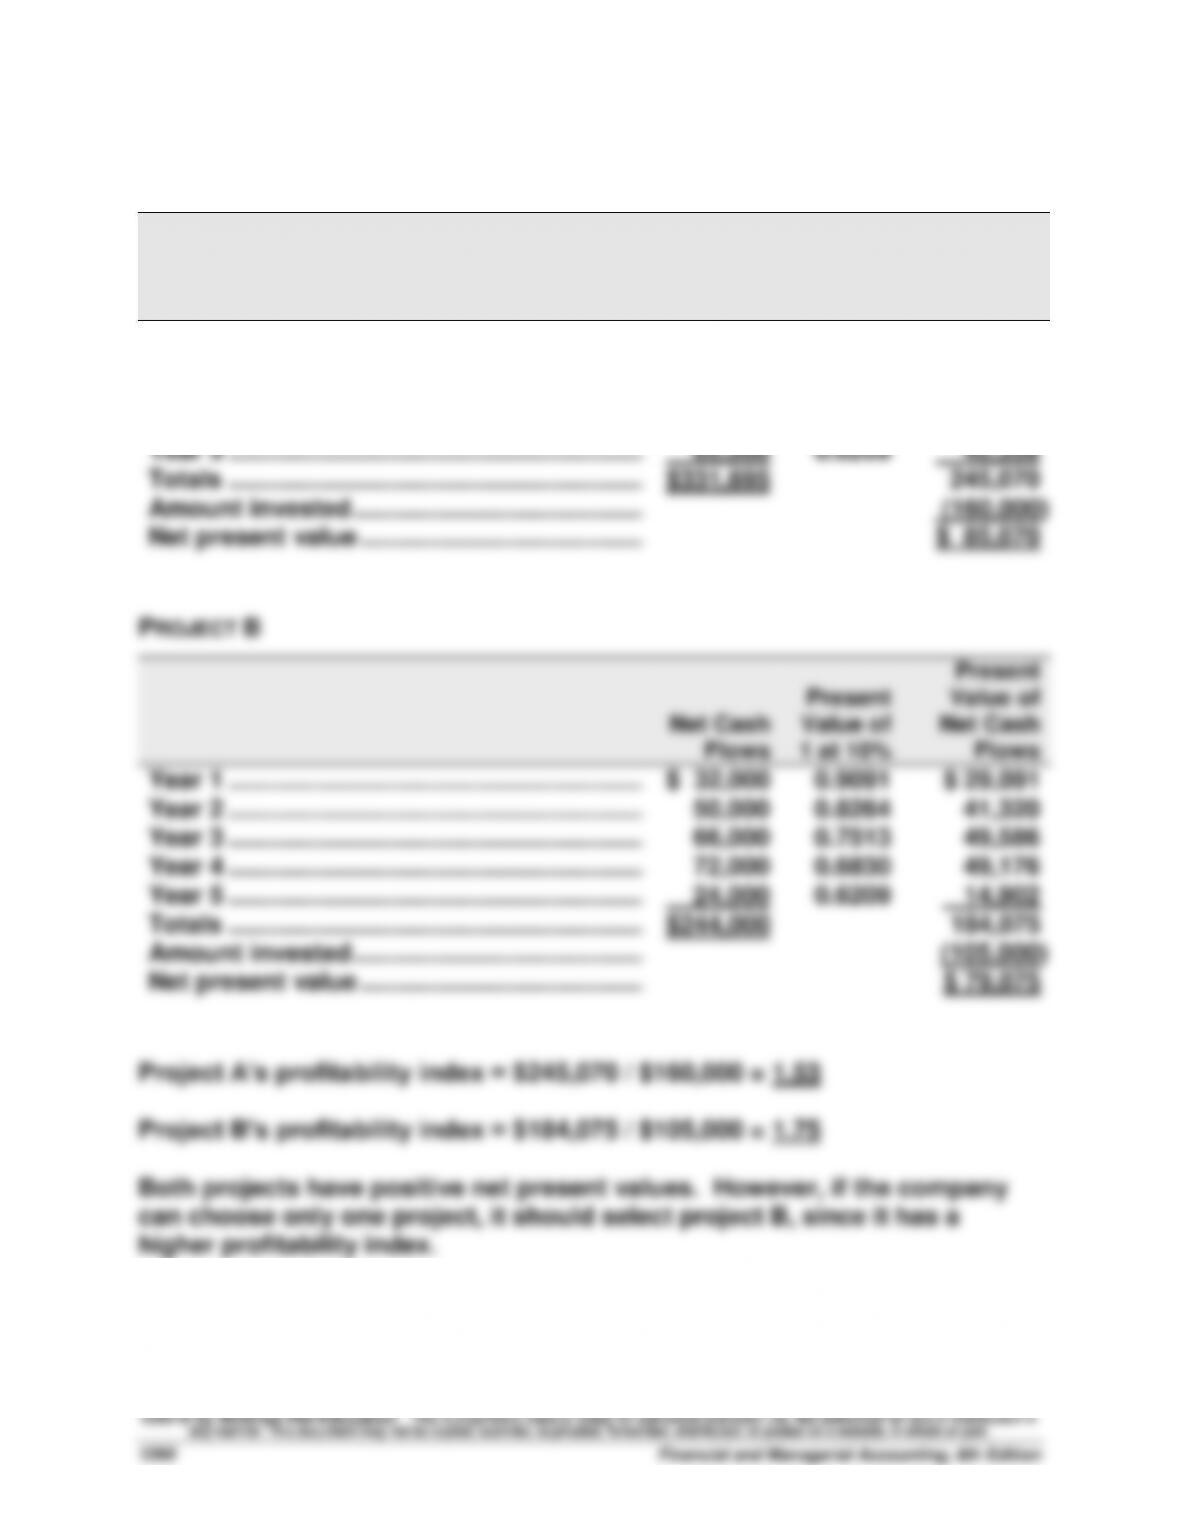
PROJECT B
Net Cash
Flows
Present
Value of
1 at 10%
Present
Value of
Net Cash
Flows
Year 1 ……………………………………………………….
$ 32,000
0.9091
$ 29,091
Year 2 ……………………………………………………….
50,000
0.8264
41,320
Year 3 ……………………………………………………….
66,000
0.7513
49,586
Year 4 ……………………………………………………….
72,000
0.6830
49,176
Year 5 ……………………………………………………….
24,000
0.6209
14,902
Totals ……………………………………………………….
$244,000
184,075
Amount invested …………………………………………..
(105,000)
Net present value …………………………………..……..
$ 79,075
Project A’s profitability index = $245,070 / $160,000 = 1.53
Project B’s profitability index = $184,075 / $105,000 = 1.75
Both projects have positive net present values. However, if the company
can choose only one project, it should select project B, since it has a
higher profitability index.
Exercise 24-11 (25 minutes)
a.
Project X1
Net Cash
Flows
Present
Value of
1 at 4%
Present
Value of
Net Cash
Flows
Year 1 ……………………………………………………….
$ 25,000
0.9615
$ 24,038
Year 2 ……………………………………………………….
35,500
0.9246
32,823
Year 3 ……………………………………………………….
60,500
0.8890
53,785
Totals ……………………………………………………….
$121,000
$110,646
Amount invested …………………………………………..
(80,000)
Net present value …………………………………..……..
$ 30,646
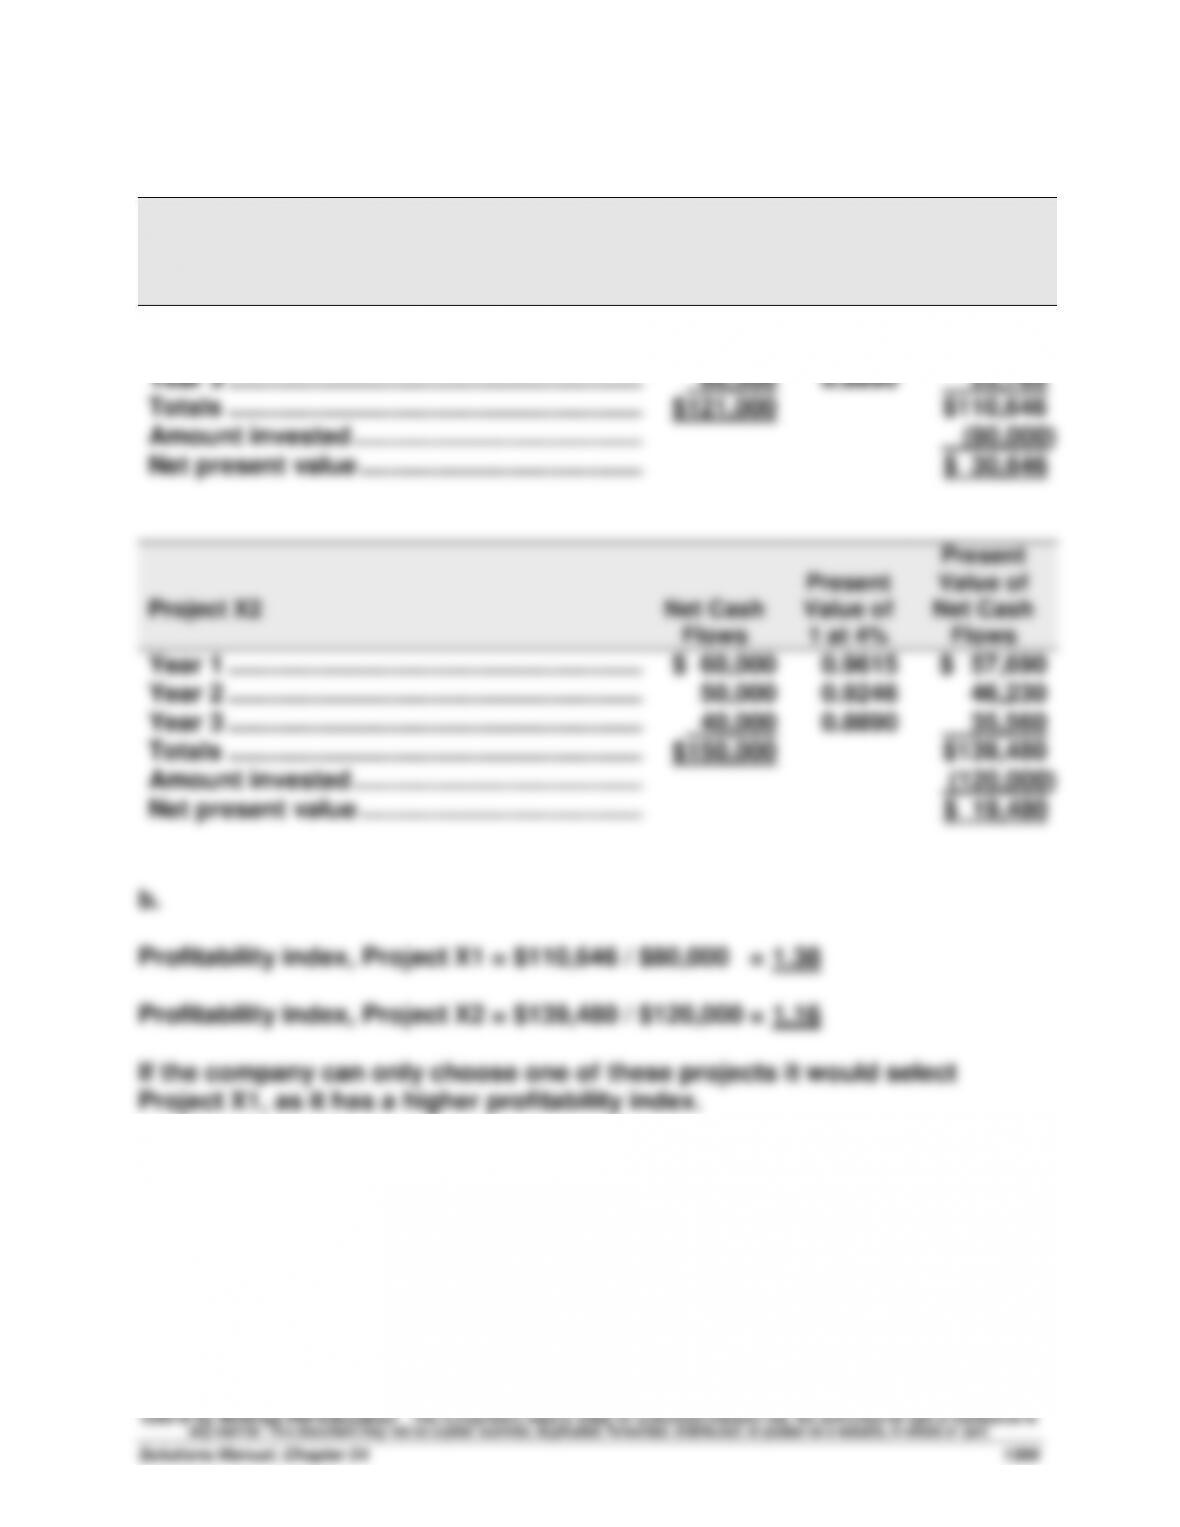
Project X2
Net Cash
Flows
Present
Value of
1 at 4%
Present
Value of
Net Cash
Flows
Year 1 ……………………………………………………….
$ 60,000
0.9615
$ 57,690
Year 2 ……………………………………………………….
50,000
0.9246
46,230
Year 3 ……………………………………………………….
40,000
0.8890
35,560
Totals ……………………………………………………….
$150,000
$139,480
Amount invested …………………………………………..
(120,000)
Net present value …………………………………..……..
$ 19,480
b.
Profitability index, Project X1 = $110,646 / $80,000 = 1.38
Profitability index, Project X2 = $139,480 / $120,000 = 1.16
If the company can only choose one of these projects it would select
Project X1, as it has a higher profitability index.
Exercise 24–12 (25 minutes)
a.
Project X1
Net Cash
Flows
Present
Value of
1 at 12%
Present
Value of
Net Cash
Flows
Year 1 ……………………………………………………….
$ 25,000
0.8929
$ 22,323
Year 2 ……………………………………………………….
35,500
0.7972
28,301
Year 3 ……………………………………………………….
60,500
0.7118
43,064
Totals ……………………………………………………….
$121,000
$93,688
Amount invested …………………………………………..
(80,000)
Net present value …………………………………..……..
$13,688
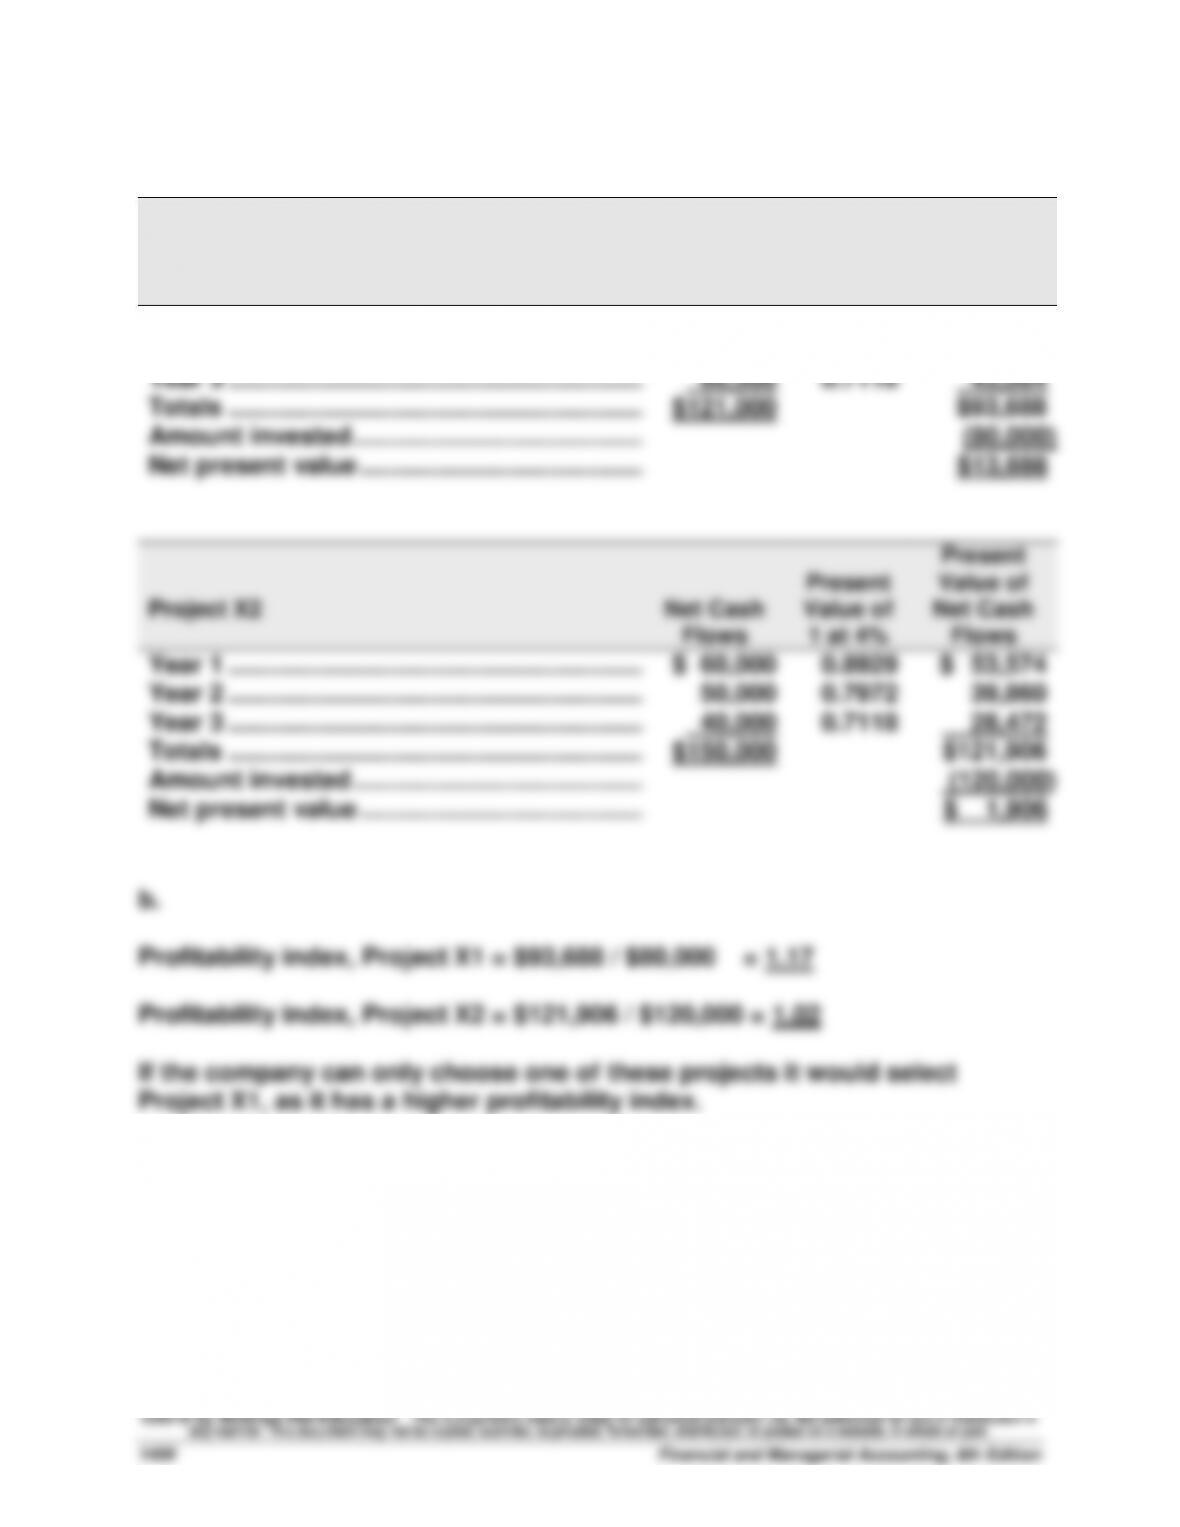
Project X2
Net Cash
Flows
Present
Value of
1 at 4%
Present
Value of
Net Cash
Flows
Year 1 ……………………………………………………….
$ 60,000
0.8929
$ 53,574
Year 2 ……………………………………………………….
50,000
0.7972
39,860
Year 3 ……………………………………………………….
40,000
0.7118
28,472
Totals ……………………………………………………….
$150,000
$121,906
Amount invested …………………………………………..
(120,000)
Net present value …………………………………..……..
$ 1,906
b.
Profitability index, Project X1 = $93,688 / $80,000 = 1.17
Profitability index, Project X2 = $121,906 / $120,000 = 1.02
If the company can only choose one of these projects it would select
Project X1, as it has a higher profitability index.
Exercise 24–13 (20 minutes)
Using Excel, Project X1 (X2) has an internal rate of return of 20.34% (12.99%).
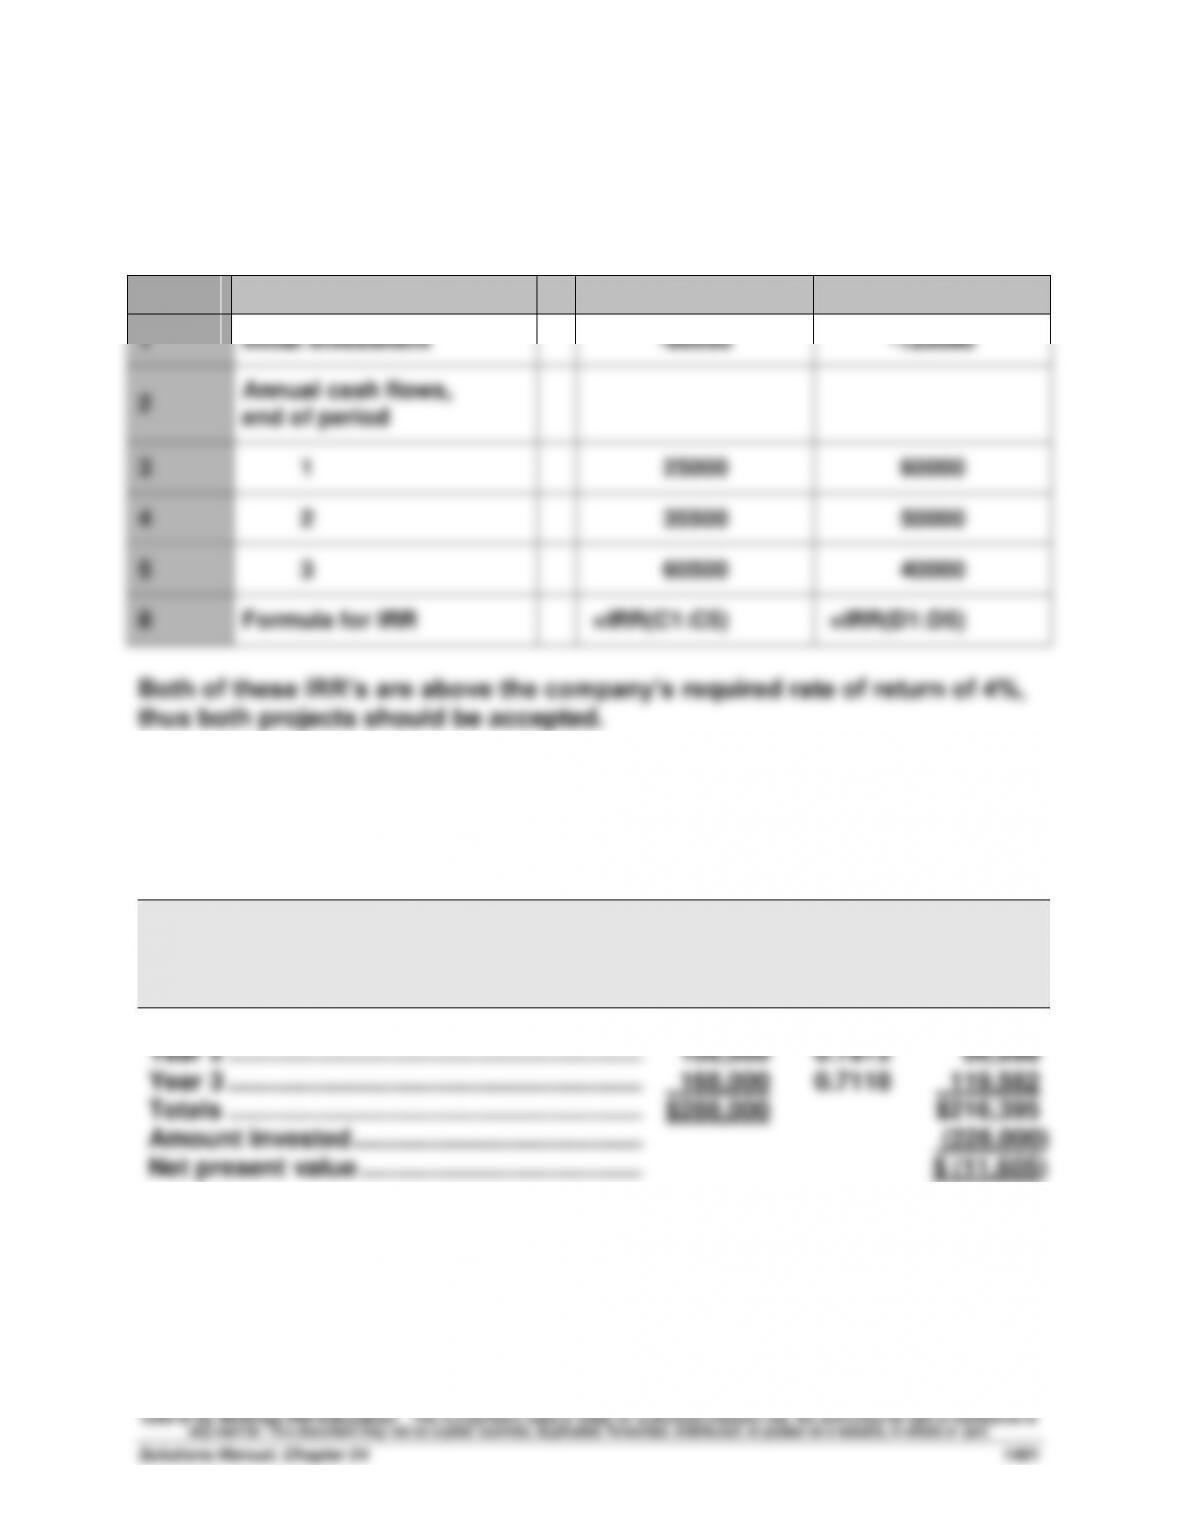
Project X1 Project X2
A
B
C
D
1
Initial investment
-80000
–120000
2
Annual cash flows,
end of period
3
1
25000
60000
4
2
35500
50000
5
3
60500
40000
8
Formula for IRR
=IRR(C1:C5)
=IRR(D1:D5)
Both of these IRR’s are above the company’s required rate of return of 4%,
thus both projects should be accepted.
Exercise 24–14 (35 minutes)
1.
PROJECT C1
Net Cash
Flows
Present
Value of
1 at 12%
Present
Value of
Net Cash
Flows
Year 1 ……………………………………………………….
$ 12,000
0.8929
$ 10,715
Year 2 ……………………………………………………….
108,000
0.7972
86,098
Year 3 ……………………………………………………….
168,000
0.7118
119,582
Totals ……………………………………………………….
$288,000
$216,395
Amount invested …………………………………………..
(228,000)
Net present value …………………………………..……..
$ (11,605)
Exercise 24–14 (continued)
PROJECT C2
Net Cash
Flows
Present
Value of
1 at 12%
Present
Value of
Net Cash
Flows
Year 1 ……………………………………………………….
$ 96,000
0.8929
$ 85,718
Year 2 ……………………………………………………….
96,000
0.7972
76,531
Year 3 ……………………………………………………….
96,000
0.7118
68,333
Totals ……………………………………………………….
$288,000
$230,582
Amount invested …………………………………………..
(228,000)
Net present value …………………………………..……..
$ 2,582
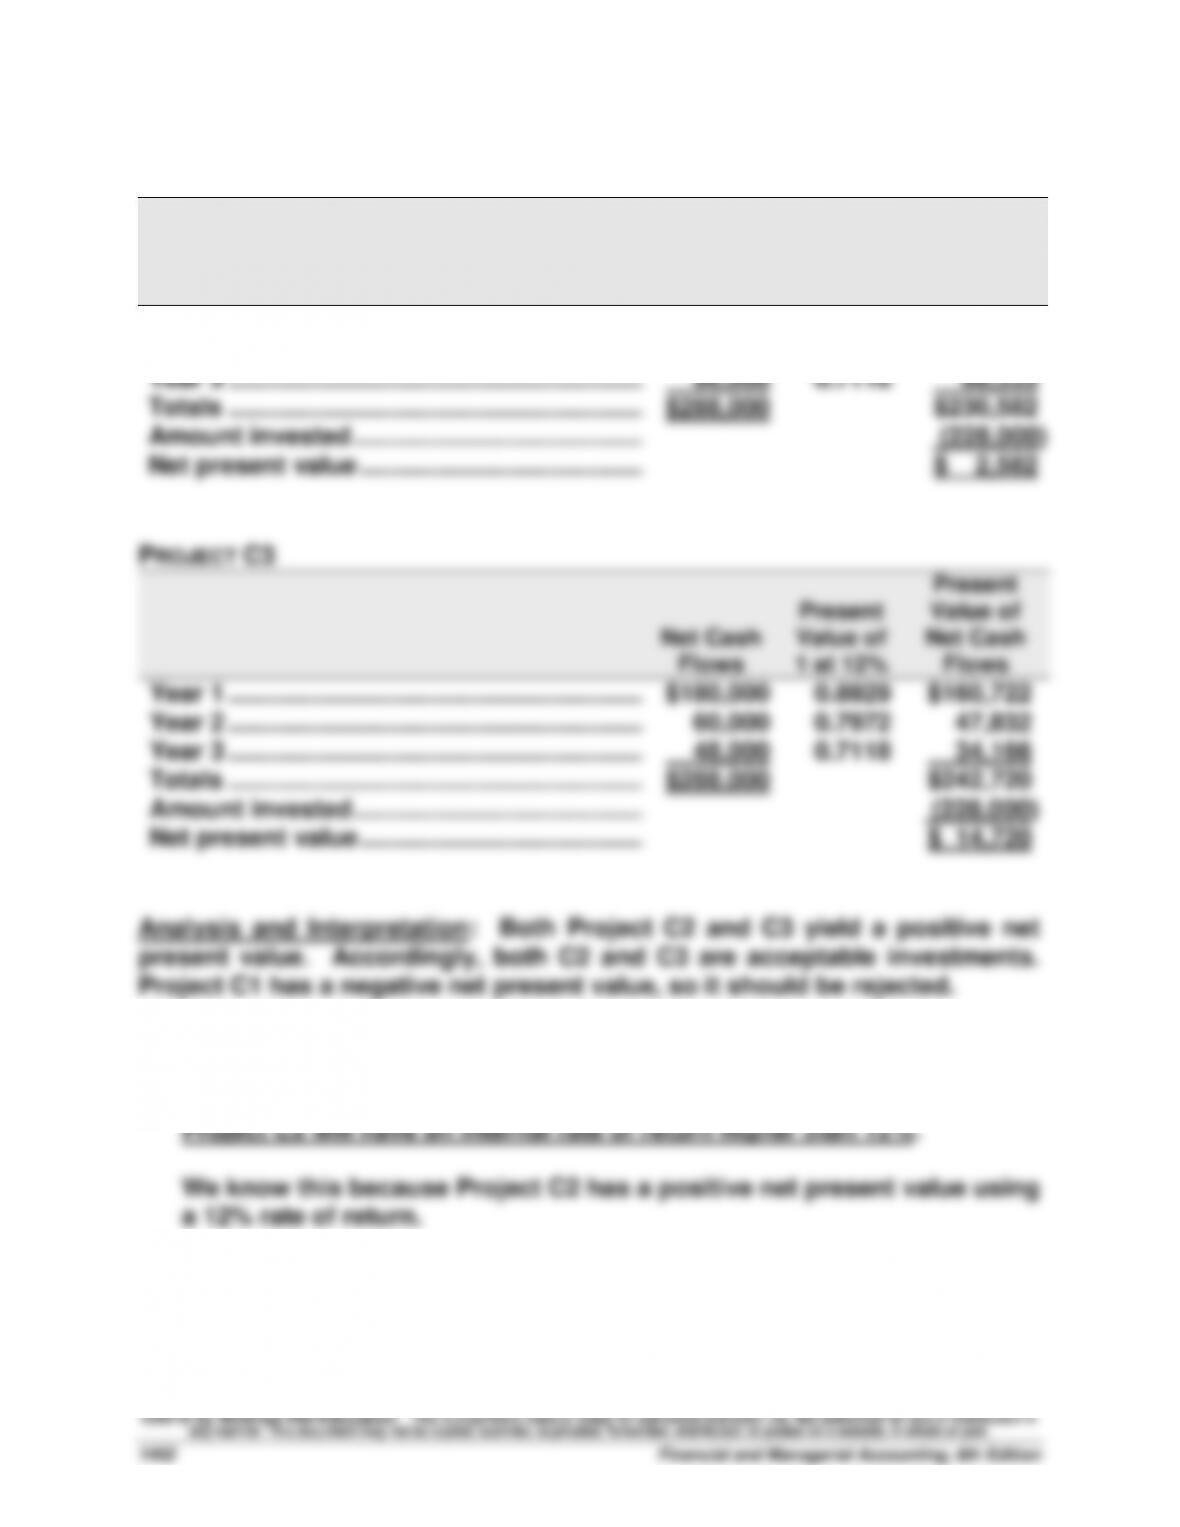
PROJECT C3
Net Cash
Flows
Present
Value of
1 at 12%
Present
Value of
Net Cash
Flows
Year 1 ……………………………………………………….
$180,000
0.8929
$160,722
Year 2 ……………………………………………………….
60,000
0.7972
47,832
Year 3 ……………………………………………………….
48,000
0.7118
34,166
Totals ……………………………………………………….
$288,000
$242,720
Amount invested …………………………………………..
(228,000)
Net present value …………………………………..……..
$ 14,720
Analysis and Interpretation: Both Project C2 and C3 yield a positive net
present value. Accordingly, both C2 and C3 are acceptable investments.
Project C1 has a negative net present value, so it should be rejected.
2. INTERNAL RATE OF RETURN VS. NET PRESENT VALUE FOR C2
Exercise 24–15A (20 minutes)
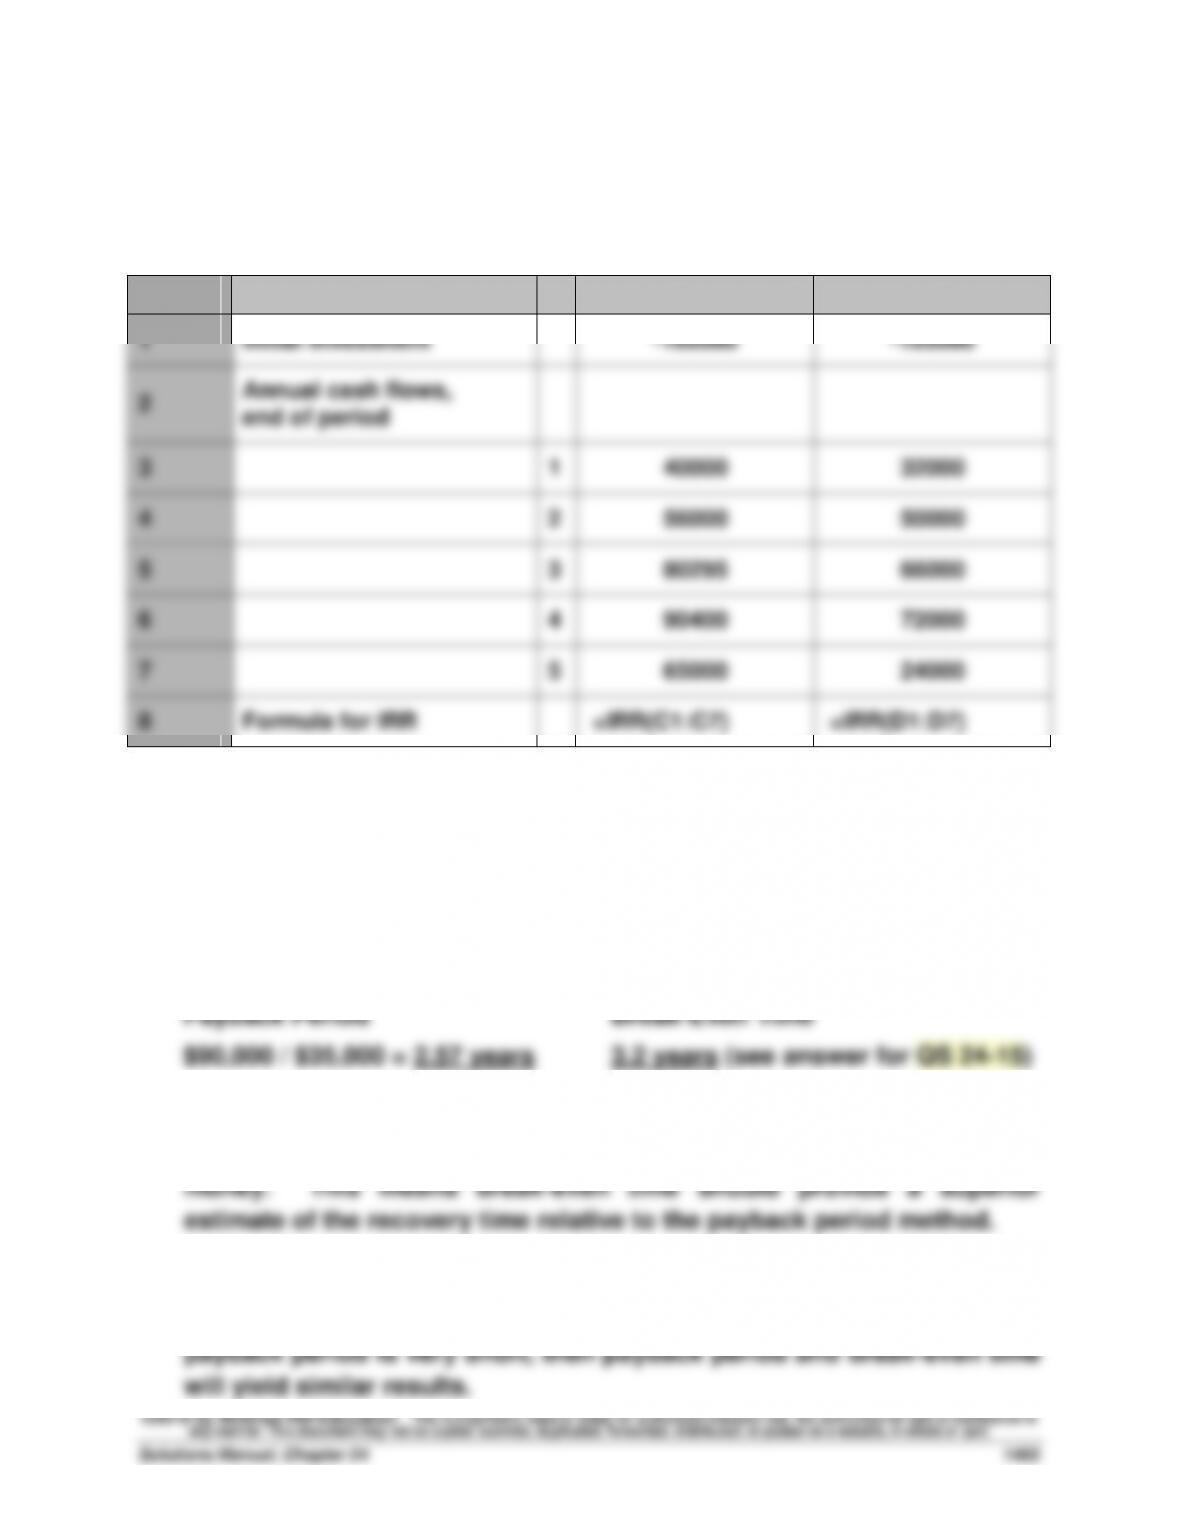
Using Excel, Project A (B) has an internal rate of return of 26.96 (35.00%).
Project A Project B
A
B
C
D
1
Initial investment
-160000
-105000
2
Annual cash flows,
end of period
3
1
40000
32000
4
2
56000
50000
5
3
80295
66000
6
4
90400
72000
7
5
65000
24000
8
Formula for IRR
=IRR(C1:C7)
=IRR(D1:D7)
Exercise 24–16 (15 minutes)
1. Recovery time computation
Payback Period
Break-Even Time
$90,000 / $35,000 = 2.57 years
3.2 years (see answer for QS 24–15)
2. The advantage of break-even time is that it considers the time value of
3. When (1) the interest rate is very low, 1% for example, and (2) the
©2016 by McGraw–Hill Education. This is proprietary material solely for authorized instructor use. Not authorized for sale or distribution in
any manner. This document may not be copied, scanned, duplicated, forwarded, distributed, or posted on a website, in whole or part.
Financial and Managerial Accounting, 6th Edition
1404
PROBLEM SET A
Problem 24-1A (50 minutes)
Part 1
Annual straight-line depreciation = = $115,000
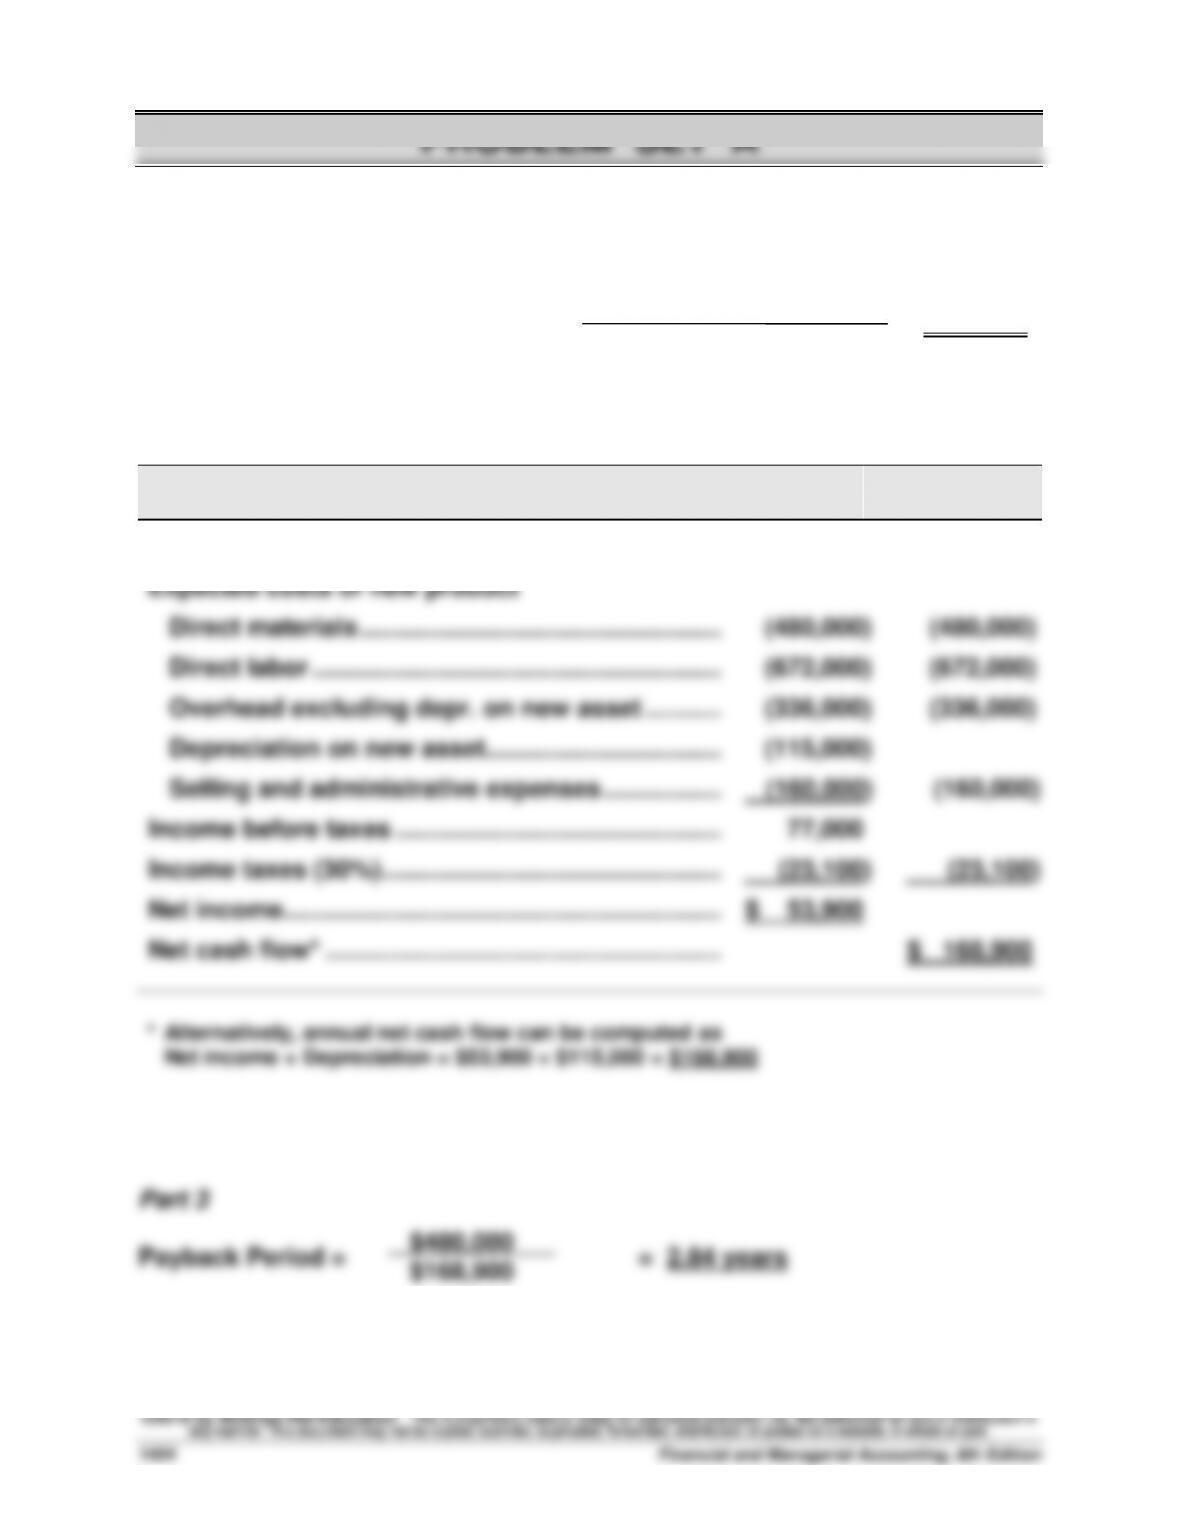
Part 2
Net
Net Cash
Income
Flow
Expected annual sales of new product ……………...
$1,840,000
$1,840,000
Expected costs of new product
Direct materials ……………………………………………...
(480,000)
(480,000)
Direct labor …………………………..………………………..
(672,000)
(672,000)
Overhead excluding depr. on new asset ………....
(336,000)
(336,000)
Depreciation on new asset……………………………...
(115,000)
Selling and administrative expenses ……………....
(160,000)
(160,000)
Income before taxes ………………………………………....
77,000
Income taxes (30%)…………………………………………...
(23,100)
(23,100)
Net income ……………………………………………………….
$ 53,900
Net cash flow* …………………………………………………..
$ 168,900
* Alternatively, annual net cash flow can be computed as
Net income + Depreciation = $53,900 + $115,000 = $168,900
Part 3
Payback Period = = 2.84 years
$480,000 – $20,000
4 years
$480,000
$168,900