Unlock document.
This document is partially blurred.
Unlock all pages and 1 million more documents.
Get Access
Exercise 22-11 (20 minutes)
(1)
Investment center
Operating
income
Average assets*
Return on
investment
Beverage .......................
$349
$2,628
13.28%
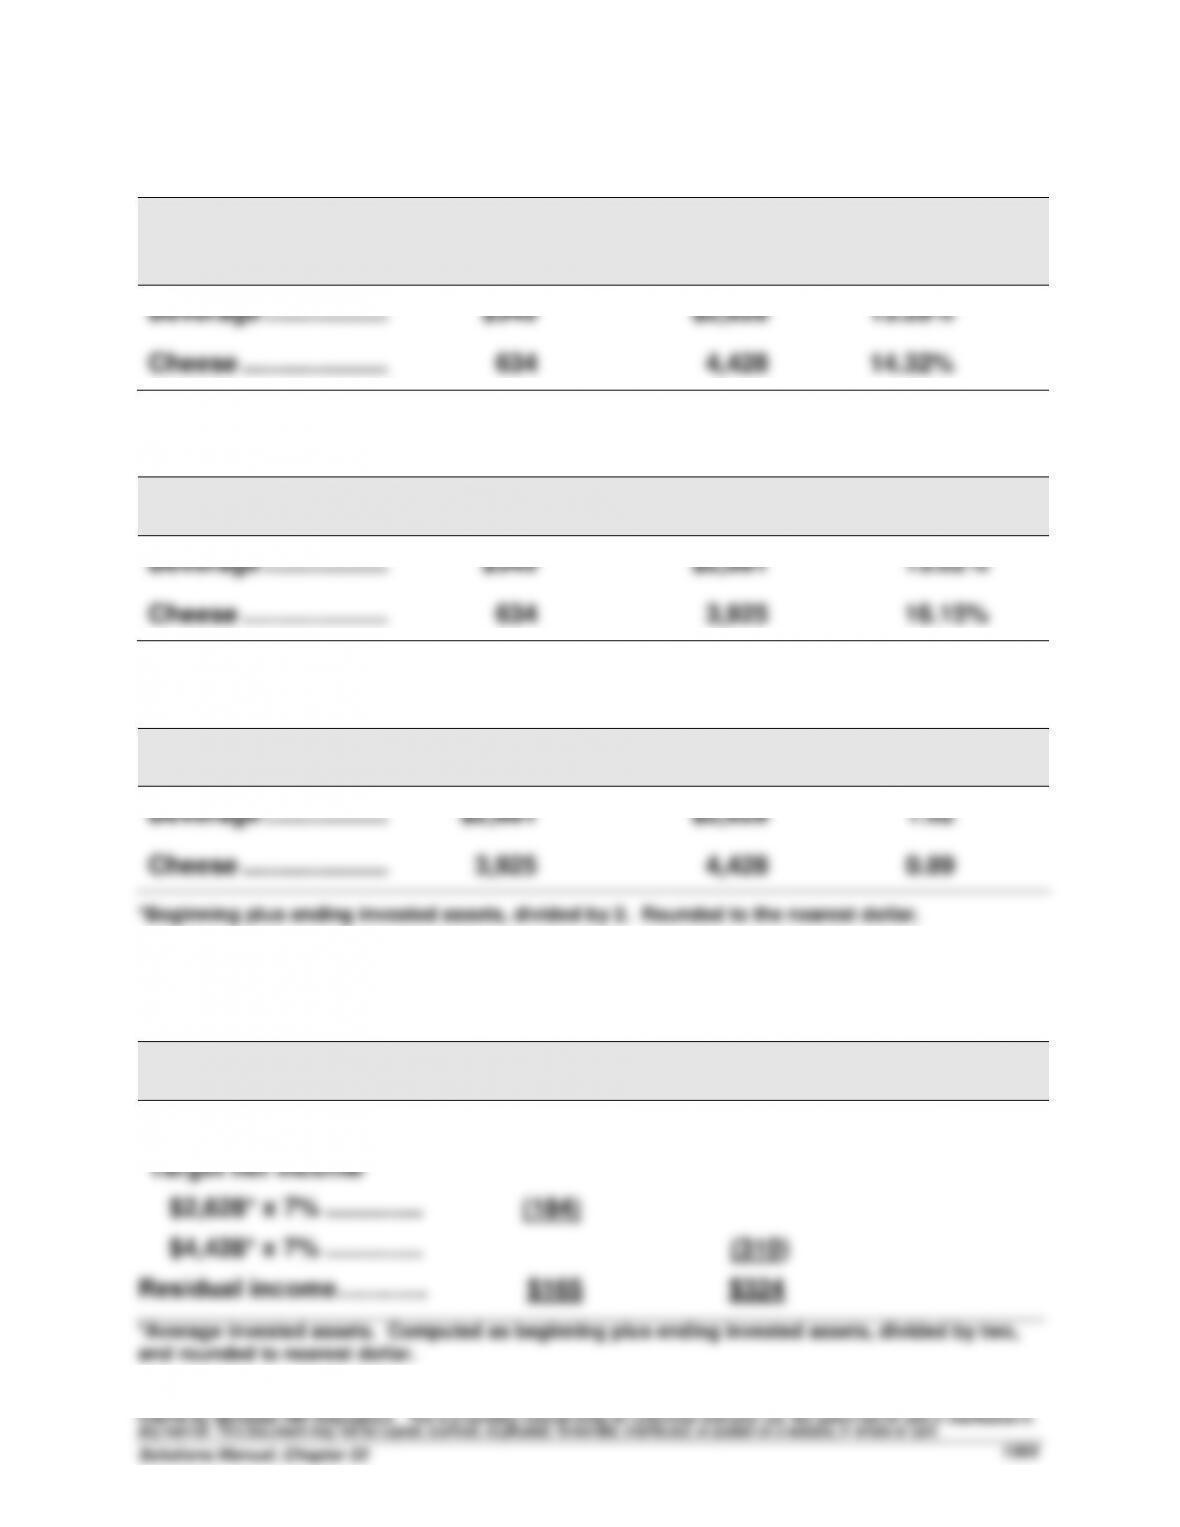
Cheese ..........................
634
4,428
14.32%
(2)
Investment center
Operating
income
Sales
Profit margin
Beverage .......................
$349
$2,681
13.02%
Cheese ..........................
634
3,925
16.15%
(3)
Investment center
Sales
Average assets*
Investment
turnover
Beverage .......................
$2,681
$2,628
1.02
Cheese ..........................
3,925
4,428
0.89
*Beginning plus ending invested assets, divided by 2. Rounded to the nearest dollar.
Exercise 22-12 (10 minutes)
($ millions)
Beverage
Cheese
Operating income ........
$349
$634
Target net income
$2,628* x 7% ..............
$4,428* x 7% ..............
(184)
(310)
Residual income…….…. $165 $324
*Average invested assets. Computed as beginning plus ending invested assets, divided by two,
and rounded to nearest dollar.
Exercise 22-13 (15 minutes)
Investment center
Operating
income
Sales
Profit margin
Americas .......................
$22,817
$62,739
36.4%
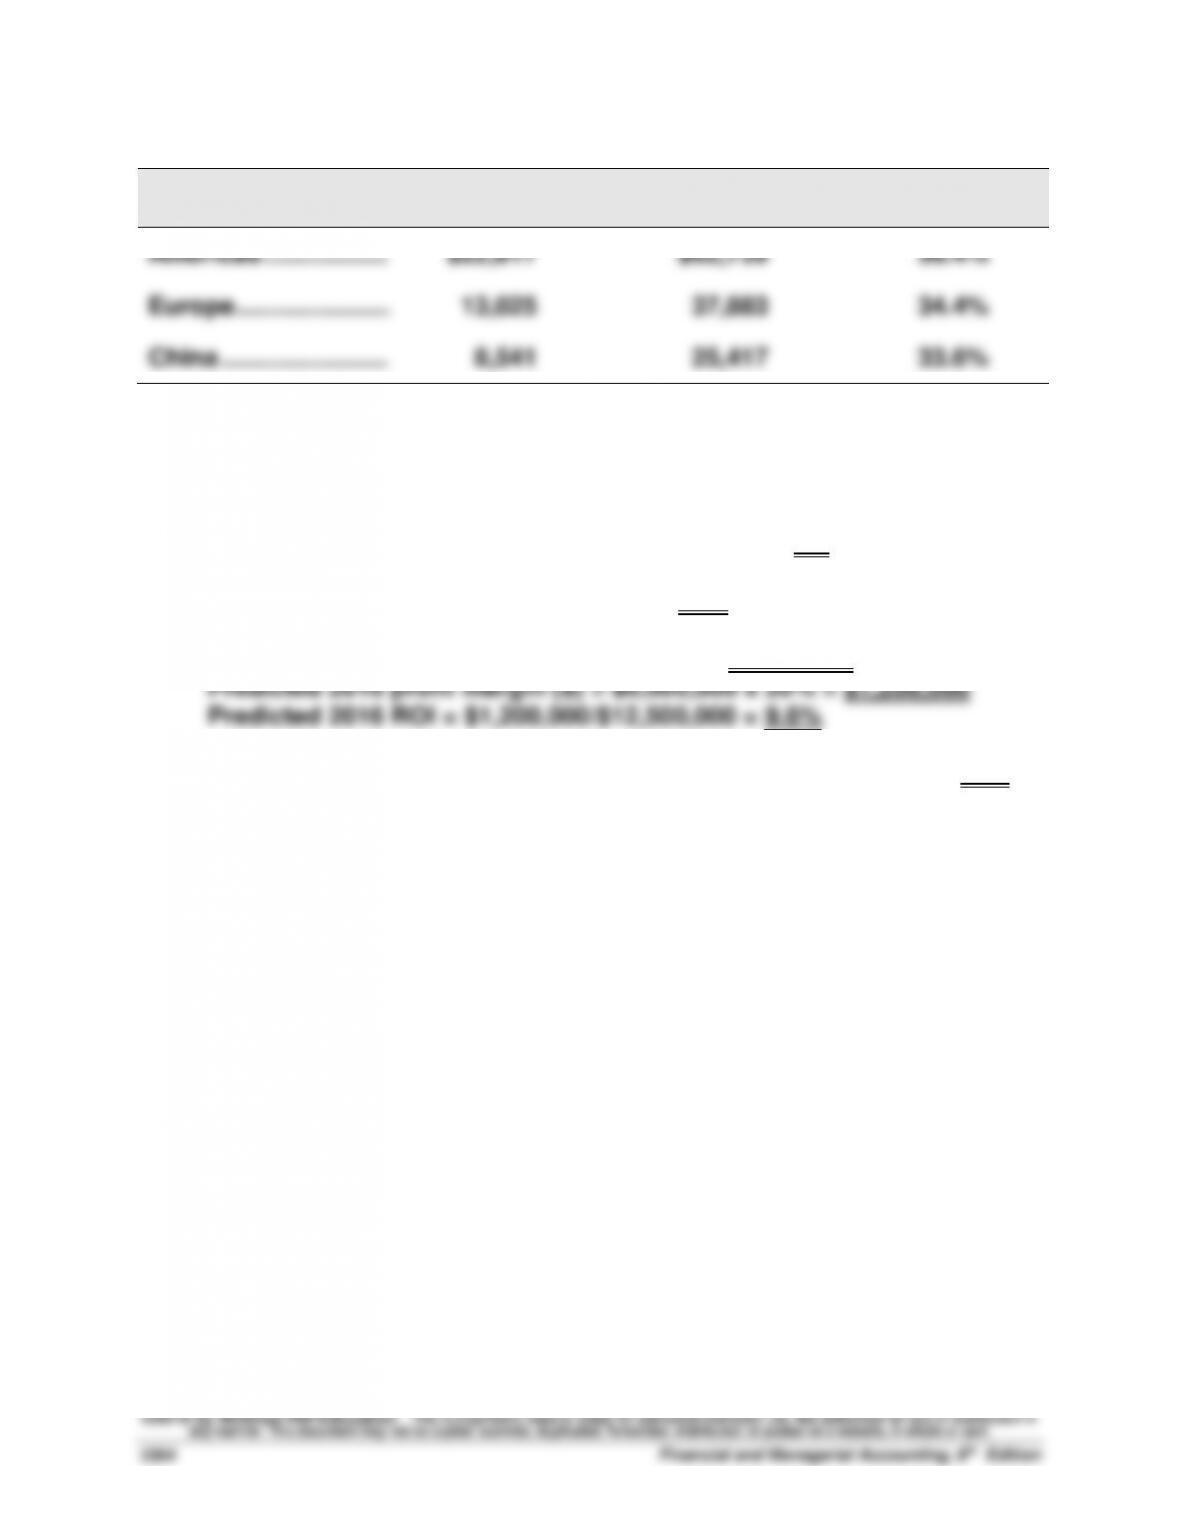
Europe ...........................
13,025
37,883
34.4%
China .............................
8,541
25,417
33.6%
Exercise 22-14 (20 minutes)
1. Return on investment = $1,000,000/$12,500,000 = 8%
2. Profit margin = $1,000,000/$5,000,000 = 20%
3. Predicted 2016 sales = $5,000,000 x 120% = $6,000,000
4. Predicted 2016 investment turnover = $6,000,000/$12,500,000 = 0.48
Exercise 22-15 (20 minutes)
1. F 8. P
2. C 9. C
3. C 10. I
4. C 11. P
5. I 12. P
6. F 13. F
7. F 14. F
Exercise 22-16 (15 minutes)
Part 1
Process time ..............................................................................
6.0 days
Inspection time ..........................................................................
0.8 days
Move time ...................................................................................
3.2 days
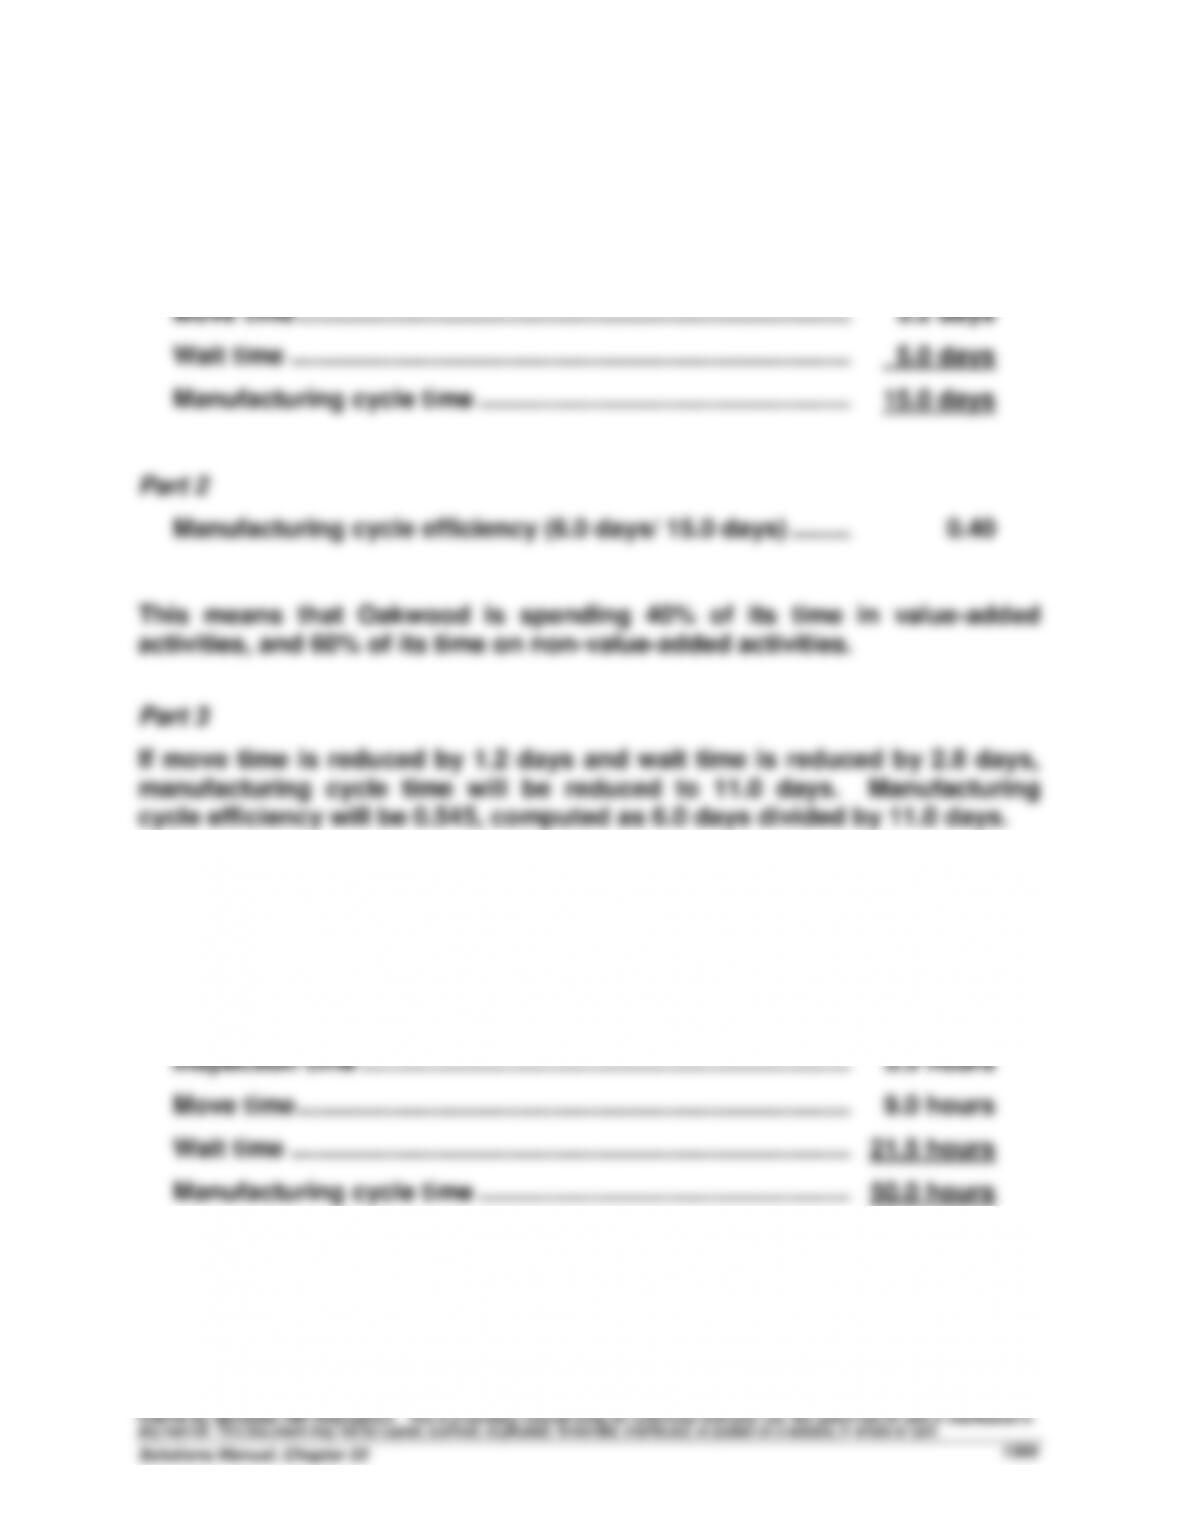
Wait time ....................................................................................
5.0 days
Manufacturing cycle time .........................................................
15.0 days
Part 2
Manufacturing cycle efficiency (6.0 days/ 15.0 days) ............
0.40
This means that Oakwood is spending 40% of its time in value-added
activities, and 60% of its time on non-value-added activities.
Part 3
If move time is reduced by 1.2 days and wait time is reduced by 2.8 days,
manufacturing cycle time will be reduced to 11.0 days. Manufacturing
cycle efficiency will be 0.545, computed as 6.0 days divided by 11.0 days.
Exercise 22-17 (15 minutes)
Part 1
Process time ..............................................................................
16.0 hours
Inspection time ..........................................................................
3.5 hours
Move time ...................................................................................
9.0 hours
Wait time ....................................................................................
21.5 hours
Manufacturing cycle time .........................................................
50.0 hours
Exercise 22-17 (continued)
Part 2
Manufacturing cycle efficiency (16.0 hours/ 50.0 hours) ......
0.32
This means that Best Ink is spending 32% of its time in value-added
Exercise 22-18A (15 minutes)
1. If the trailer division is currently operating at full capacity, its manager
2. If the trailer division is currently producing 20,000 trailers and the
assembly division will order 15,000 more trailers, the Trailer division will
Exercise 22-18A (continued)
3. The trailer division would prefer a transfer price of $140 per trailer, since
it provides a $60 ($140 - $80) contribution margin per trailer. At a transfer
price of $80 the trailer division reports a contribution margin of $0 per
Exercise 22-19B (20 minutes)
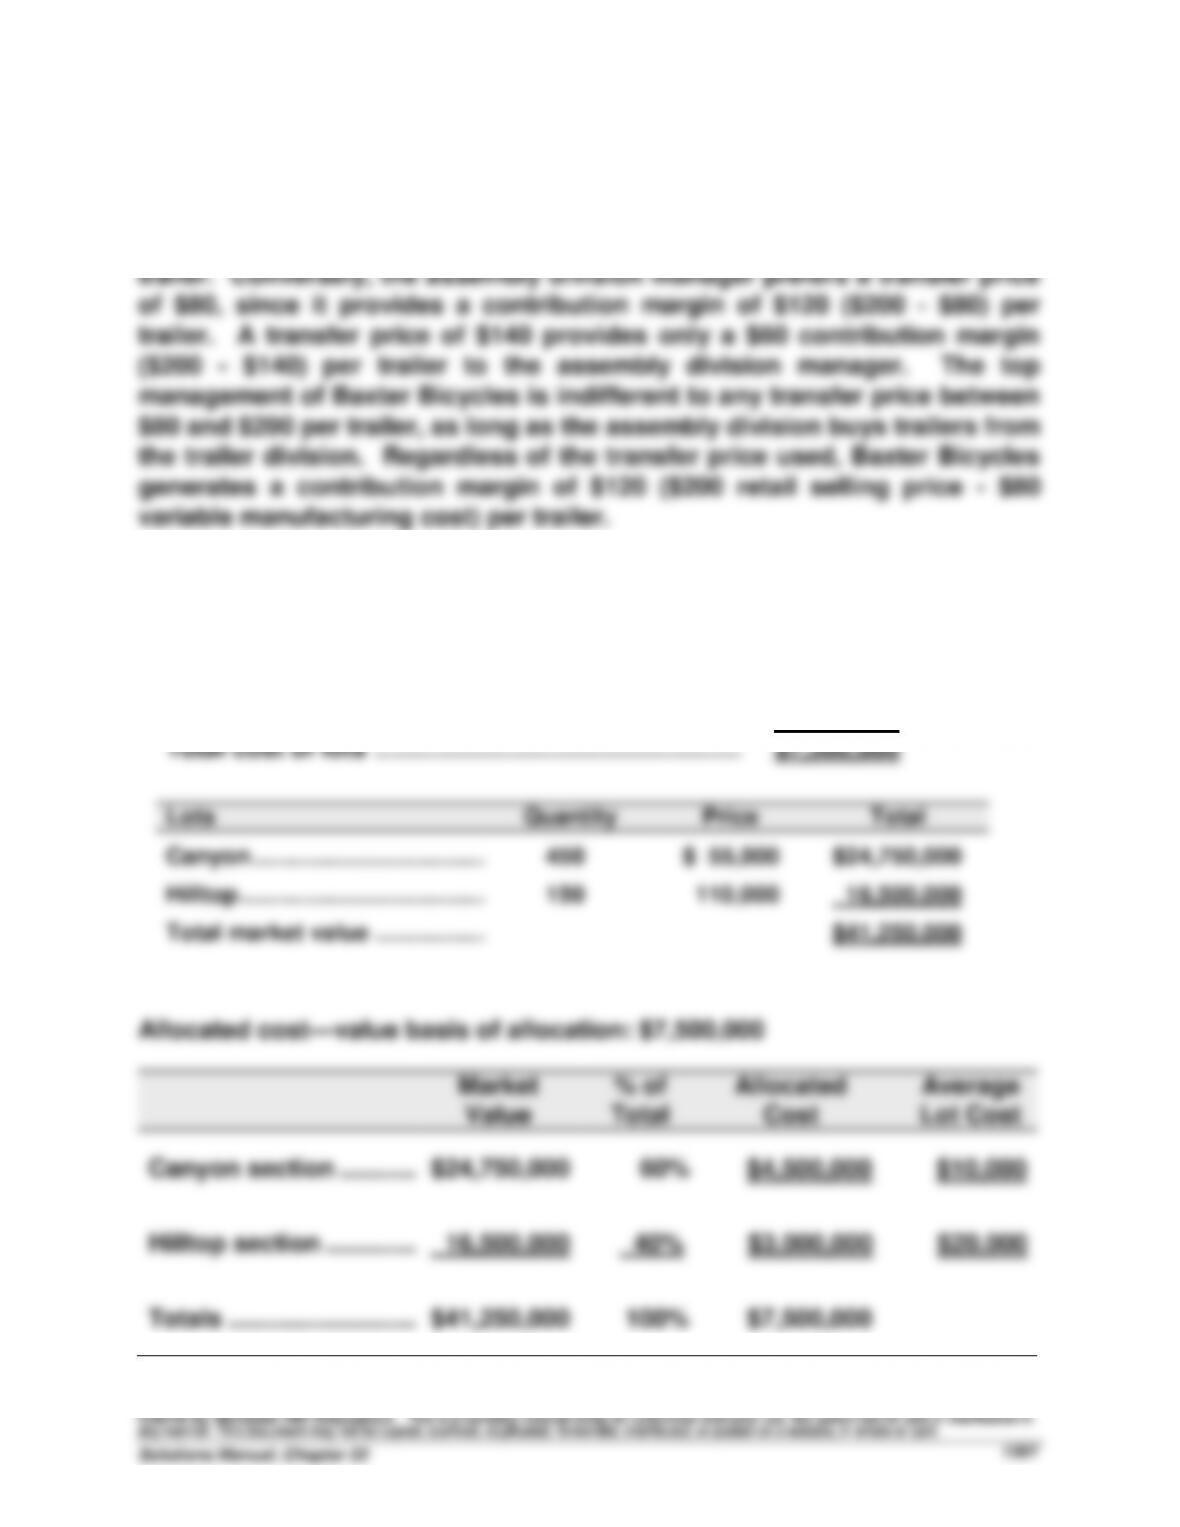
Preliminary calculations
Land cost ................................................................
$4,000,000
Improvements ................................................................
3,500,000
Total cost of lots ............................................................
$7,500,000
Exercise 22-20B (25 minutes)
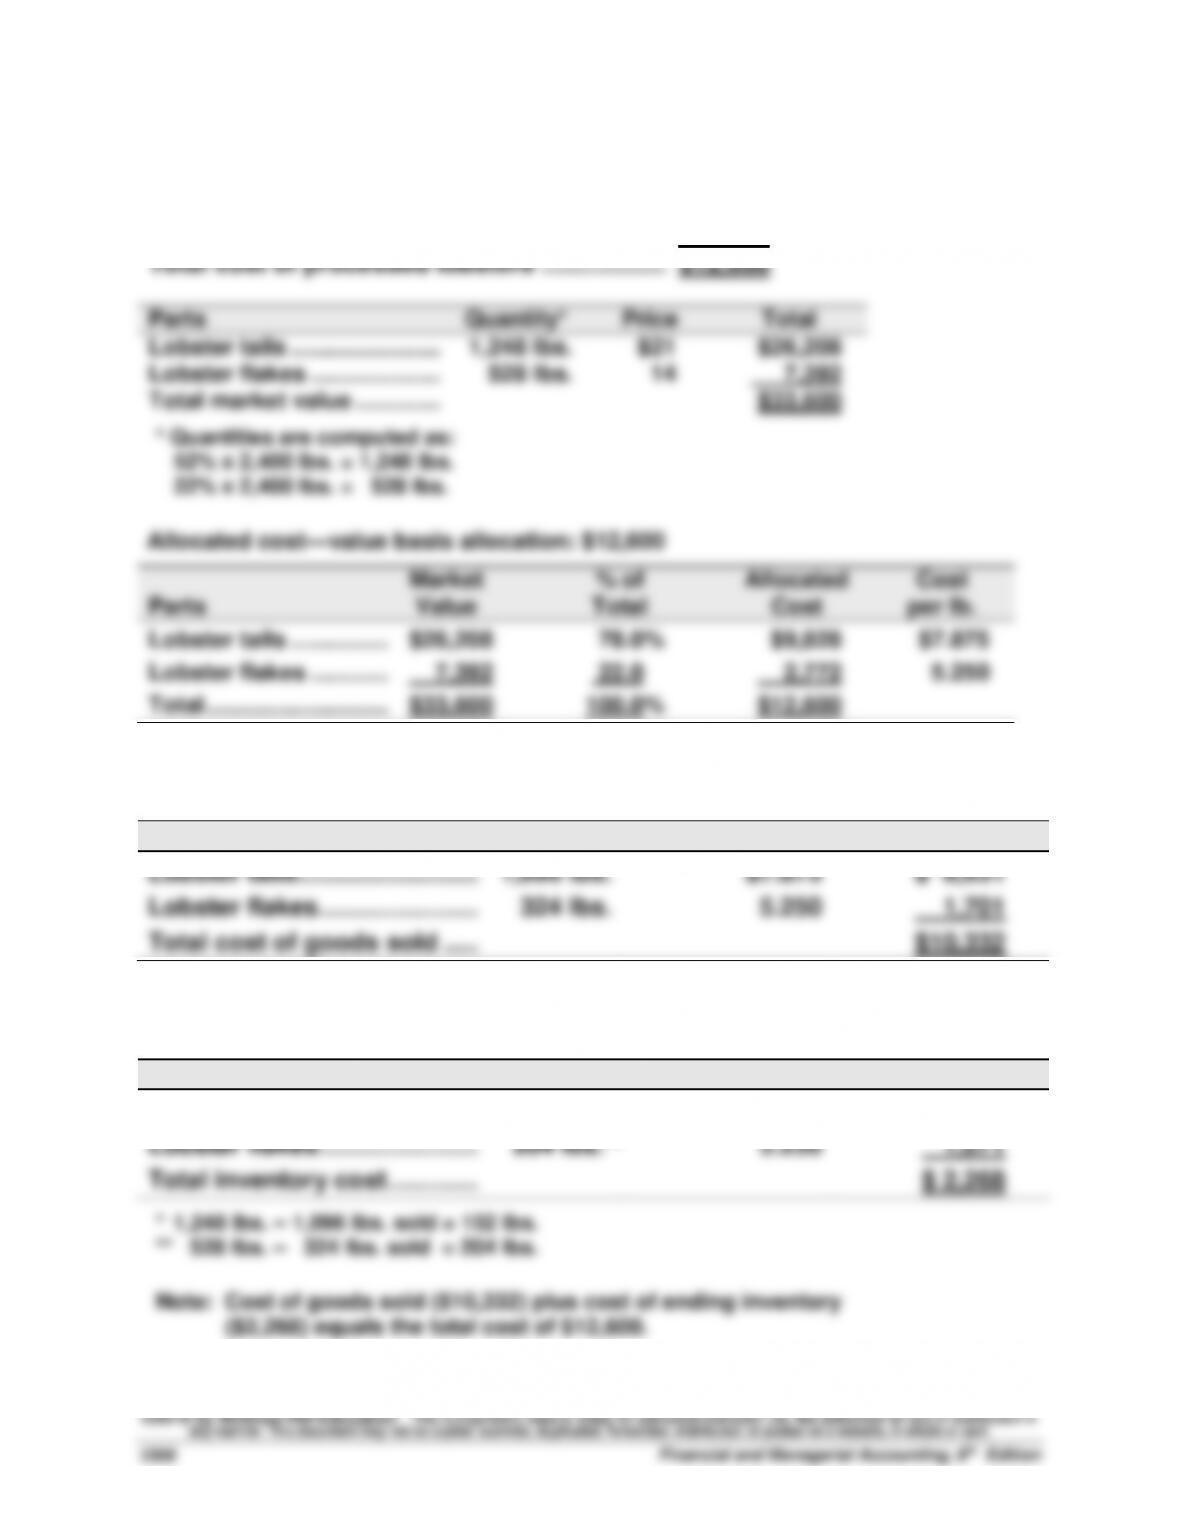
Preliminary calculations
Lobster cost (2,400 lbs. x $4.50) ......................
$10,800
Labor cost ..........................................................
1,800
Total cost of processed lobsters ....................
$12,600
Exercise 22-21 (20 minutes)
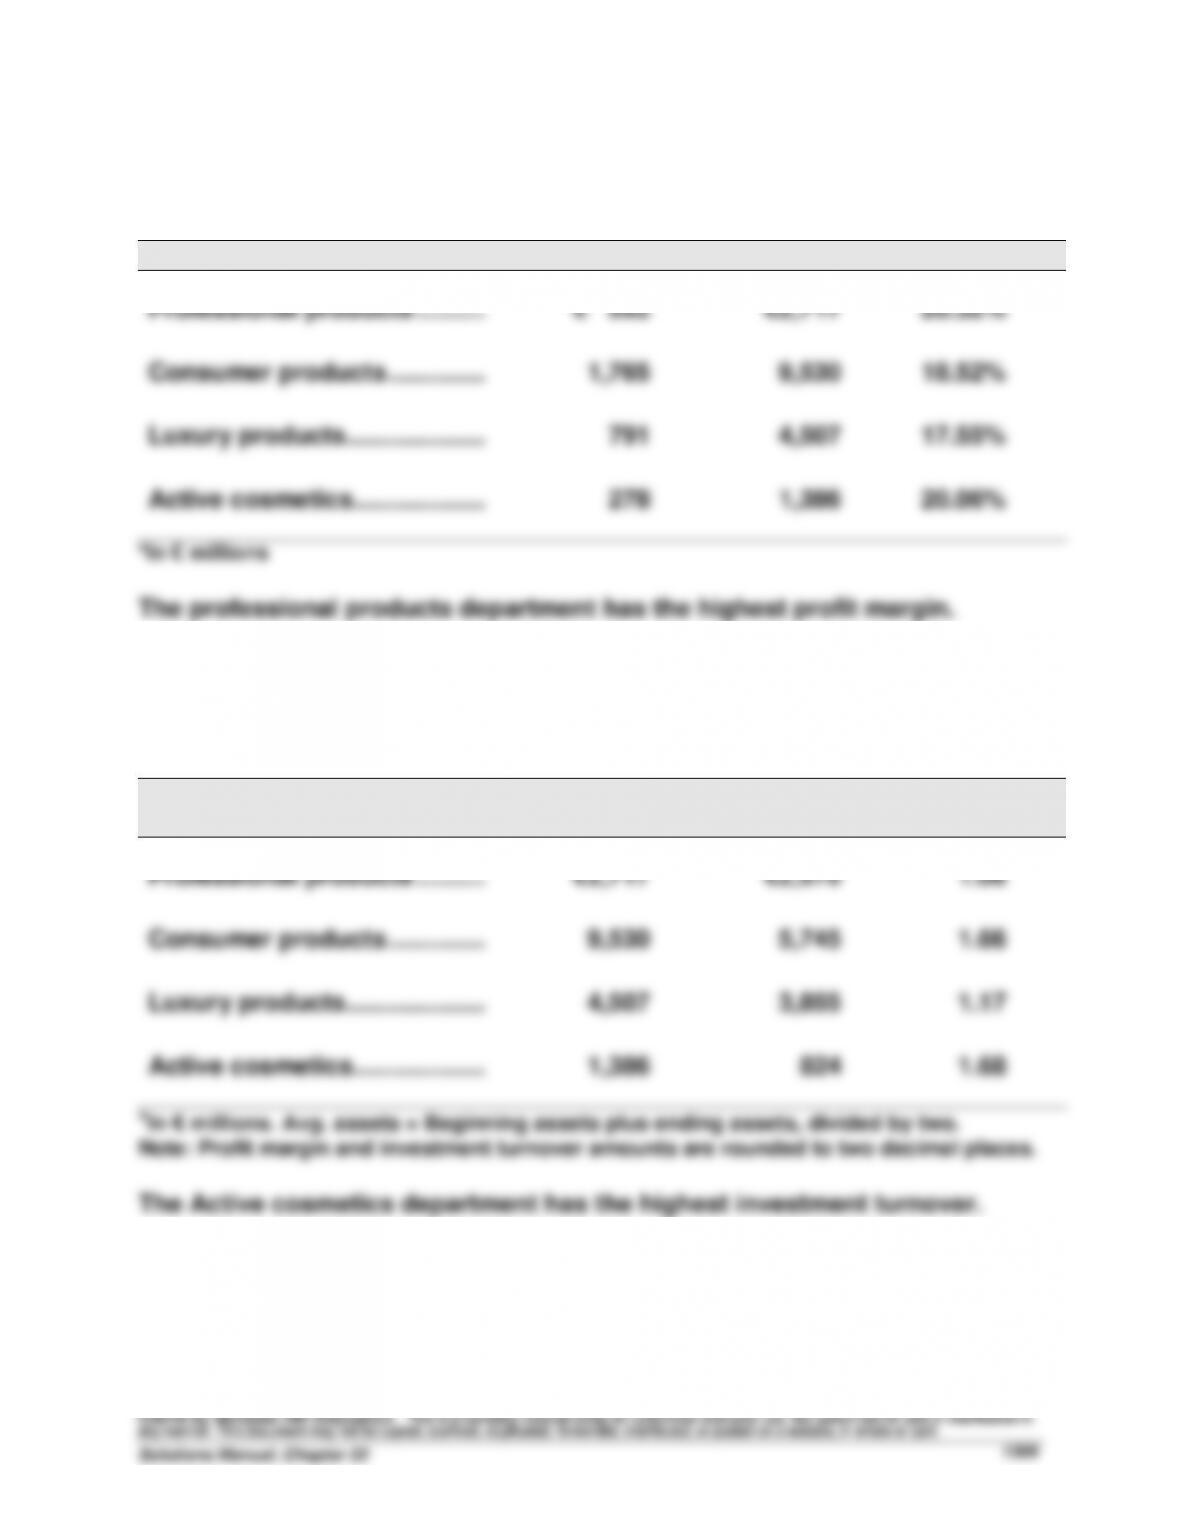
(1) Profit margin = Income/Sales
Investment center
Income*
Sales*
Profit margin
Professional products ..........
€ 552
€2,717
20.32%
Consumer products ..............
1,765
9,530
18.52%
Luxury products ....................
791
4,507
17.55%
Active cosmetics...................
278
1,386
20.06%
*In € millions
The professional products department has the highest profit margin.
(2) Investment turnover = Sales/Average invested assets
Investment center
Sales*
Avg. assets*
Investment
turnover
Professional products ..........
€2,717
€2,570
1.06
Consumer products ..............
9,530
5,745
1.66
Luxury products ....................
4,507
3,855
1.17
Active cosmetics...................
1,386
824
1.68
*In € millions. Avg. assets = Beginning assets plus ending assets, divided by two.
Note: Profit margin and investment turnover amounts are rounded to two decimal places.
The Active cosmetics department has the highest investment turnover.
Problem 22-1A (50 minutes)
Part 1
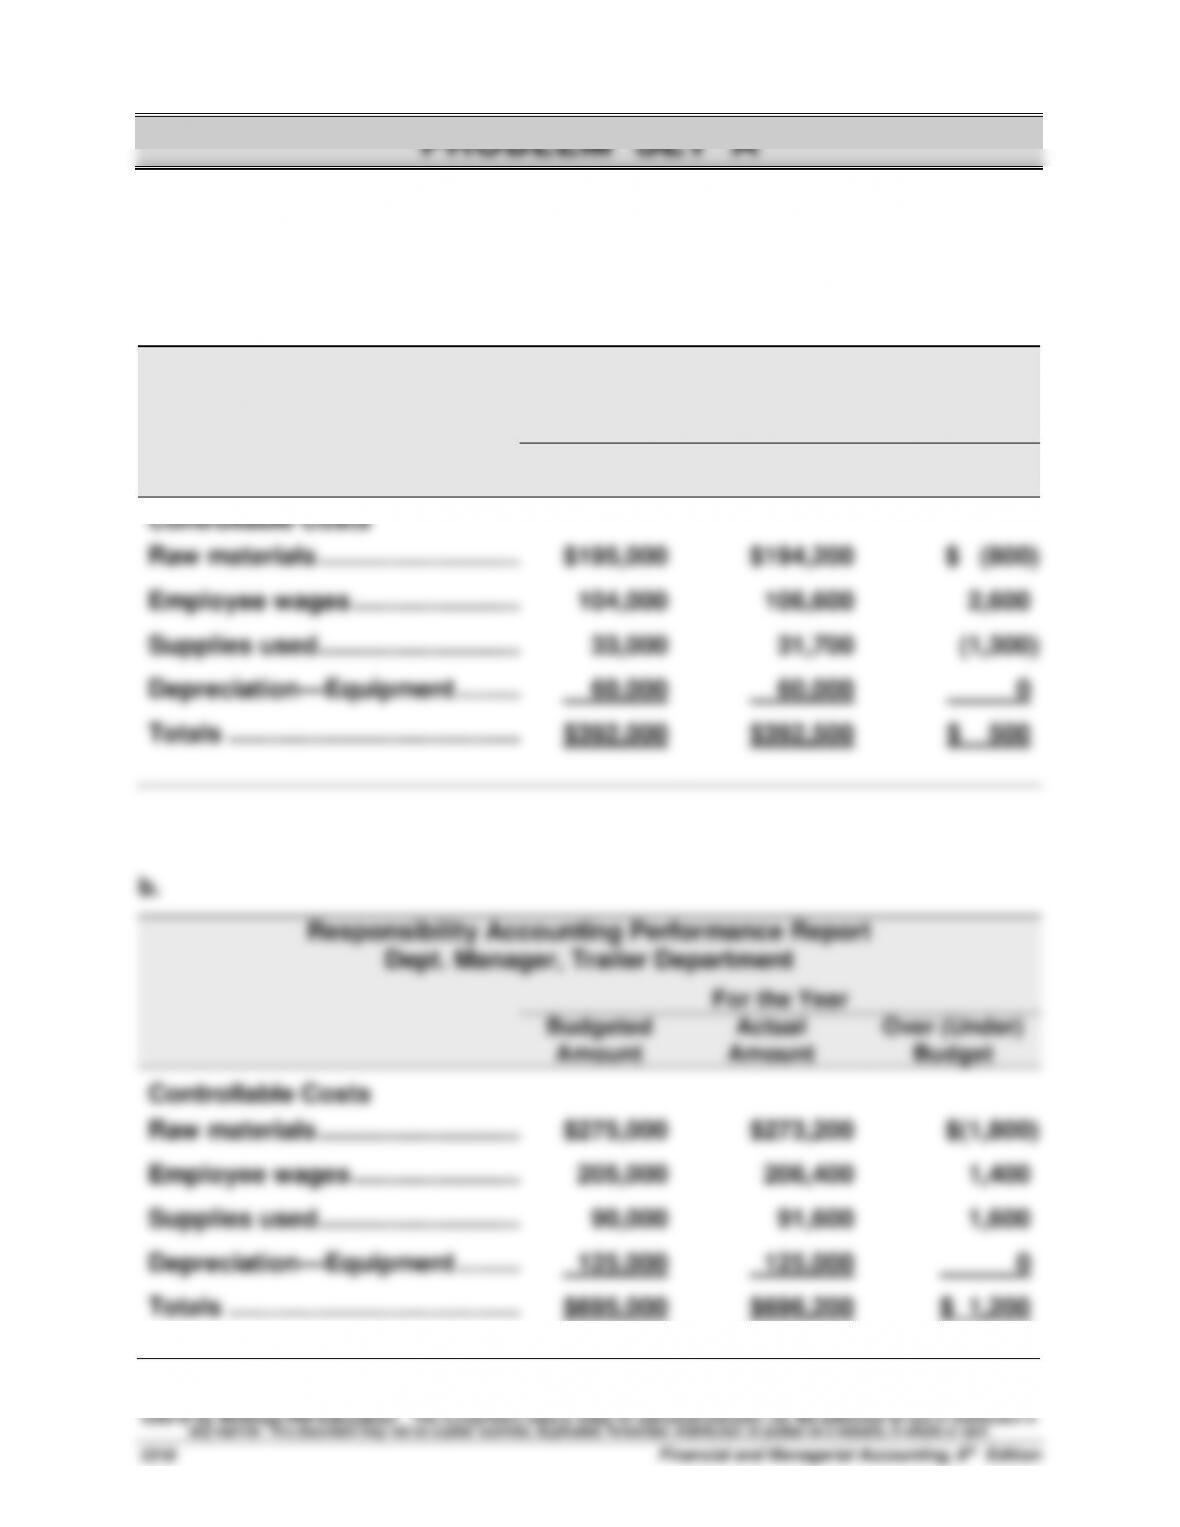
a.
Responsibility Accounting Performance Report
Dept. Manager, Camper Department
For the Year
Budgeted
Actual
Over (Under)
Amount
Amount
Budget
Controllable Costs
Raw materials ................................
$195,000
$194,200
$ (800)
Employee wages ..............................
104,000
106,600
2,600
Supplies used ................................
33,000
31,700
(1,300)
Depreciation—Equipment ...............
60,000
60,000
0
Totals ................................................
$392,000
$392,500
$ 500
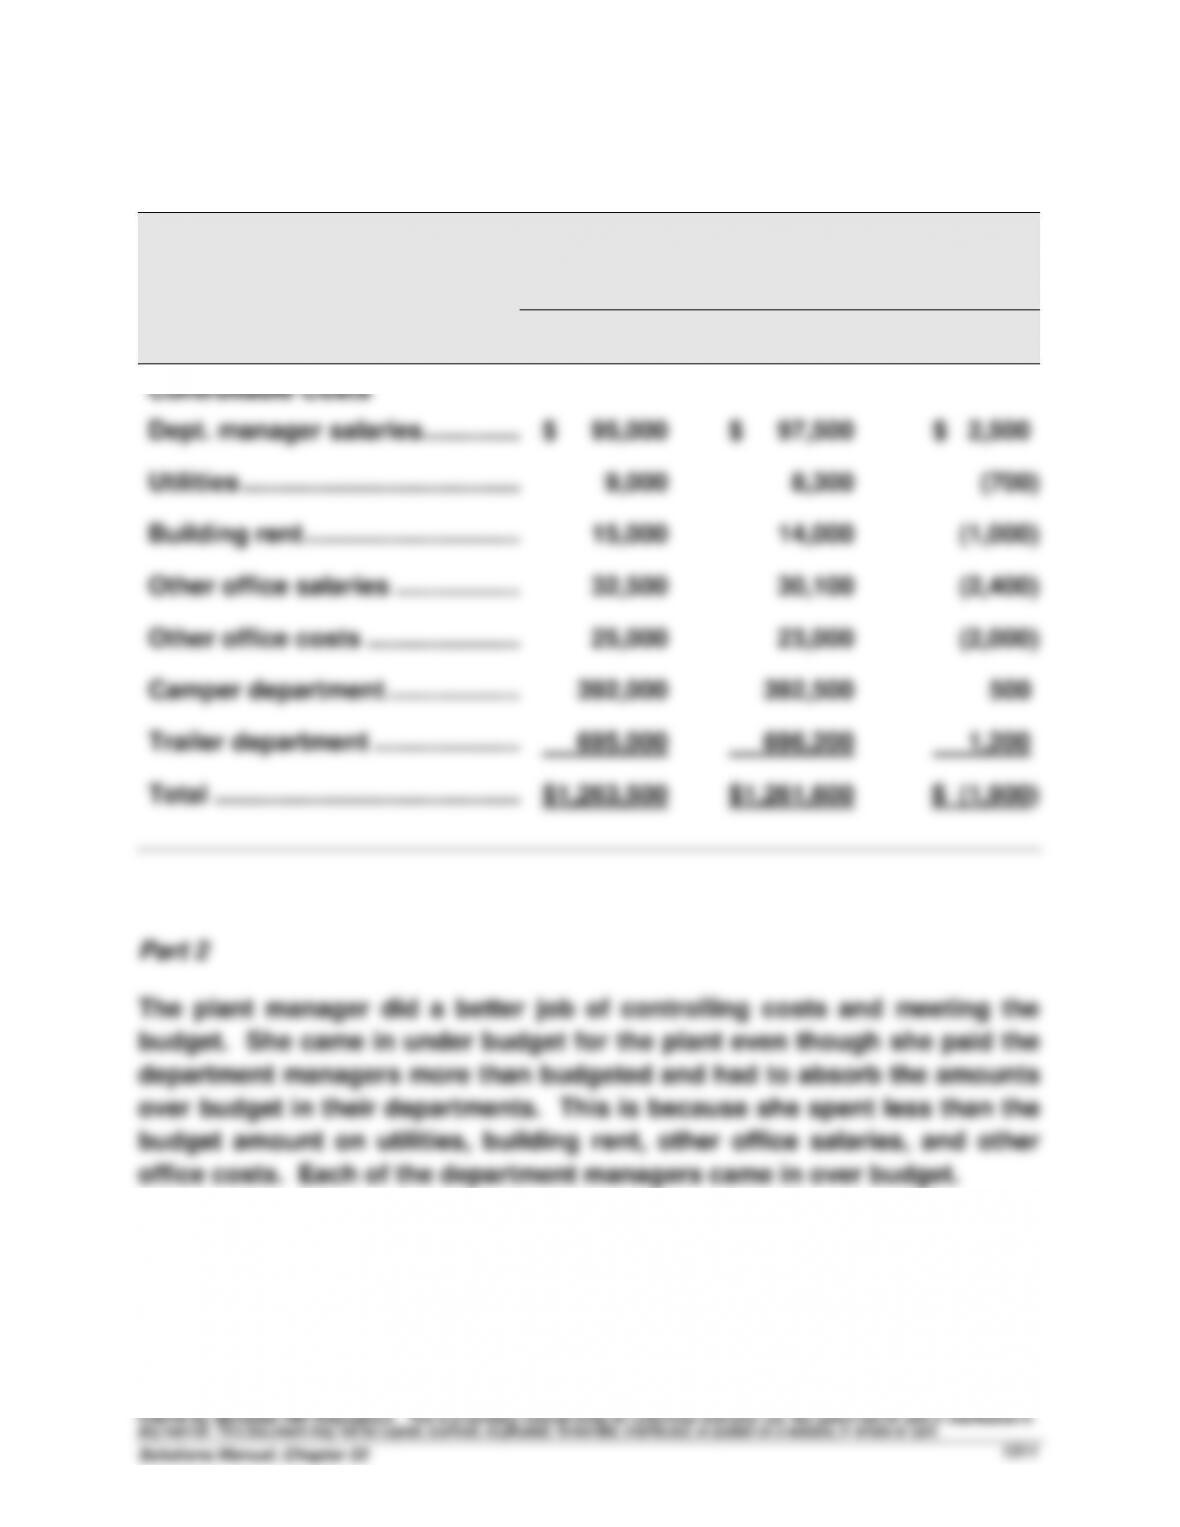
Problem 22-1A (Continued)
c.
Responsibility Accounting Performance Report
Plant Manager, Indiana Plant
For the Year
Budgeted
Actual
Over (Under)
Amount
Amount
Budget
Controllable Costs
Dept. manager salaries.................
$ 95,000
$ 97,500
$ 2,500
Utilities ...........................................
9,000
8,300
(700)
Building rent ................................
15,000
14,000
(1,000)
Other office salaries .....................
32,500
30,100
(2,400)
Other office costs .........................
25,000
23,000
(2,000)
Camper department ......................
392,000
392,500
500
Trailer department ........................
695,000
696,200
1,200
Total ...............................................
$1,263,500
$1,261,600
$ (1,900)
Part 2
The plant manager did a better job of controlling costs and meeting the
budget. She came in under budget for the plant even though she paid the
department managers more than budgeted and had to absorb the amounts
over budget in their departments. This is because she spent less than the
budget amount on utilities, building rent, other office salaries, and other
office costs. Each of the department managers came in over budget.
Problem 22-2A (60 minutes)
Part 1
Average occupancy cost = $66,000 / 8,000 sq. ft. = $8.25 per sq. ft.
These costs are assigned to the two departments as follows
Department
Square Footage
Rate
Total
Linder’s Dept. ...............
1,000
$8.25
$ 8,250
Chiro’s Dept. .................
1,800
8.25
$14,850
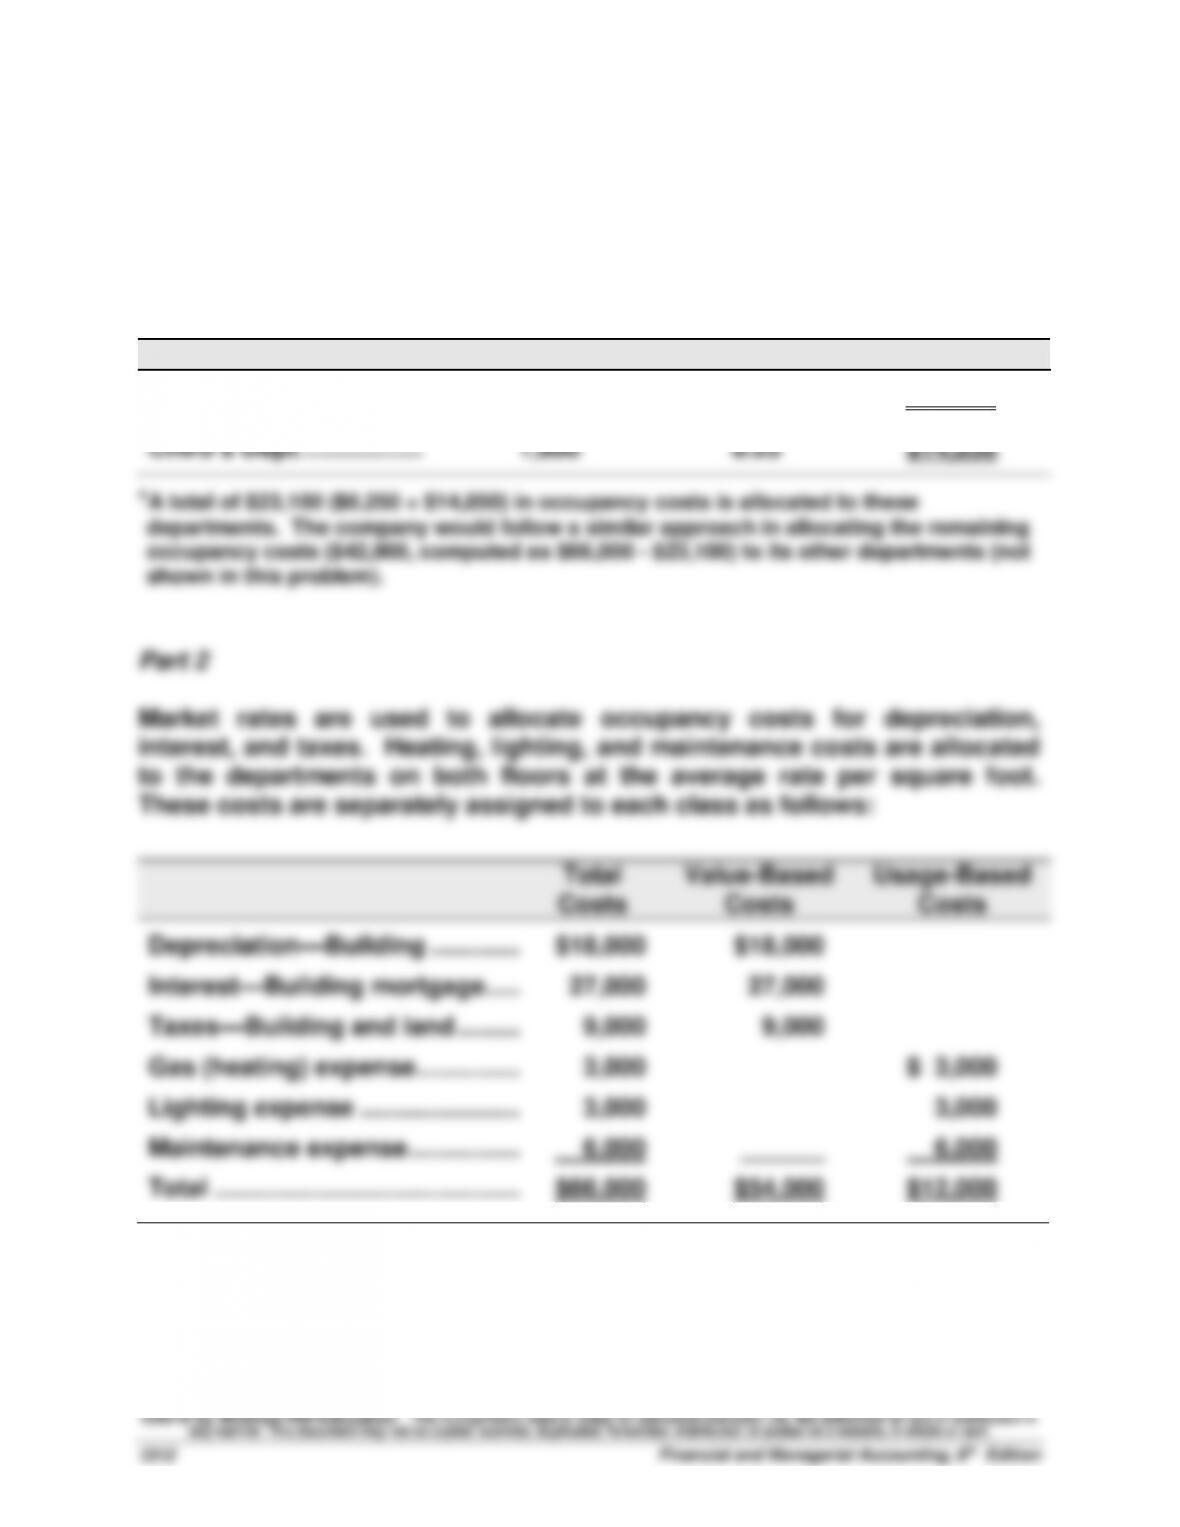
*A total of $23,100 ($8,250 + $14,850) in occupancy costs is allocated to these
departments. The company would follow a similar approach in allocating the remaining
occupancy costs ($42,900, computed as $66,000 - $23,100) to its other departments (not
shown in this problem).
Part 2
Market rates are used to allocate occupancy costs for depreciation,
interest, and taxes. Heating, lighting, and maintenance costs are allocated
to the departments on both floors at the average rate per square foot.
These costs are separately assigned to each class as follows:
Total
Costs
Value-Based
Costs
Usage-Based
Costs
Depreciation—Building ...................
$18,000
$18,000
Interest—Building mortgage...........
27,000
27,000
Taxes—Building and land ...............
9,000
9,000
Gas (heating) expense.....................
3,000
$ 3,000
Lighting expense .............................
3,000
3,000
Maintenance expense ......................
6,000
______
6,000
Total ..................................................
$66,000
$54,000
$12,000


