Quick Study 22–19 (5 minutes)
Average invested assets = (€12,888 + €13,099) / 2
EXERCISES
Exercise 22-1 (30 minutes)
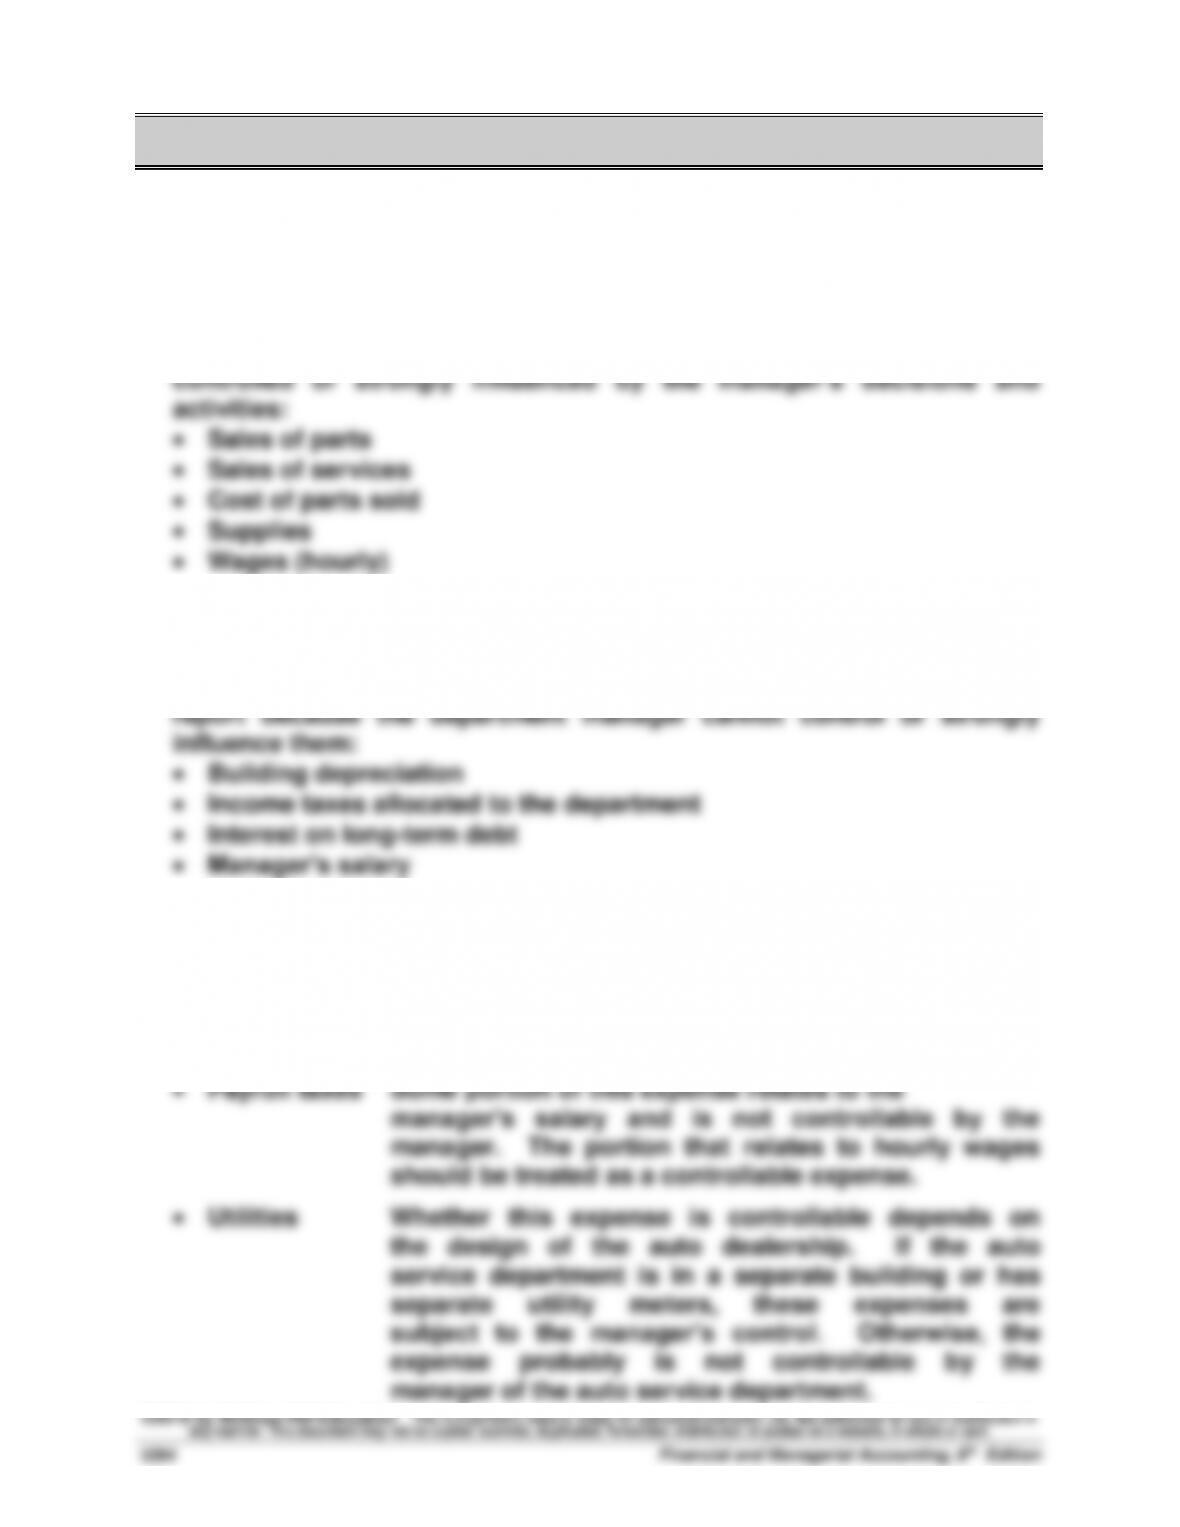
(1) Items included in performance report
The following items definitely should be included in the performance
report for the auto service department manager because they are
(2) Items excluded from performance report
The following items definitely should be excluded from the performance
(3) Items that may or may not be included in performance report
The following items cannot be definitely included or definitely excluded
from the performance report because they may or may not be
completely under the manager’s control or strong influence:
Exercise 22-2 (20 minutes)
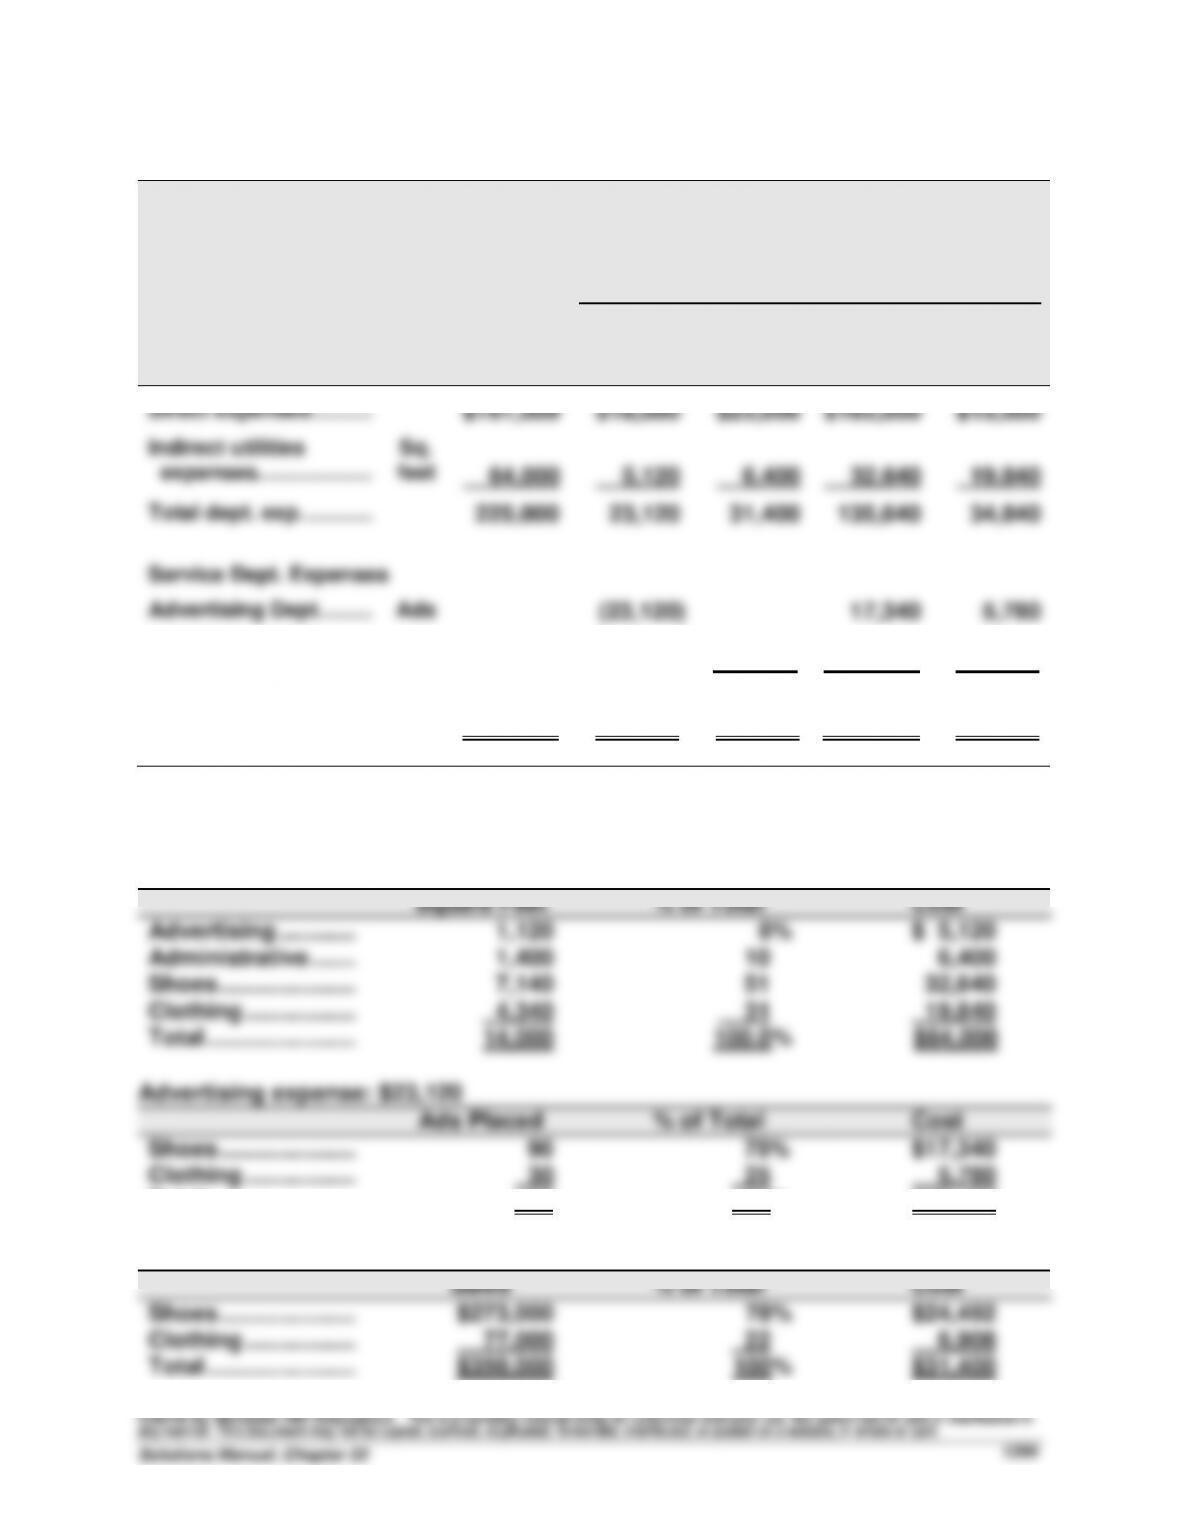
MARATHON RUNNING SHOP
Departmental Expense Allocation Spreadsheet
For Year Ended December 31, 2015
Allocation of Expenses to Departments .
Alloca–
tion
Base
Expense
Account
Balance
Adver-
tising
Dept.
Admini-
strative
Dept.
Shoes
Dept.
Clothing
Dept.
Direct expenses ………...
$161,000
$18,000
$25,000
$103,000
$15,000
Indirect utilities
expenses. ………………..
Sq.
feet
64,000
5,120
6,400
32,640
19,840
Total dept. exp. ………....
225,000
23,120
31,400
135,640
34,840
Service Dept. Expenses
Advertising Dept. ……....
Ads
(23,120)
17,340
5,780
Administrative Dept. ....
Sales
______
(31,400)
24,492
6,908
Total exp. allocated
to operating depts.. ....
$225,000
$ 0
$ 0
$177,472
$47,528
Supporting expense allocation calculations
Utilities expense: $64,000
Square Feet
% of Total
Cost
Advertising …………
1,120
8%
$ 5,120
Administrative …….
1,400
10
6,400
Shoes …………………
7,140
51
32,640
Clothing ……………..
4,340
31
19,840
Total …………………..
14,000
100.0%
$64,000
Advertising expense: $23,120
Ads Placed
% of Total
Cost
Shoes …………………
90
75%
$17,340
Clothing ……………..
30
25
5,780
Total …………………..
120
100%
$23,120
Administrative expense: $31,400
Sales
% of Total
Cost
Shoes …………………
$273,000
78%
$24,492
Clothing ……………..
77,000
22
6,908
Total …………………..
$350,000
100%
$31,400
Exercise 22-3 (25 minutes)
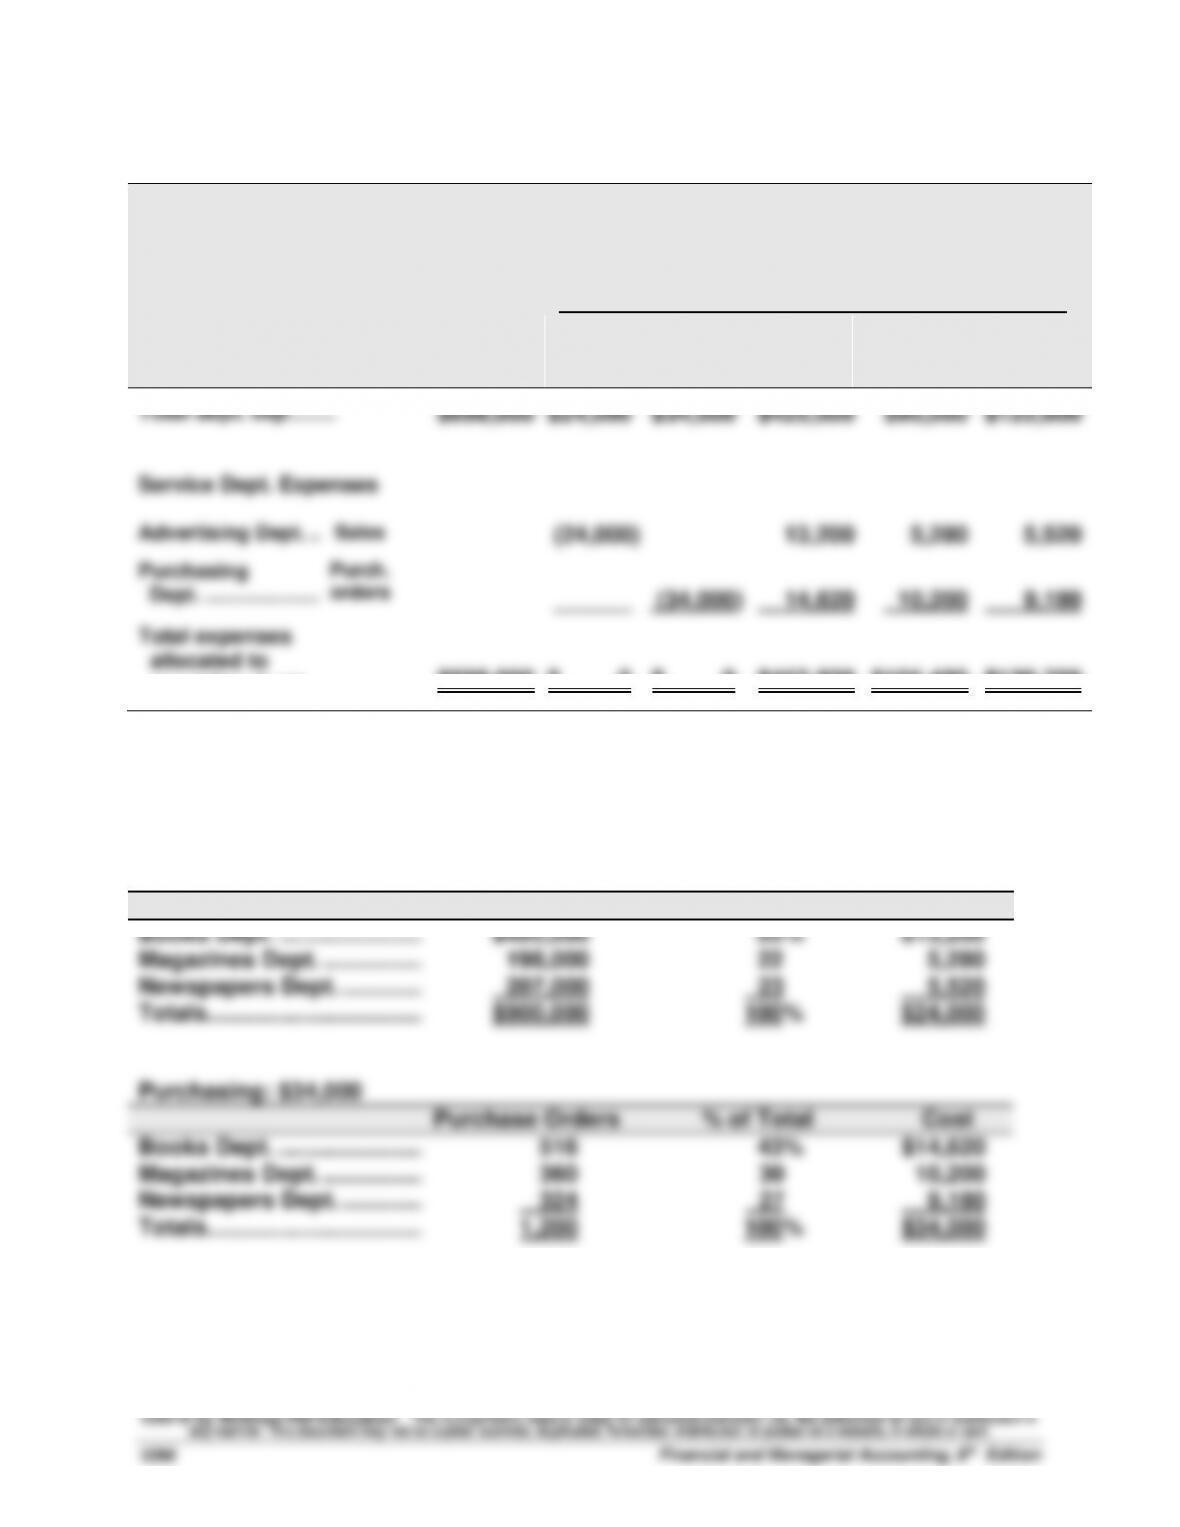
COZY BOOKSTORE
Departmental Expense Allocation Spreadsheet
For Period Ended _______
Allocation of Expenses to Departments .
Alloca–
tion Base
Exp.
Account
Balance
Adver–
tising
Dept.
Purch-
asing
Dept.
Books
Dept.
Maga-
zines
Dept.
News-
papers
Dept.
Total dept. exp. …….………….
$698,000
$24,000
$34,000
$425,000
$90,000
$125,000
Service Dept. Expenses
Advertising Dept. ..……………..
Sales
(24,000)
13,200
5,280
5,520
Purchasing
Dept. …………………………..
Purch.
orders
______
(34,000)
14,620
10,200
9,180
Total expenses
allocated to
operating depts.
$698,000
$ 0
$ 0
$452,820
$105,480
$139,700
Computations for allocations of service dept. costs to operating departments
Advertising: $24,000
Sales
% of Total
Cost
Books Dept. …………………..……..
$495,000
55%
$13,200
Magazines Dept. …………….……..
198,000
22
5,280
Newspapers Dept. ………….……..
207,000
23
5,520
Totals …………………………….……..
$900,000
100%
$24,000
Purchasing: $34,000
Purchase Orders
% of Total
Cost
Books Dept. …………………..……..
516
43%
$14,620
Magazines Dept. …………….……..
360
30
10,200
Newspapers Dept. ………….……..
324
27
9,180
Totals …………………………….……..
1,200
100%
$34,000
Exercise 22-4 (20 minutes)
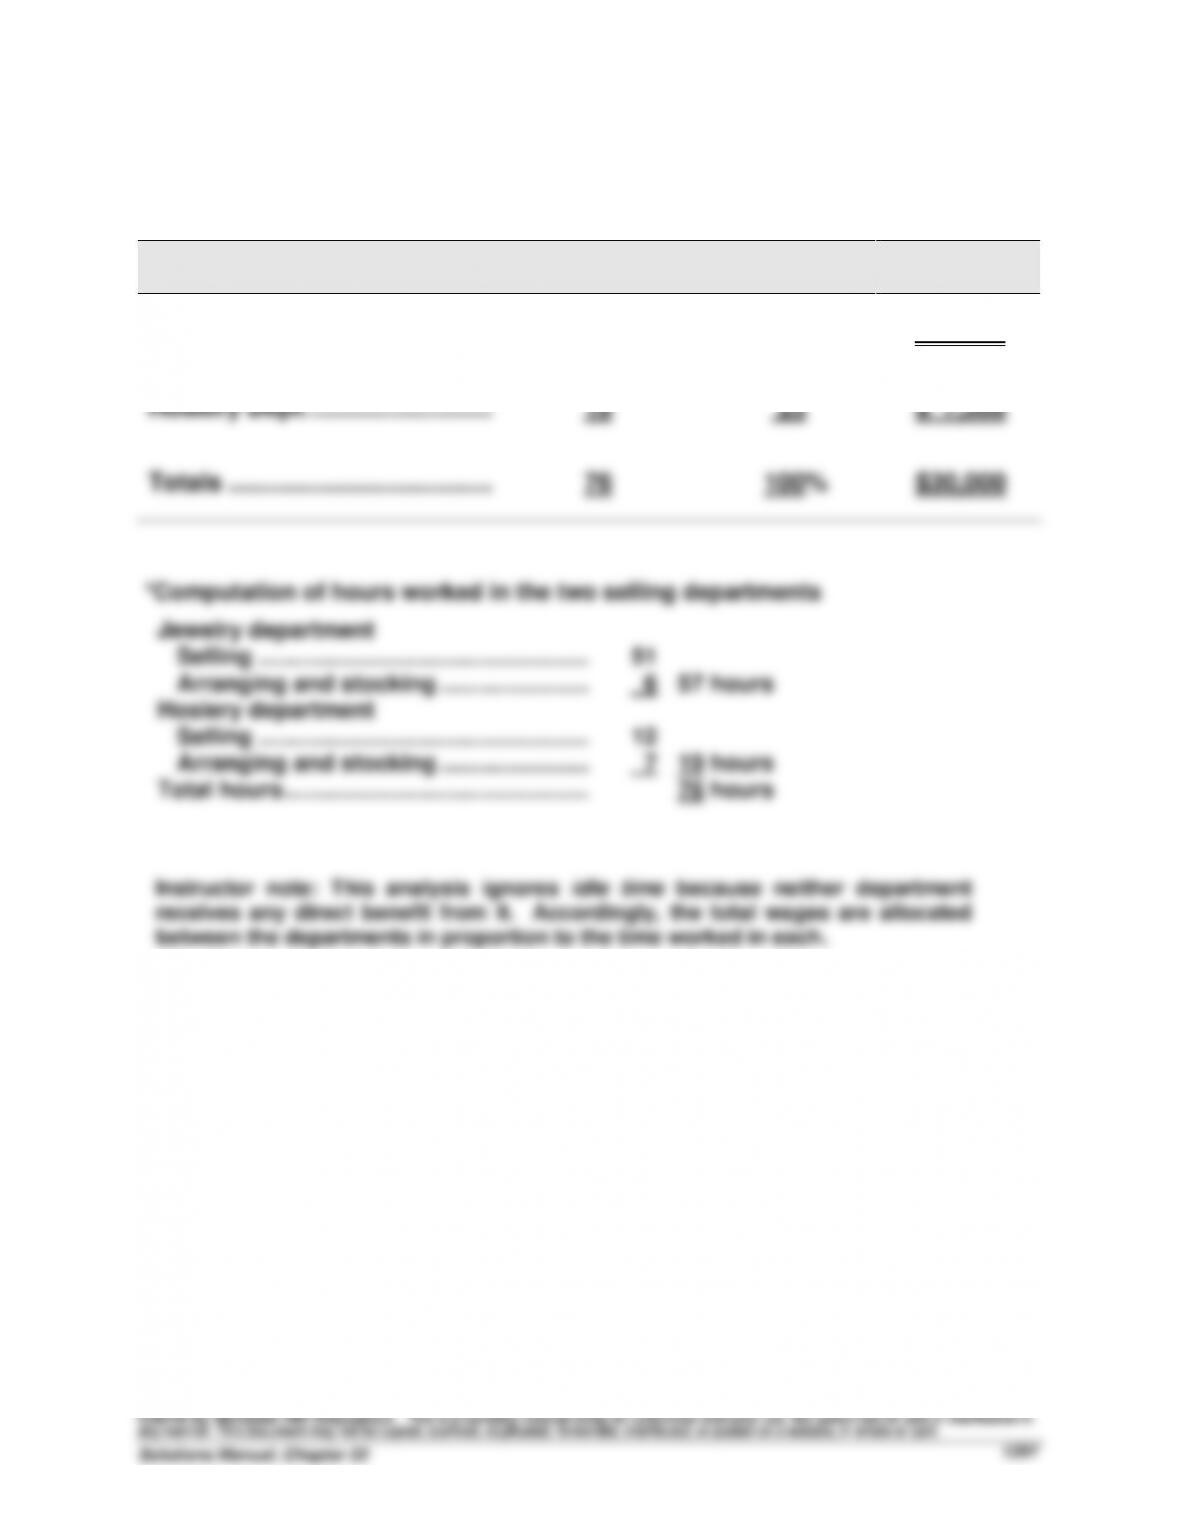
Allocation of annual wages between the two departments
Hours Worked*
% of Total
Cost
Jewelry Dept. …………………………..
57
75%
$22,500
Hosiery Dept. …………………………..
19
25
$ 7,500
Totals …………………………………………
76
100%
$30,000
*Computation of hours worked in the two selling departments
Jewelry department
Selling …………………………………………………..
51
Arranging and stocking …………………..……..
6
57 hours
Hosiery department
Selling …………………………………………………..
12
Arranging and stocking …………………..……..
7
19 hours
Total hours ………………………………………..……..
76 hours
Instructor note: This analysis ignores idle time because neither department
receives any direct benefit from it. Accordingly, the total wages are allocated
between the departments in proportion to the time worked in each.
Exercise 22-5 (25 minutes)
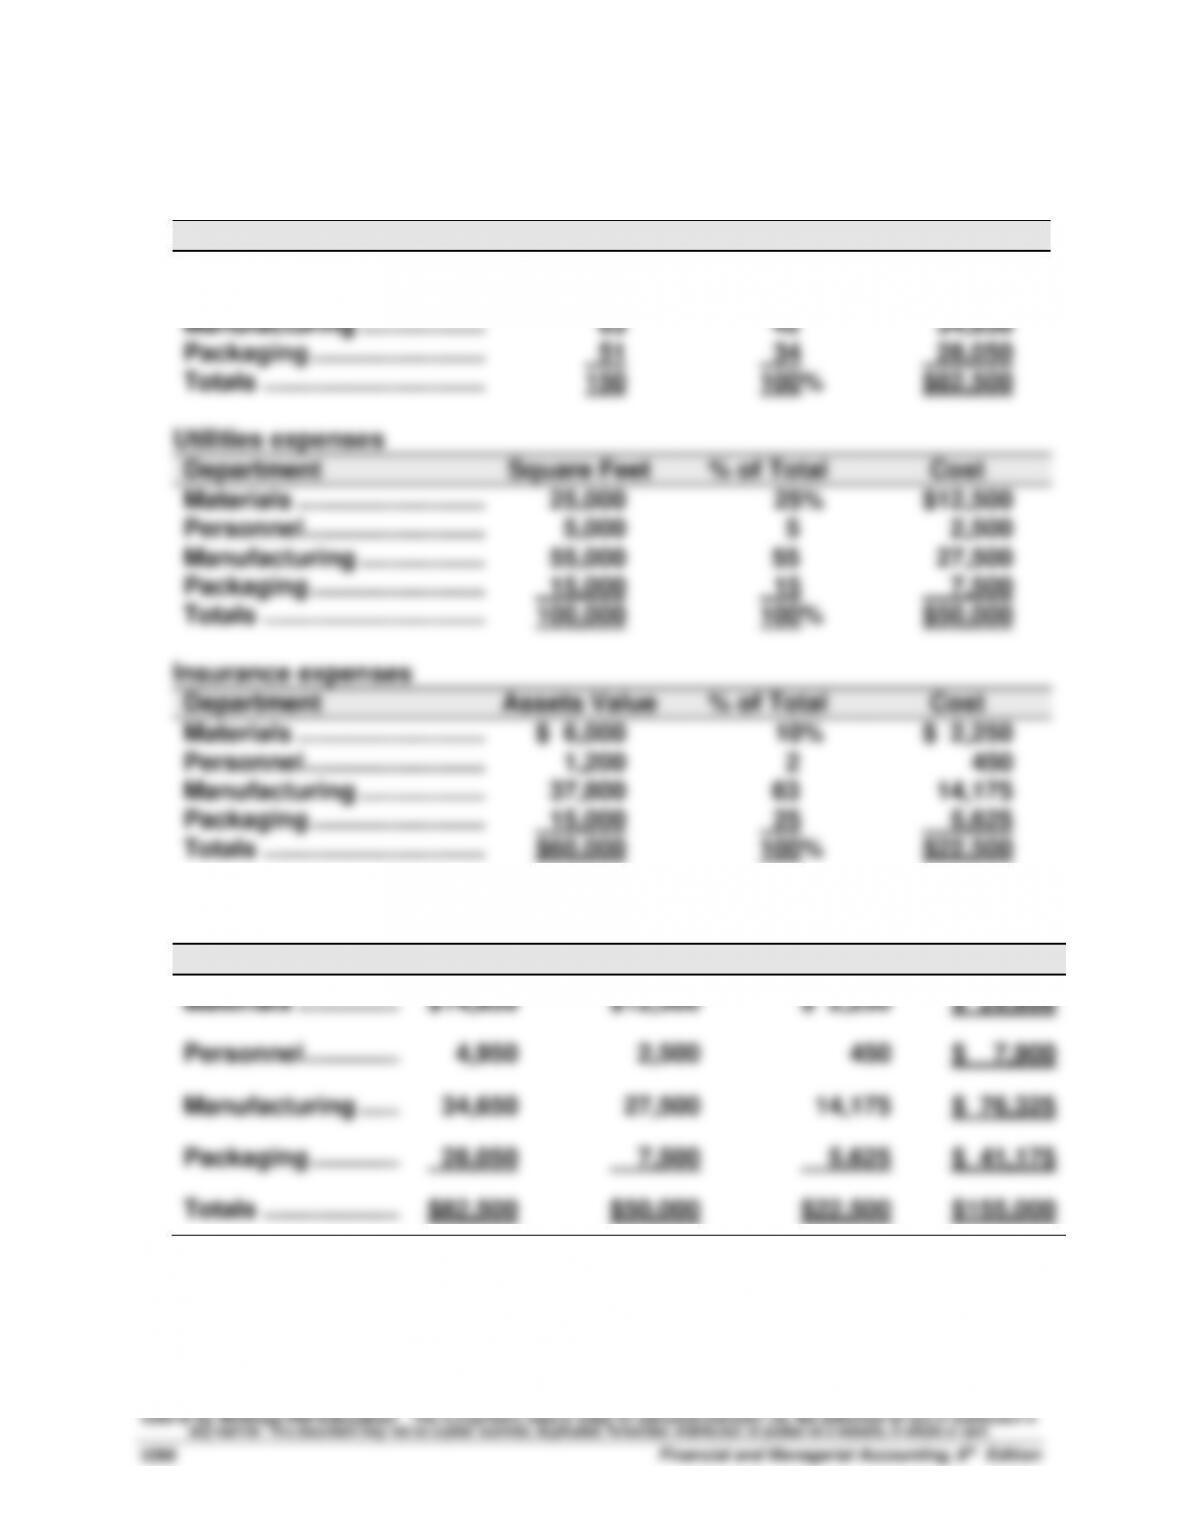
1. Allocation of Indirect Expenses to Four Operating Departments
Supervision expenses
Department
Employees
% of Total
Cost
Materials …………………………..
27
18%
$14,850
Personnel ……………………..……
9
6
4,950
Manufacturing ……………………
63
42
34,650
Packaging …………………….……
51
34
28,050
Totals …………………………..
150
100%
$82,500
Utilities expenses
Department
Square Feet
% of Total
Cost
Materials …………………………..
25,000
25%
$12,500
Personnel ……………………..……
5,000
5
2,500
Manufacturing ……………………
55,000
55
27,500
Packaging …………………….……
15,000
15
7,500
Totals …………………………..
100,000
100%
$50,000
Insurance expenses
Department
Assets Value
% of Total
Cost
Materials …………………………..
$ 6,000
10%
$ 2,250
Personnel ……………………..……
1,200
2
450
Manufacturing ……………………
37,800
63
14,175
Packaging …………………….……
15,000
25
5,625
Totals …………………………..
$60,000
100%
$22,500
2. Report of Indirect Expenses Assigned to Four Operating Departments
Supervision
Utilities
Insurance
Total
Materials …………………………..
$14,850
$12,500
$ 2,250
$ 29,600
Personnel …………..………………
4,950
2,500
450
$ 7,900
Manufacturing ……………………
34,650
27,500
14,175
$ 76,325
Packaging ………….………………
28,050
7,500
5,625
$ 41,175
Totals ………………..…………
$82,500
$50,000
$22,500
$155,000
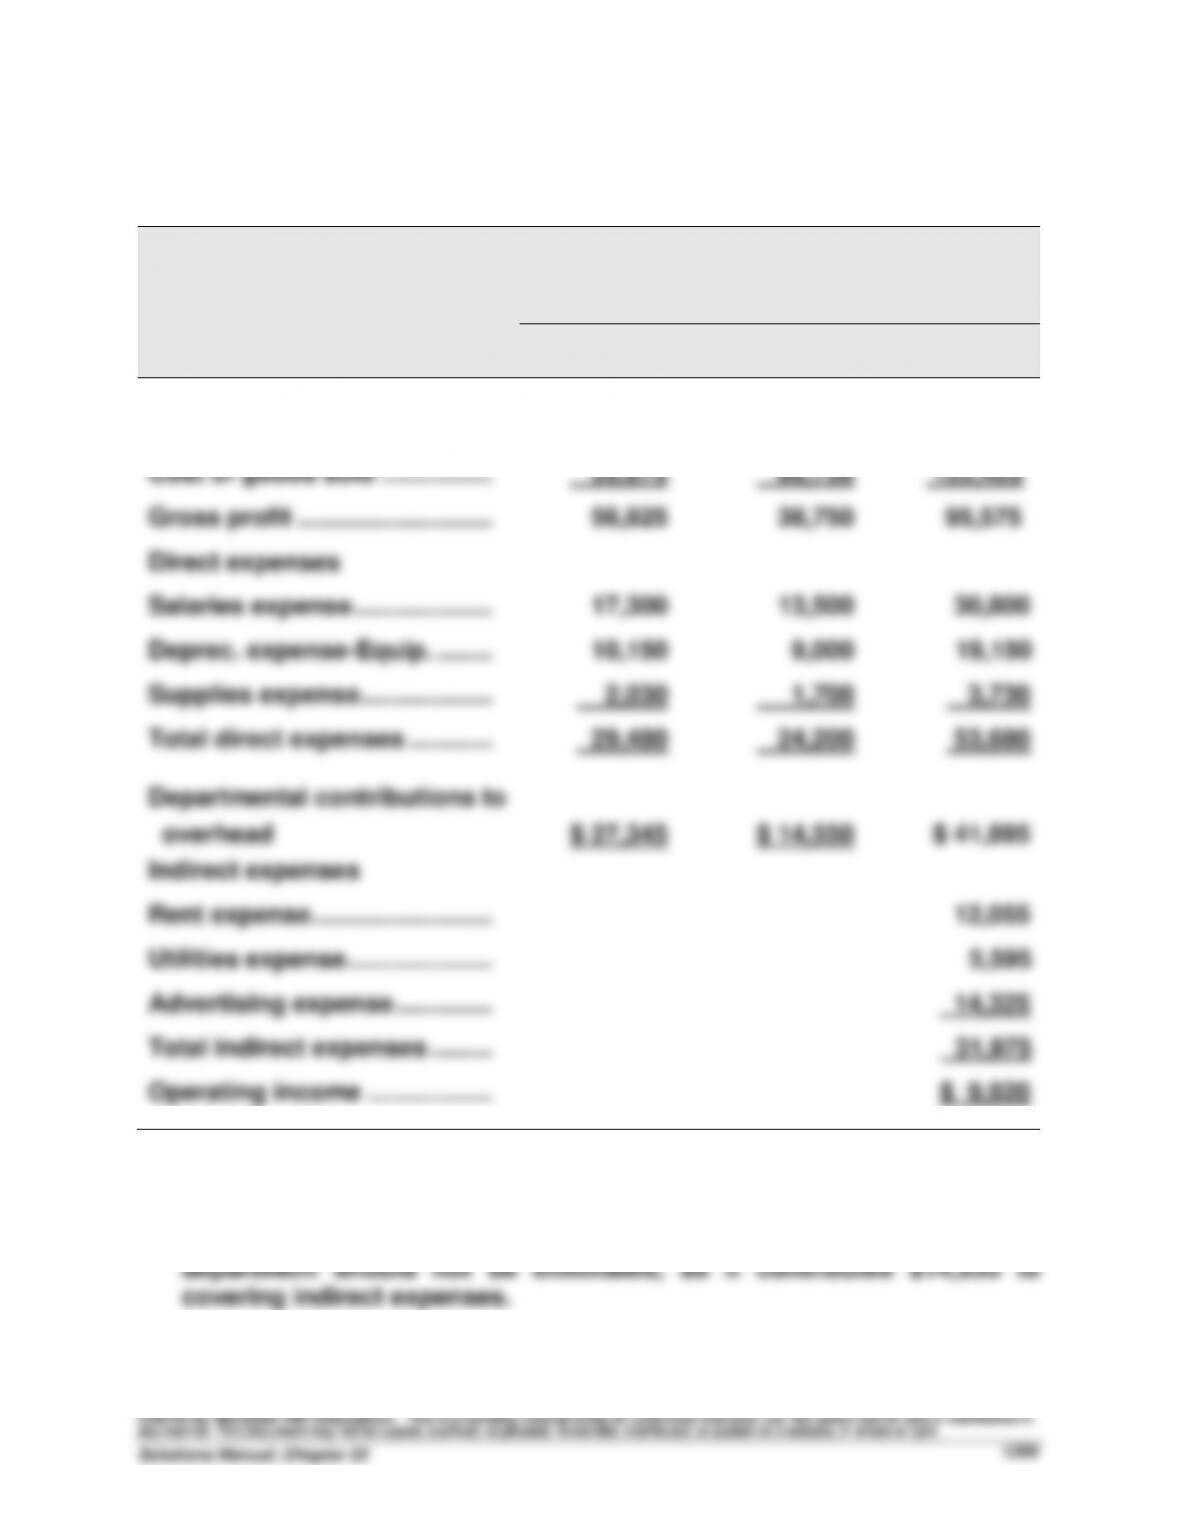
Exercise 22-6 (20 minutes)
(1)
WHOLESALE GUITARS
Departmental Contribution Statements
For Year Ended December 31, 2015
Acoustic
Electric
Dept.
Dept.
Combined
Sales ………………………………….
$112,500
$105,500
$218,000
Cost of goods sold …………….
55,675
66,750
122,425
Gross profit ……………………….
56,825
38,750
95,575
Direct expenses
Salaries expense ………………..
17,300
13,500
30,800
Deprec. expense–Equip. ……..
10,150
9,000
19,150
Supplies expense……………….
2,030
1,700
3,730
Total direct expenses …………
29,480
24,200
53,680
Departmental contributions to
overhead
Indirect expenses
$ 27,345
$ 14,550
$ 41,895
Rent expense ……………………..
12,055
Utilities expense …………………
5,595
Advertising expense …………..
14,325
Total indirect expenses ………
31,975
Operating income ………………
$ 9,920
(2) Based on departmental contribution to overhead, the electric guitar
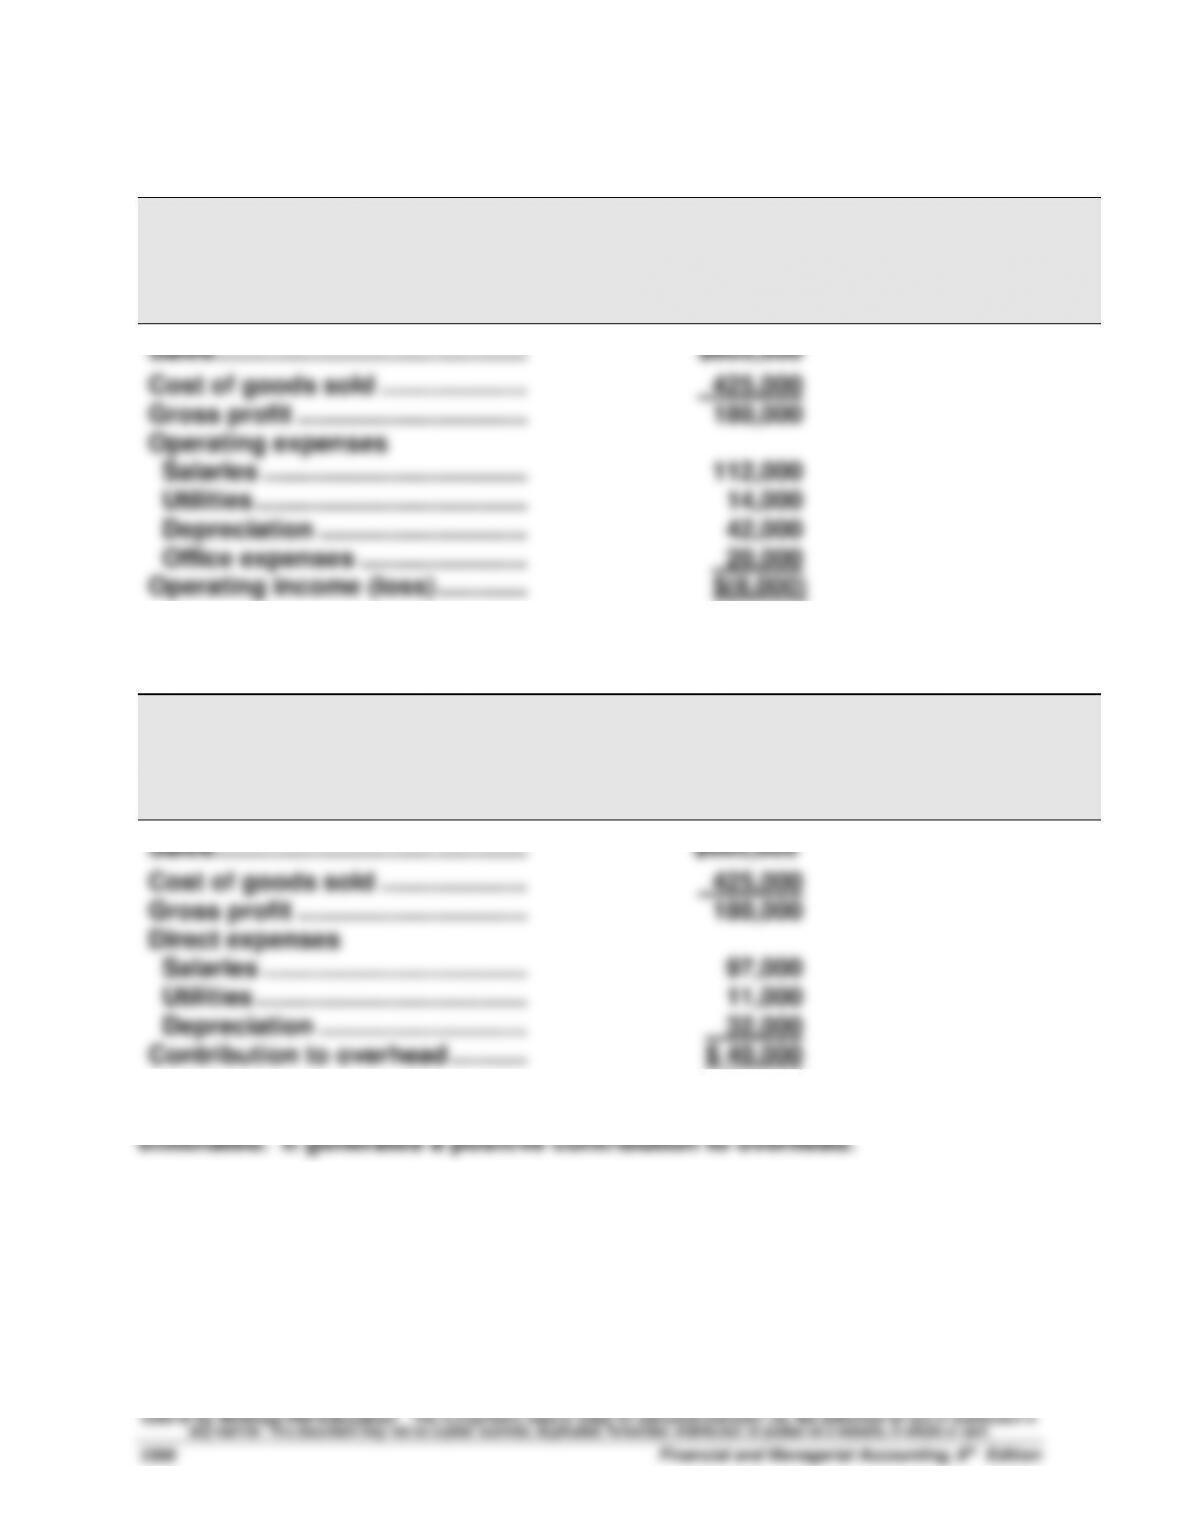
Exercise 22–7 (25 minutes)
1.
JANSEN COMPANY
Departmental Income Statement—Ski Department
For Year Ended December 31, 2015
Ski Dept.
Sales ………………………………………
$605,000
Cost of goods sold …………………
425,000
Gross profit …………………………...
Operating expenses
Salaries …………………………..……
Utilities …………………………..…….
Depreciation …………………………
Office expenses ……………………
180,000
112,000
14,000
42,000
20,000
Operating income (loss) ………….
$(8,000)
2.
JANSEN COMPANY
Departmental Contribution to Overhead—Ski Department
For Year Ended December 31, 2015
Ski Dept.
Sales ………………………………………
$605,000
Cost of goods sold …………………
425,000
Gross profit …………………………...
Direct expenses
Salaries …………………………..……
Utilities …………………………..…….
Depreciation …………………………
Contribution to overhead ………..
180,000
97,000
11,000
32,000
$ 40,000
3. Based on these performance reports, the ski department should not be
Exercise 22-8 (15 minutes)
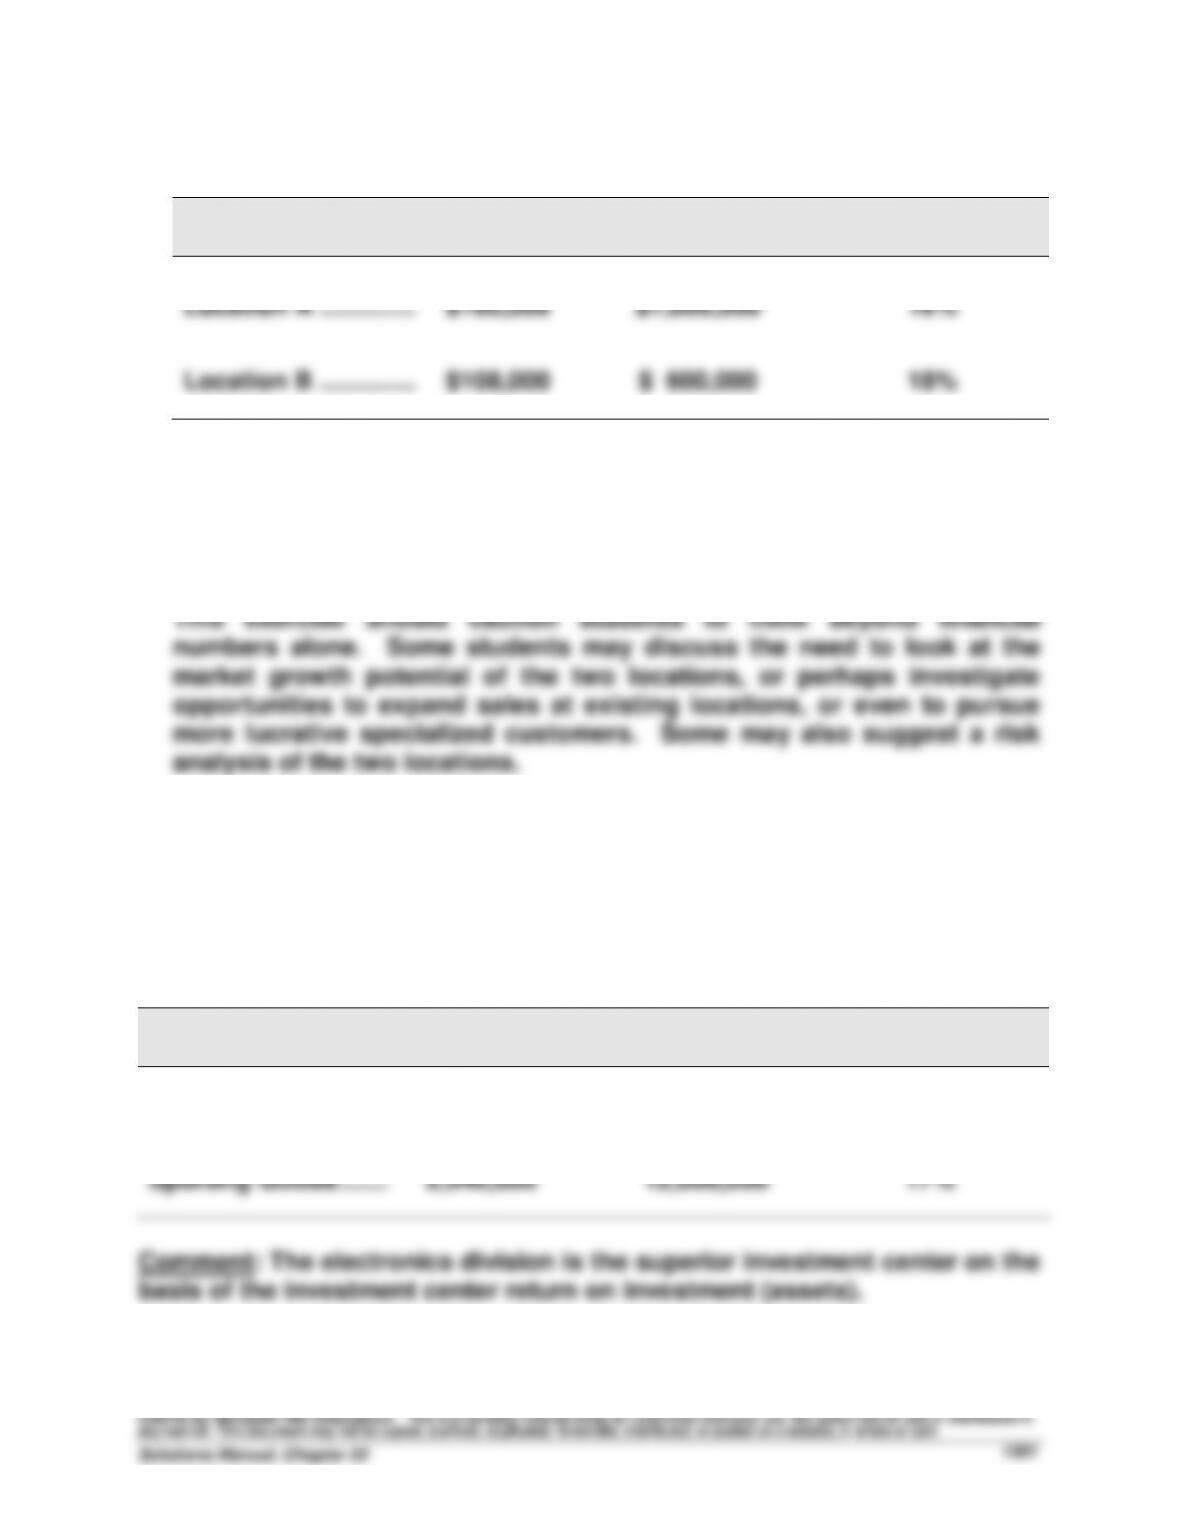
1.
Location
Net income
Average assets
Return on
investment
Location A …………..………
$160,000
$1,000,000
16%
Location B …………..………
$108,000
$ 600,000
18%
2. The recommendation is to pursue Location B because its return on
investment (assets) is 18%, compared to 16% at Location A. Moreover,
given the normal return of 18% for this chain, only Location B meets this
hurdle.
Exercise 22-9 (20 minutes)
(1)
Investment center
Income
Average assets
Return on
investment
Electronics …………….….
$2,880,000
$16,000,000
18%
Sporting Goods ……..….
2,040,000
12,000,000
17%
Comment: The electronics division is the superior investment center on the
basis of the investment center return on investment (assets).
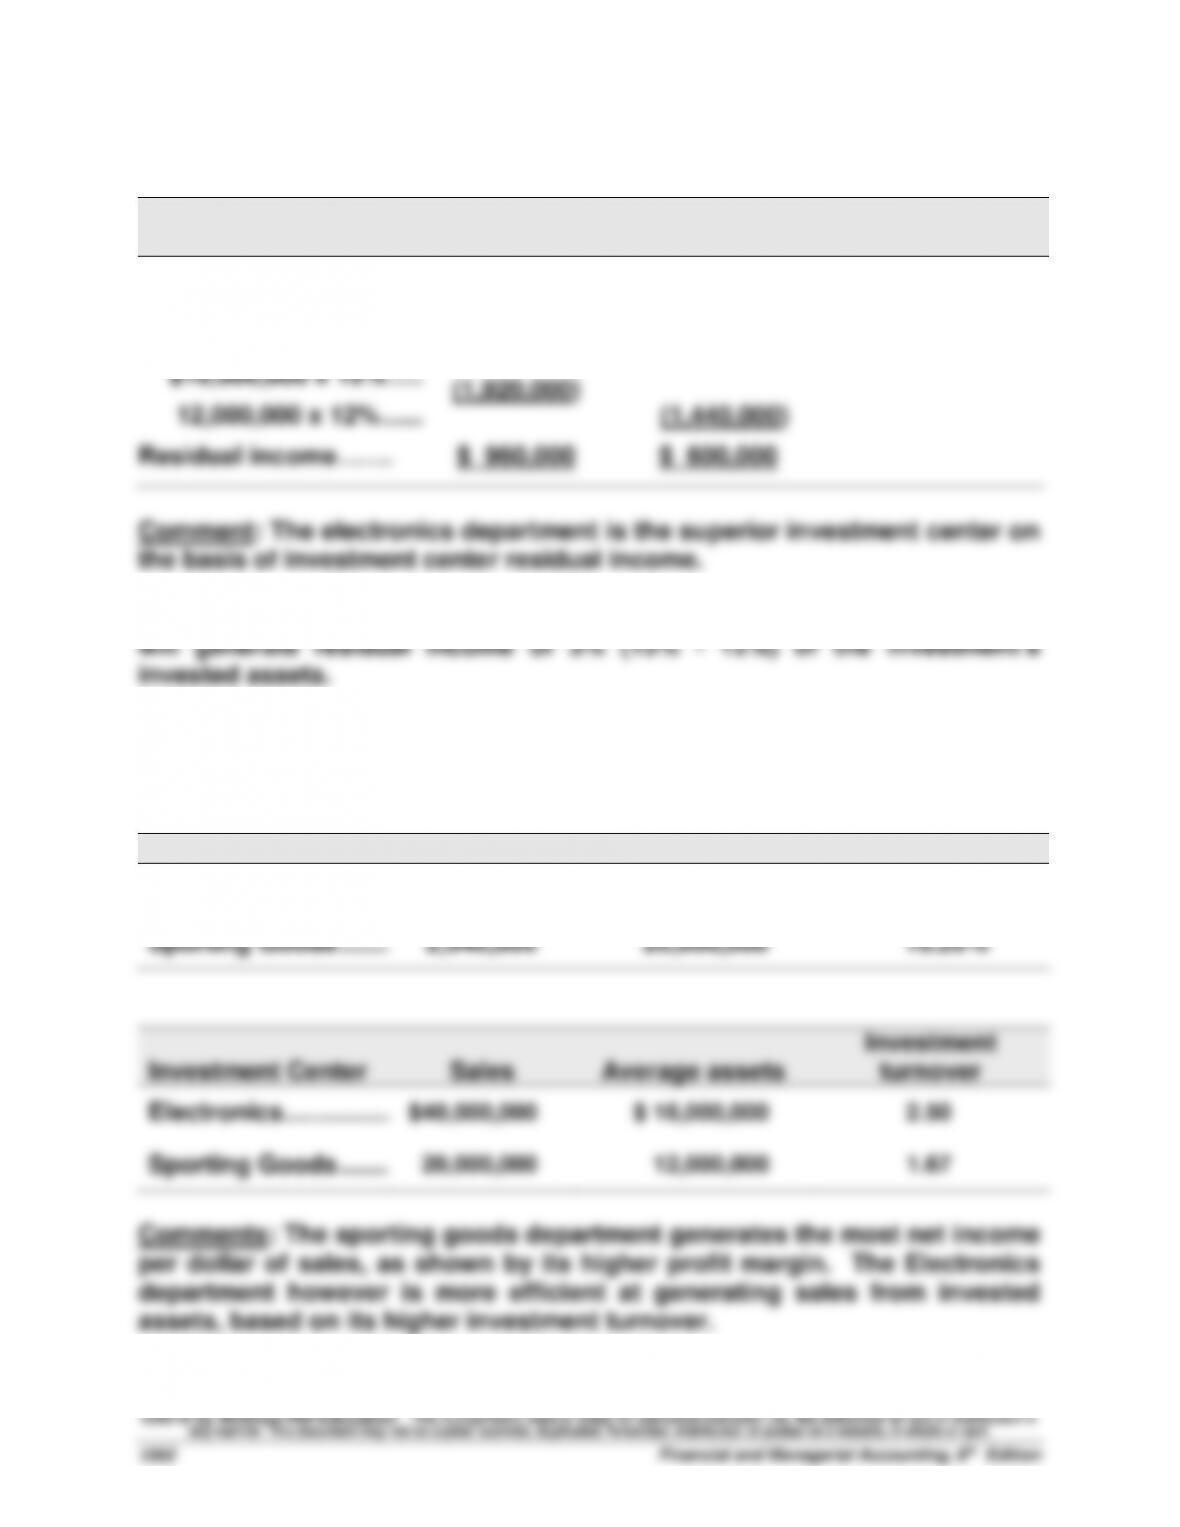
Exercise 22-9 (continued)
(2)
Investment Center
Electronics
Sporting
Goods
Net income ………………..
$2,880,000
$2,040,000
Target net income
$16,000,000 x 12% …..
12,000,000 x 12% ……
(1,920,000)
(1,440,000)
Residual income……. $ 960,000 $ 600,000
Comment: The electronics department is the superior investment center on
the basis of investment center residual income.
(3) The electronics department should accept the new opportunity, since it
Exercise 22–10 (15 minutes)
Investment Center
Income
Sales
Profit margin
Electronics …………….….
$2,880,000
$40,000,000
7.20%
Sporting Goods ……..….
2,040,000
20,000,000
10.20%
Investment Center
Sales
Average assets
Investment
turnover
Electronics …………….….
$40,000,000
$ 16,000,000
2.50
Sporting Goods ……..….
20,000,000
12,000,000
1.67
Comments: The sporting goods department generates the most net income
per dollar of sales, as shown by its higher profit margin. The Electronics
department however is more efficient at generating sales from invested
assets, based on its higher investment turnover.