Chapter 22
QUESTIONS
1. Many companies are divided into departments when they become too large to be
effectively managed as single units. This division into departments is often needed
2. Operating departments are directly involved in manufacturing or selling the
3. Controllable costs of a department are those that the department’s manager has the
power to control, determine or at least strongly influence. The manager does not
4. Controllable and uncontrollable costs must be identified with a particular manager
5. Managers should be involved in preparing their responsibility accounting budgets to
6. Two main goals in managerial accounting for departments are to measure the: (i)
7. Not usually; a cost center cannot usually be evaluated in terms of its profitability
8. Direct expenses of a department are expenses that are incurred for the sole benefit
of that department—there is little doubt about which department should be charged
9. a) Sales of the departments or the number of employees in each department.
b) Square feet of floor space, perhaps adjusted for its value.
10. A department’s contribution to overhead is measured by subtracting its direct
11. The individual responsible for controlling the cost needs timely reports with specific
cost information. This individual has the power to adjust cost levels to more
efficient and/or effective levels.
12A. A transfer price is an amount used to record transactions made between divisions
15. a) It is useful to know the amount of sales for each department as well as direct
costs for each department. This information can help assess the effectiveness of
16. Controllable cost examples — labor of department, packaging supplies, office
17. Cycle time is the time it takes a company to produce a product or service. Its
18. Value-added time provides value to a product or service from a customer’s
19. Cycle efficiency is the ratio of value-added time divided by total cycle time. The
closer cycle efficiency is to 1, the more of a company’s time is spent on value-added
20. Yes. Samsung can use cycle time and cycle efficiency to measure operating
Quick Study 22-1 (10 minutes)
% of
Advertising to
Allocated
Department
Sales
Total
allocate
amount
1………………………………….
$220,000
27.5%
$100,000
$ 27,500
2………………………………….
400,000
50.0%
100,000
50,000
3………………………………….
180,000
22.5%
100,000
22,500
Total ………………………..…
$800,000
100.0%
$100,000
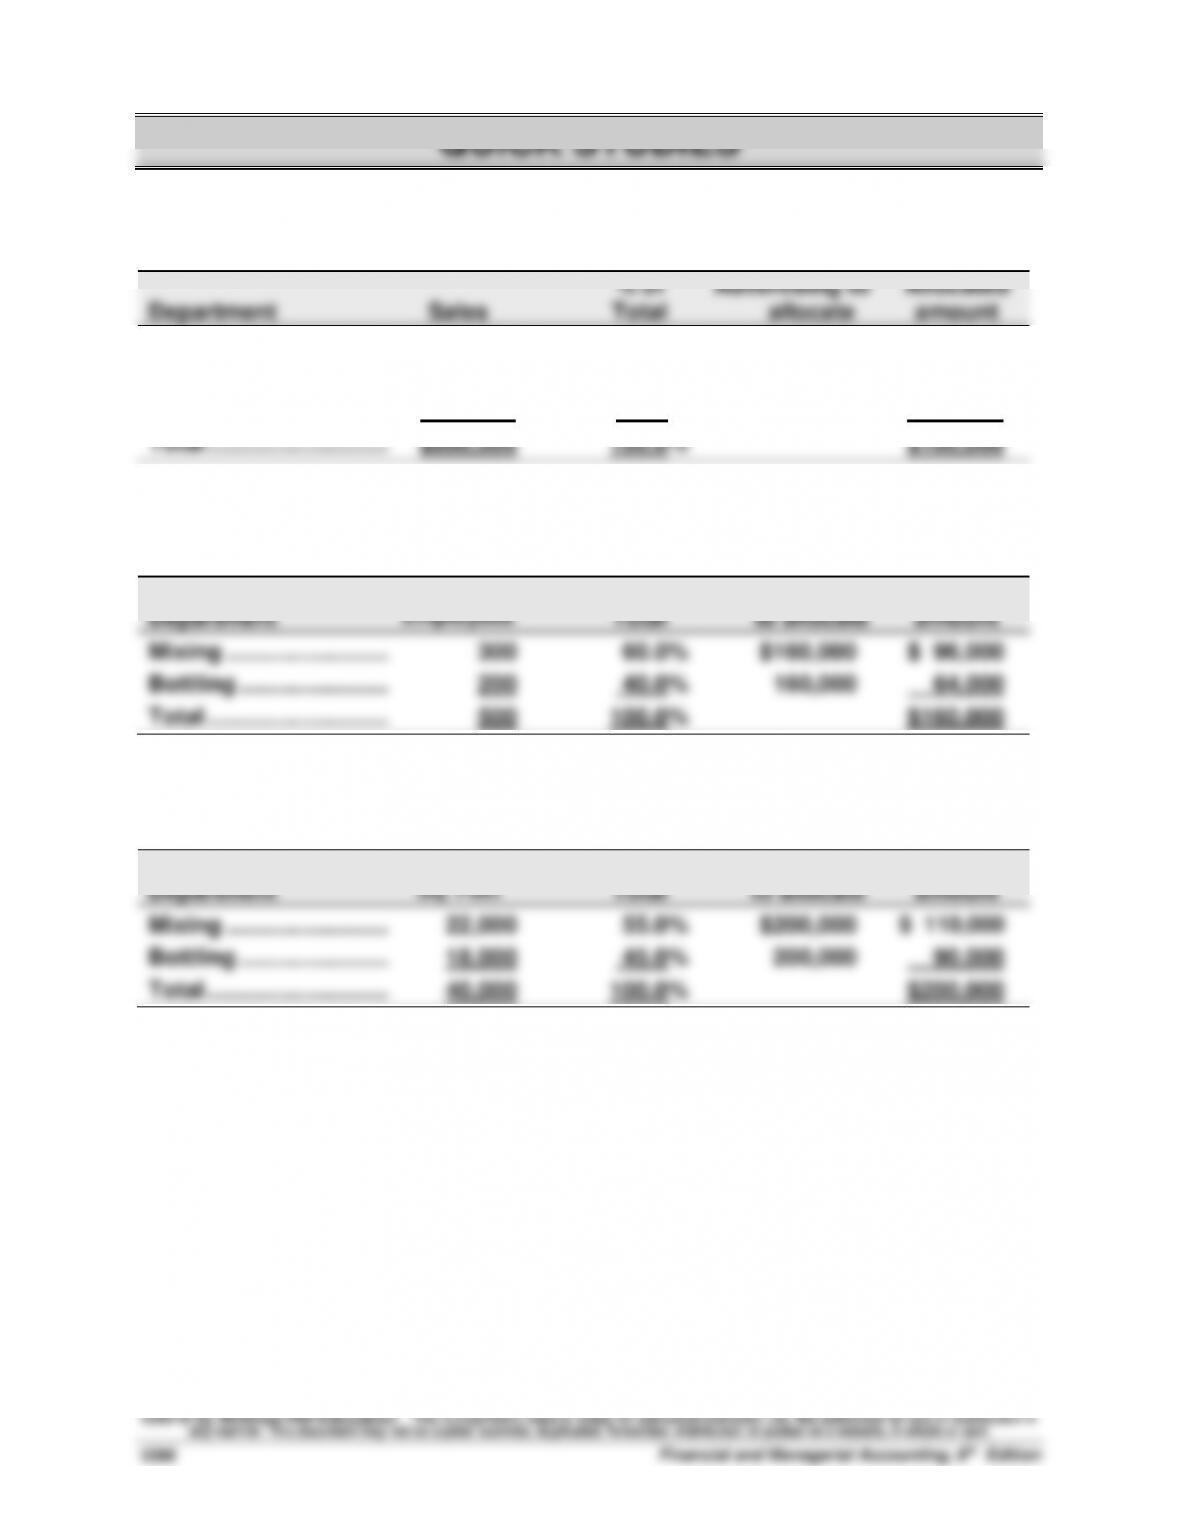
Quick Study 22-2 (10 minutes)
% of
Admin. Exp.
Allocated
Department
Employees
Total
to allocate
amount
Mixing ……………………..….
300
60.0%
$160,000
$ 96,000
Bottling ……………………….
200
40.0%
160,000
64,000
Total ………………………..…
500
100.0%
$160,000
Quick Study 22-3 (10 minutes)
% of
Maint. Exp.
Allocated
Department
Sq. Feet
Total
to allocate
amount
Mixing ……………………..….
22,000
55.0%
$200,000
$ 110,000
Bottling ……………………….
18,000
45.0%
200,000
90,000
Total ………………………..…
40,000
100.0%
$200,000
Quick Study 22-4 (10 minutes)
1.
A
5.
F
2.
C
6.
B
3.
G
7.
E
4.
D
Quick Study 22-5 (10 minutes)
1. Proportion of total processing time for each factory department; or
2. Relative number of employees; or proportion of total sales.
3. Proportion of total time in each department for maintenance; or
4. Proportion of floor space occupied by each department; relative
Quick Study 22-6 (5 minutes)
1.
D
3.
B
2.
C
4.
A
Quick Study 22-7 (15 minutes)
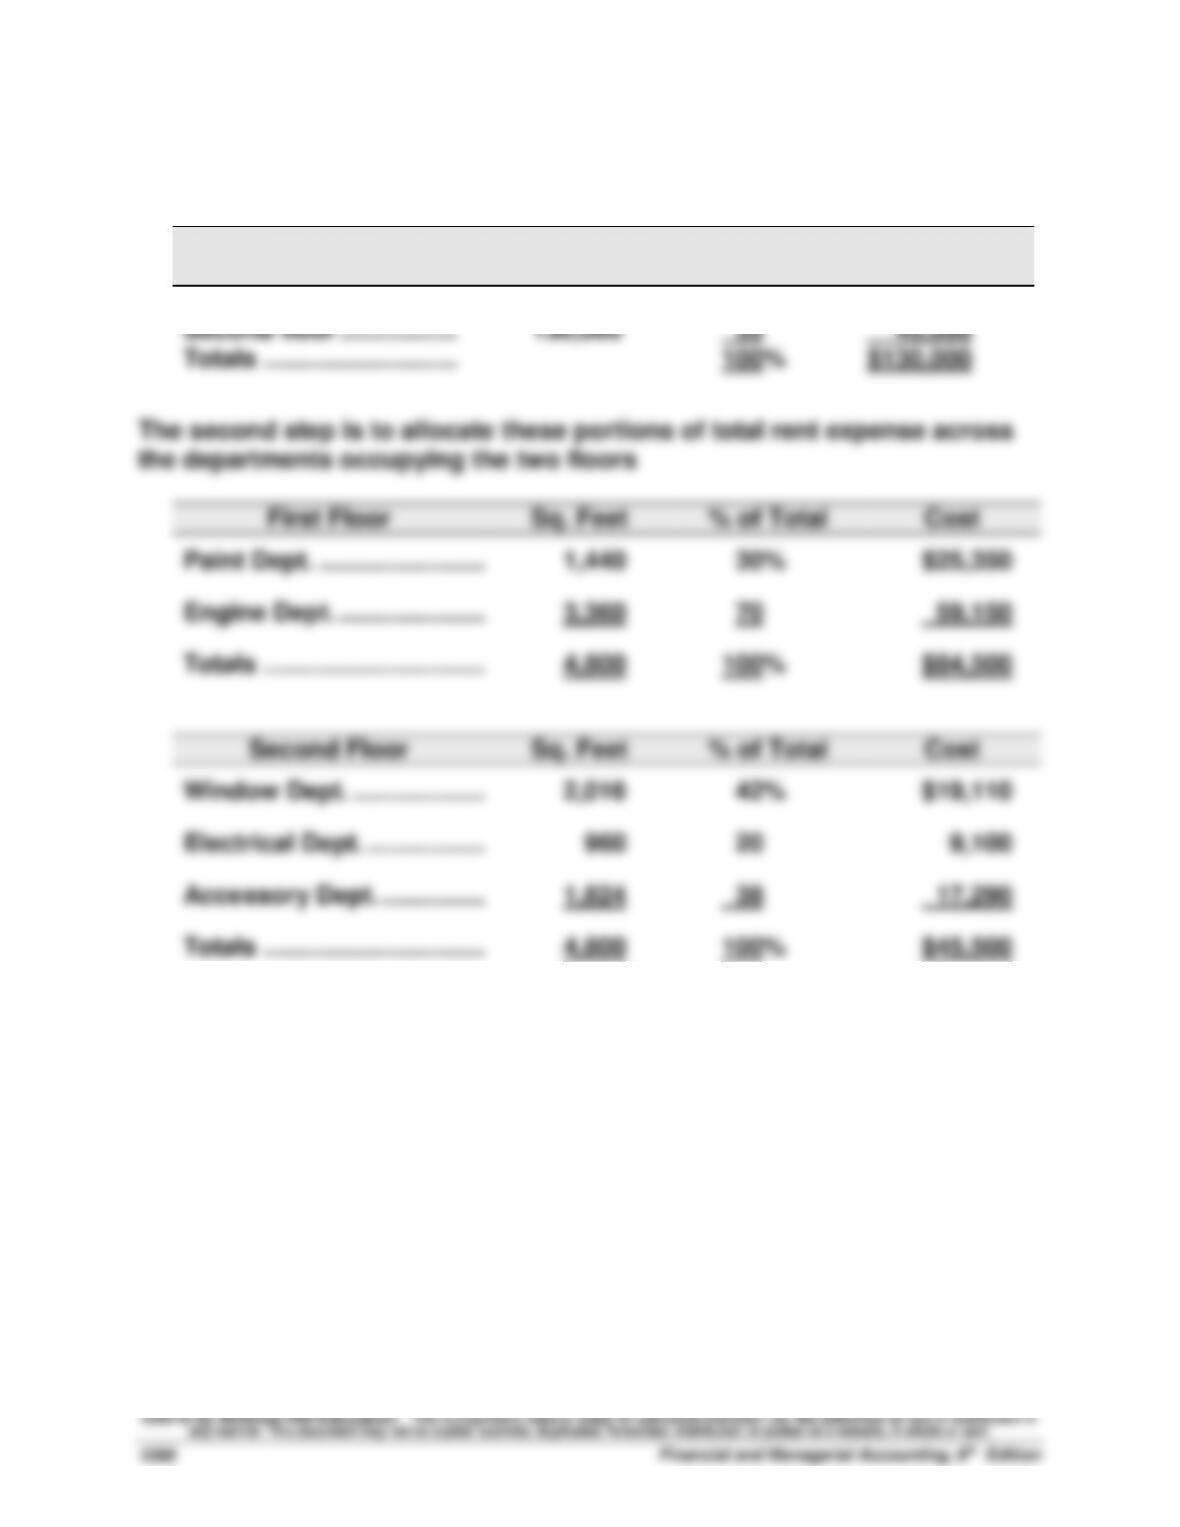
The first step is to allocate total rent expense between the two floors.
Amount
Allocated
% of Total
Cost
First floor ………………….
$130,000
65%
$ 84,500
Second floor ……………..
130,000
35
45,500
Totals ……………………….
100%
$130,000
The second step is to allocate these portions of total rent expense across
the departments occupying the two floors
First Floor
Sq. Feet
% of Total
Cost
Paint Dept. …………………………
1,440
30%
$25,350
Engine Dept. ………………………
3,360
70
59,150
Totals …………………………..
4,800
100%
$84,500
Second Floor
Sq. Feet
% of Total
Cost
Window Dept. ……………….……
2,016
42%
$19,110
Electrical Dept. ……………..……
960
20
9,100
Accessory Dept. …………………
1,824
38
17,290
Totals …………………………..
4,800
100%
$45,500
Quick Study 22-8 (15 minutes)
Departmental contribution to overhead
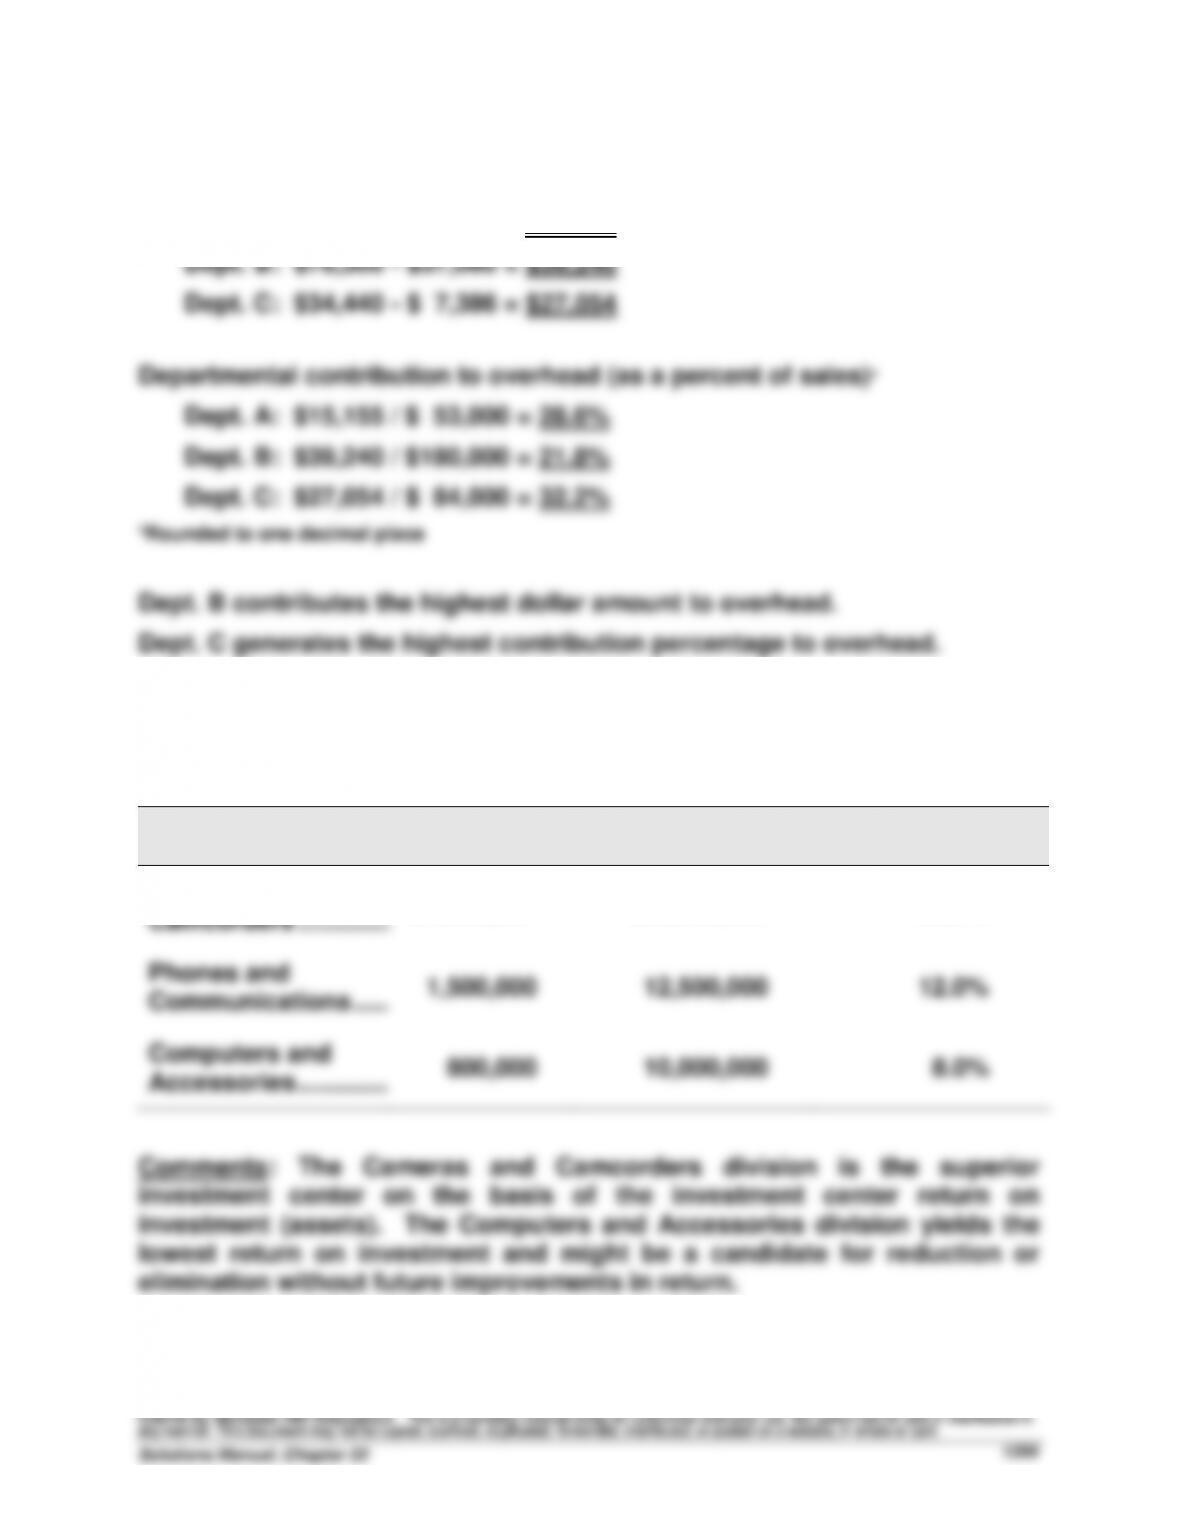
Dept. A: $18,815 – $ 3,660 = $15,155
Quick Study 22-9 (10 minutes)
Investment Center
Income
Average Assets
Return on
Investment
Cameras and
Camcorders …………..….
$4,500,000
$20,000,000
22.5%
Phones and
Communications ……….
1,500,000
12,500,000
12.0%
Computers and
Accessories …………..….
800,000
10,000,000
8.0%
Comments: The Cameras and Camcorders division is the superior
investment center on the basis of the investment center return on
investment (assets). The Computers and Accessories division yields the
lowest return on investment and might be a candidate for reduction or
elimination without future improvements in return.
Quick Study 22–10 (10 minutes)
Cameras &
Camcorders
Phones &
Communication
Computers &
Accessories
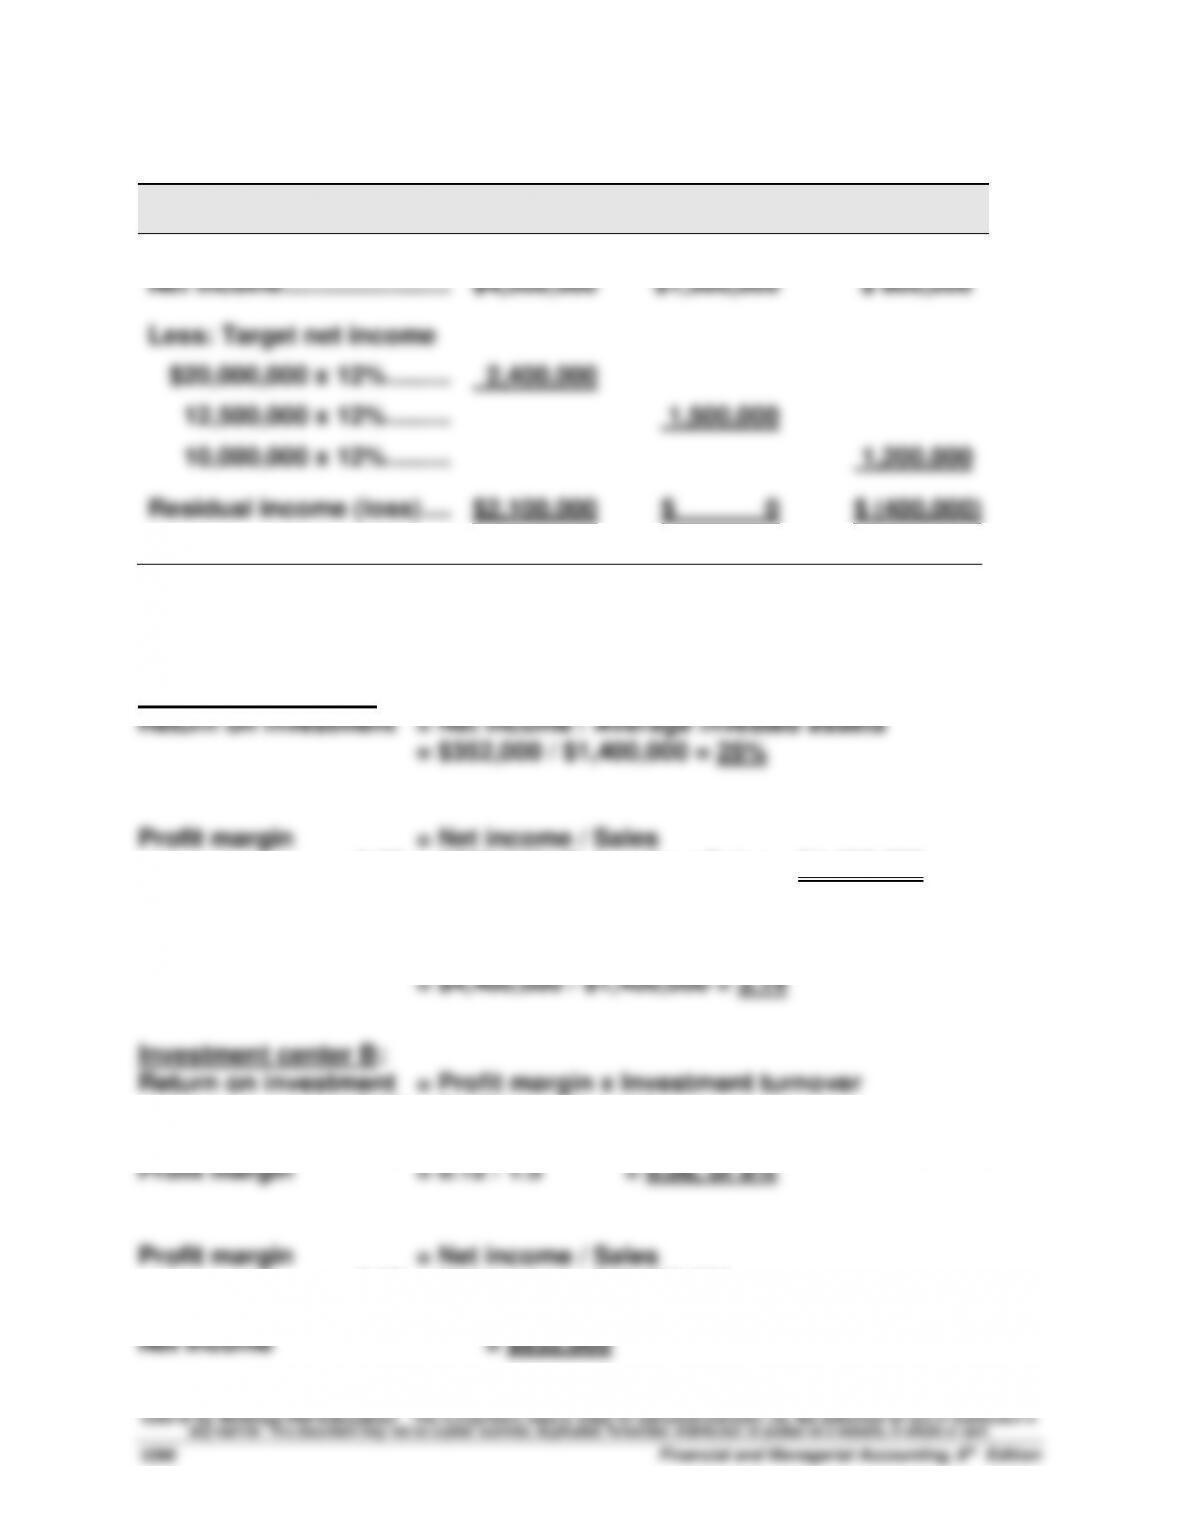
Net income …………………………
$4,500,000
$1,500,000
$ 800,000
Less: Target net income
$20,000,000 x 12% ……………
12,500,000 x 12% ……………
10,000,000 x 12% ……………
2,400,000
1,500,000
1,200,000
Residual income (loss) ….……
$2,100,000
$ 0
$ (400,000)
Quick Study 22–11 (15 minutes)
Investment center A:
0.08 = $352,000 / Sales, thus Sales = $4,400,000
Investment turnover = Sales / Average invested assets
0.12 = Profit margin x 1.5
Thus,
0.08 = Net income / $10,400,000
Thus,

Quick Study 22-11 (continued)
1.5 = $10,400,000 / Average invested assets
Thus,
Quick Study 22–12 (10 minutes)
Quick Study 22–13 (5 minutes)
1. C 5. F
2. I 6. I
3. F 7. P
4. I 8. C
Quick Study 22-14 (10 minutes)
Process Perspective Actual Occupancy Goal
Quick Study 22-15 (10 minutes)
a.
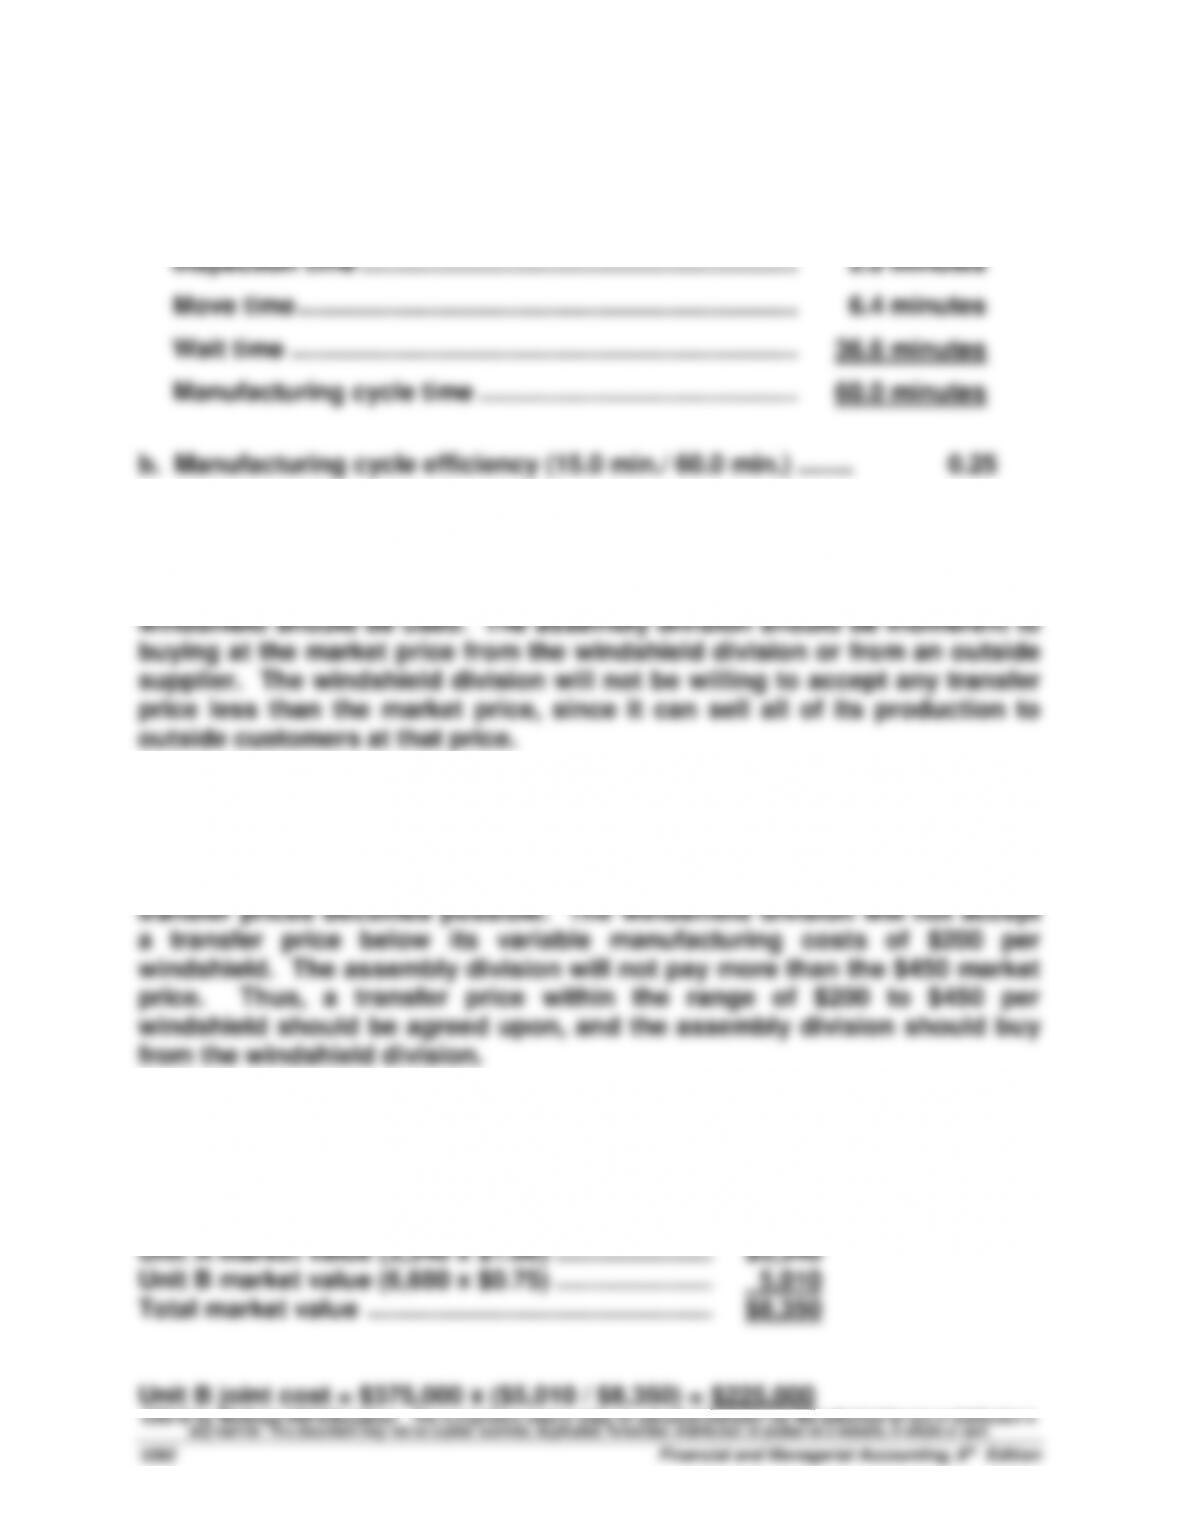
Process time ………………………………………………………….………..
15.0 minutes
Inspection time ……………………………………………………….
2.0 minutes
Move time ……………………………………………………….……..………..
6.4 minutes
Wait time ……………………………………………………………….………..
36.6 minutes
Manufacturing cycle time ……………………………………….………..
60.0 minutes
b.
Manufacturing cycle efficiency (15.0 min./ 60.0 min.) ……..…
0.25
Quick Study 22-16A (10 minutes)
Without excess capacity, a market-based transfer price of $450 per
Quick Study 22-17A (10 minutes)
If the windshield division has excess capacity, a range of acceptable
Quick Study 22-18B (15 minutes)
Total joint cost = $325,000 + $50,000 = $375,000
Unit A market value (3,340 x $1.00) …………………..…….
$3,340
Unit B market value (6,680 x $0.75) …………………..…….
5,010
Total market value …………………………..…………………….
$8,350
Unit B joint cost = $375,000 x ($5,010 / $8,350) = $225,000