Problem 18-7A (50 minutes)
Part 1 BREAK–EVEN ANALYSIS ASSUMING USE OF SAME MATERIALS
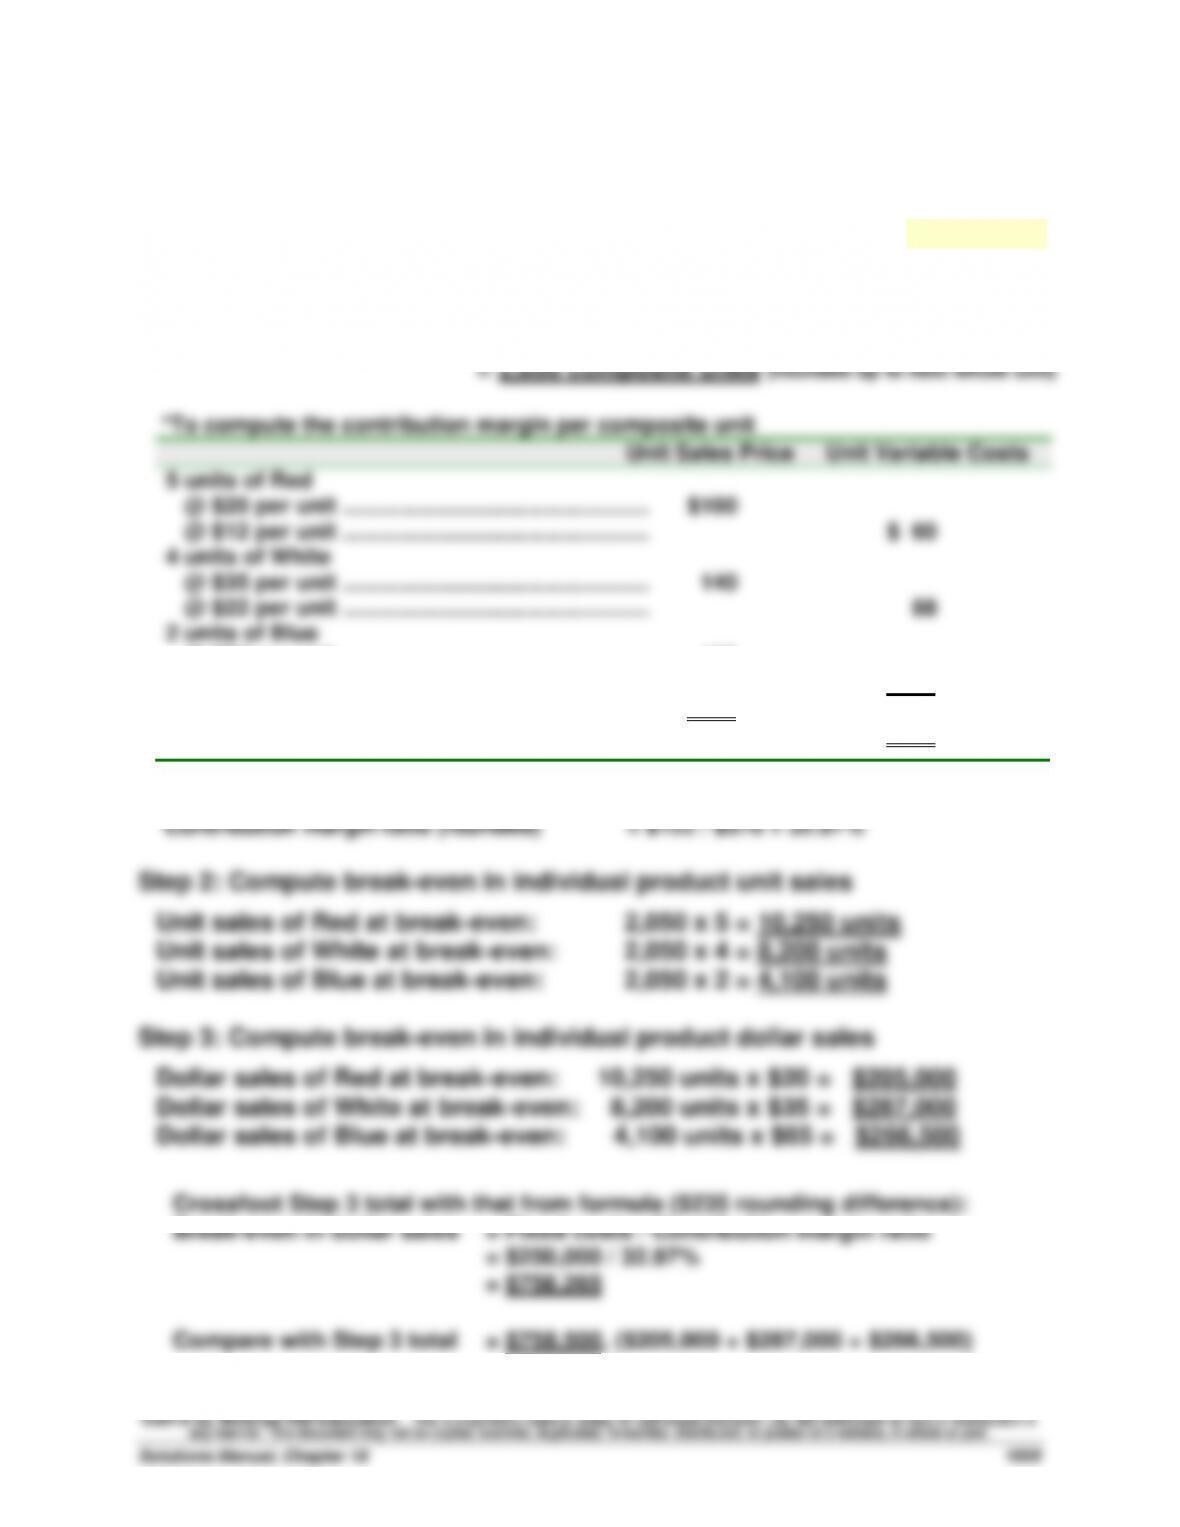
Step 1: Compute break-even in composite units—Use equation in Exhibit 18.29
Break-even in composite units = Fixed costs/Contribution margin per composite unit
= $250,000 / $122*
Problem 18–7A (Continued)
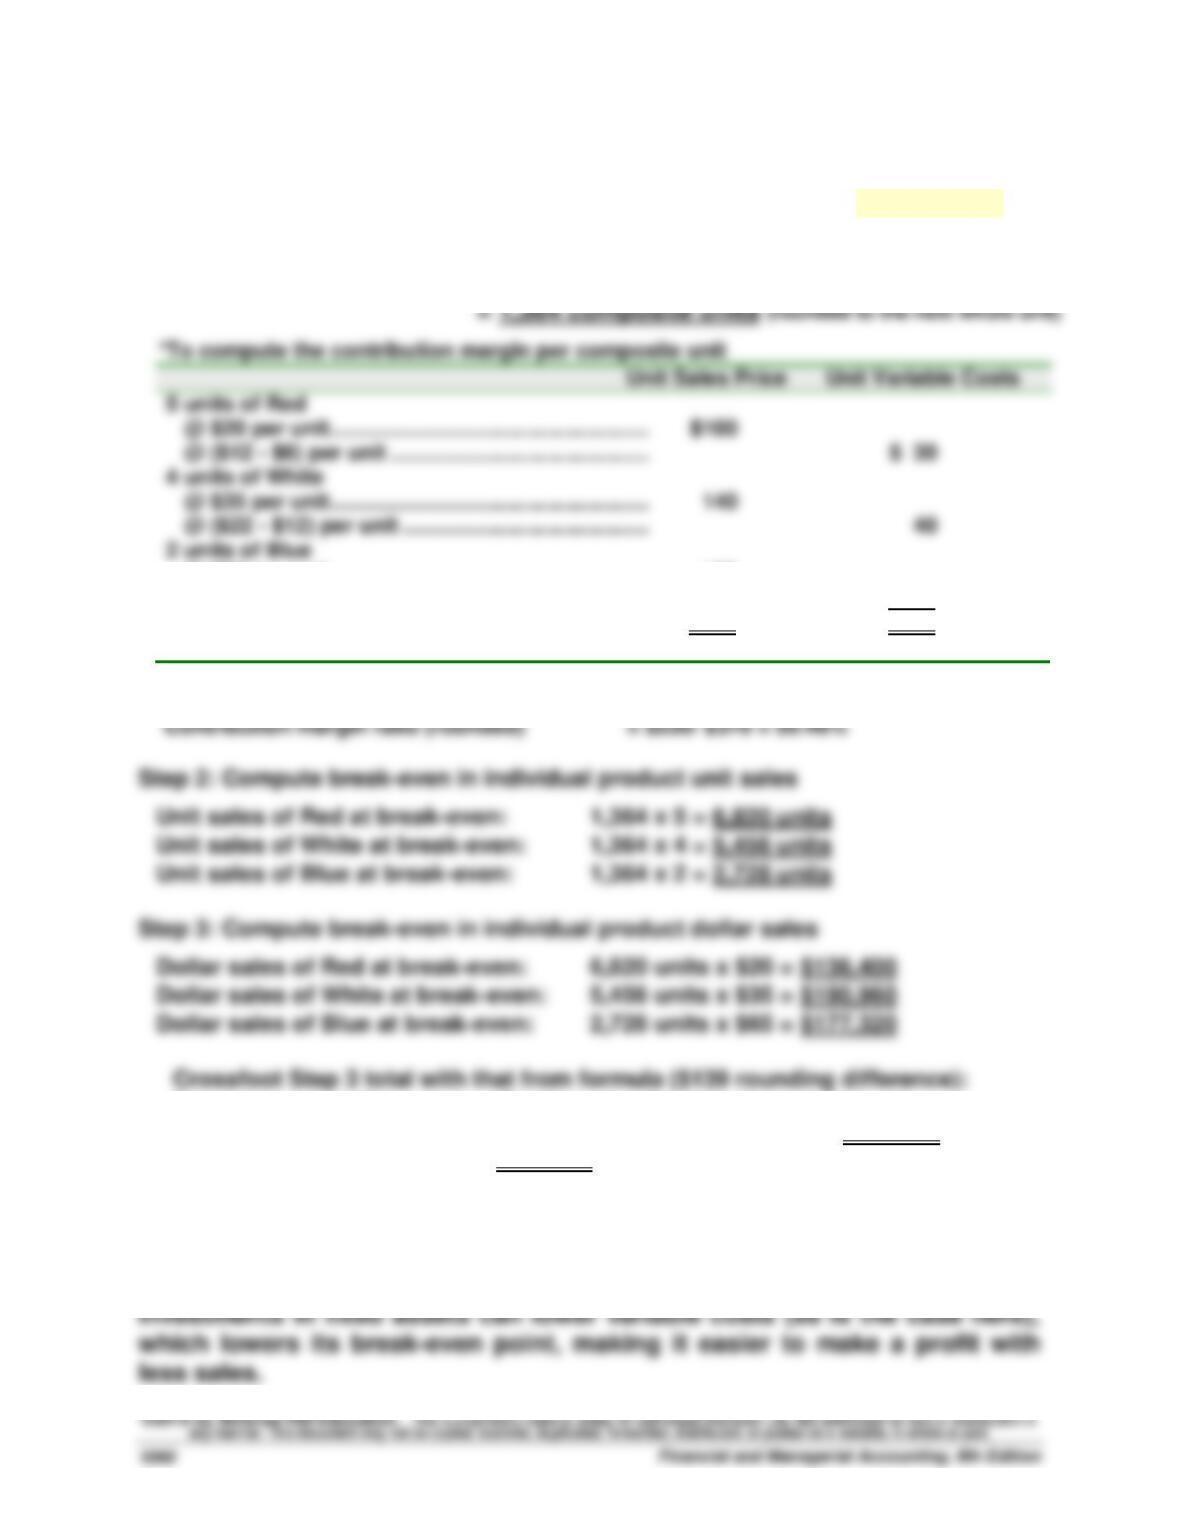
Part 2 BREAK–EVEN ANALYSIS ASSUMING USE OF NEW MATERIALS
Step 1: Compute break-even in composite units—Use equation in Exhibit 18.29
Break-even in composite units = Fixed costs/Contribution margin per composite unit
= ($250,000 + $50,000) / $220*
Problem 18-1B (25 minutes)
Parts 1 and 2
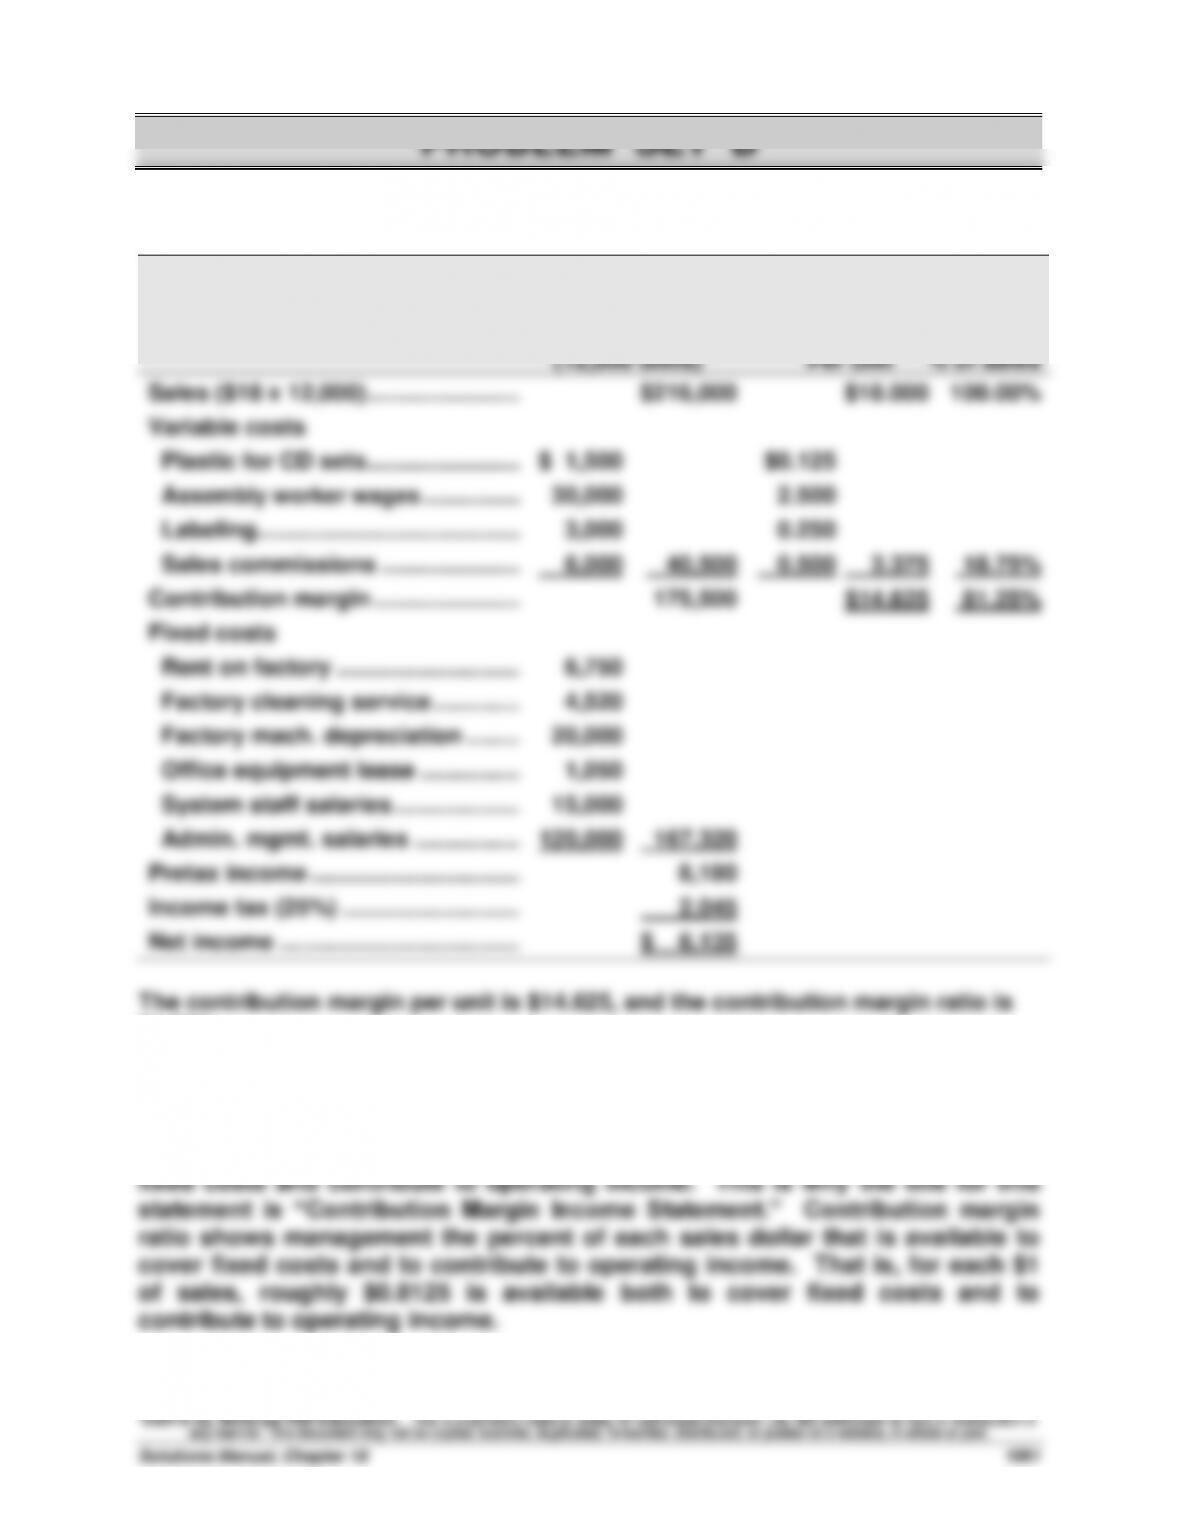
Gilmore Company
Contribution Margin Income Statement
For Year Ended December 31, 2015
(12,000 units) Per unit % of sales
Sales ($18 x 12,000) ………………….…….
$216,000
$18.000
100.00%
Variable costs
Plastic for CD sets ………………….…….
$ 1,500
$0.125
Assembly worker wages …………..…….
30,000
2.500
Labeling………………………………..…….
3,000
0.250
Sales commissions ………………..…….
6,000
40,500
0.500
3.375
18.75%
Contribution margin ……………………….
175,500
$14.625
81.25%
Fixed costs
Rent on factory ………………………..…
6,750
Factory cleaning service …………..…….
4,520
Factory mach. depreciation …………….
20,000
Office equipment lease …………….…….
1,050
System staff salaries ………………..…….
15,000
Admin. mgmt. salaries ……………..…….
120,000
167,320
Pretax income ………………………………….
8,180
Income tax (25%) ……………………….….
2,045
Net income ………………………………..…….
$ 6,135
The contribution margin per unit is $14.625, and the contribution margin ratio is
81.25%.
Part 3 Analysis Component
Contribution margin shows how much of total sales are available to cover
Problem 18-2B (45 minutes)
Parts 1 and 2
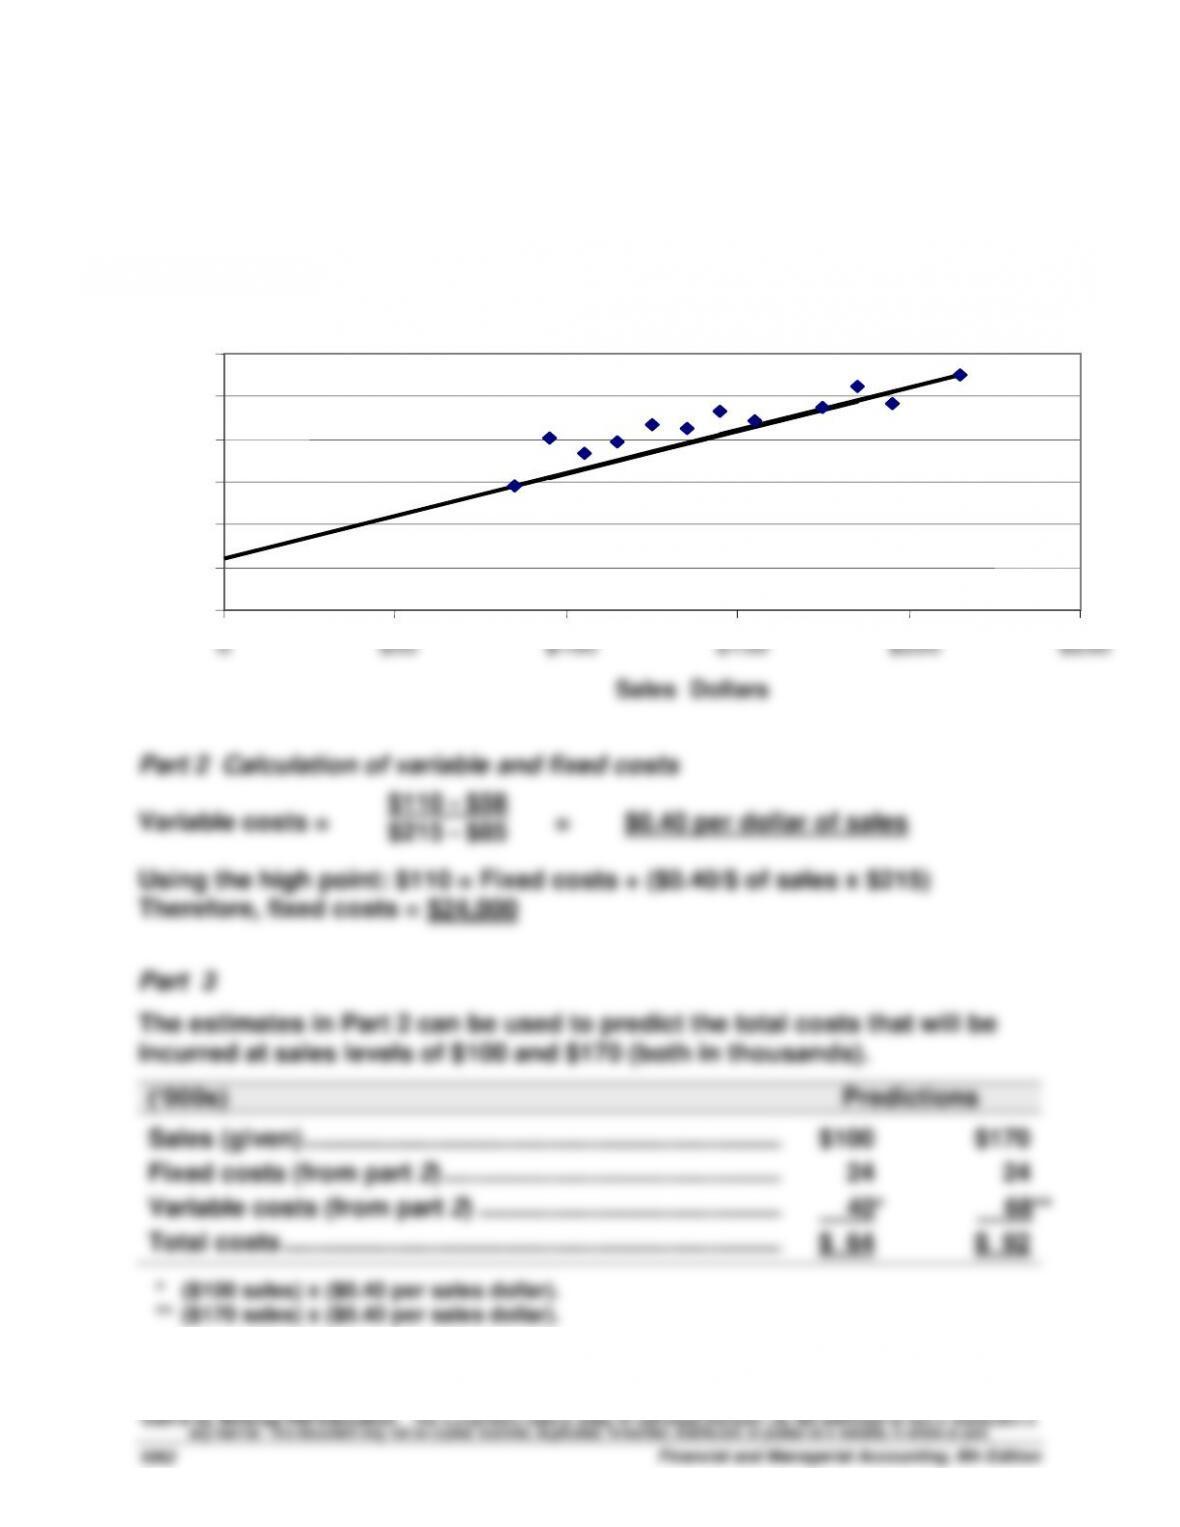
The scatter diagram and its estimated line of cost behavior appear below.
Sales and cost amounts are in thousands of dollars.
Sun Company
0
20
40
60
80
100
$120
0
$50
$100
$150
$200
$250
Sales Dollars
Total
Costs
Problem 18-3B (40 minutes)
Part 1
(a) Instructor note: Use the equation in Exhibit 18.11
Break-even in unit sales = Fixed costs / Contribution margin per unit
Problem 18-3B (Continued)
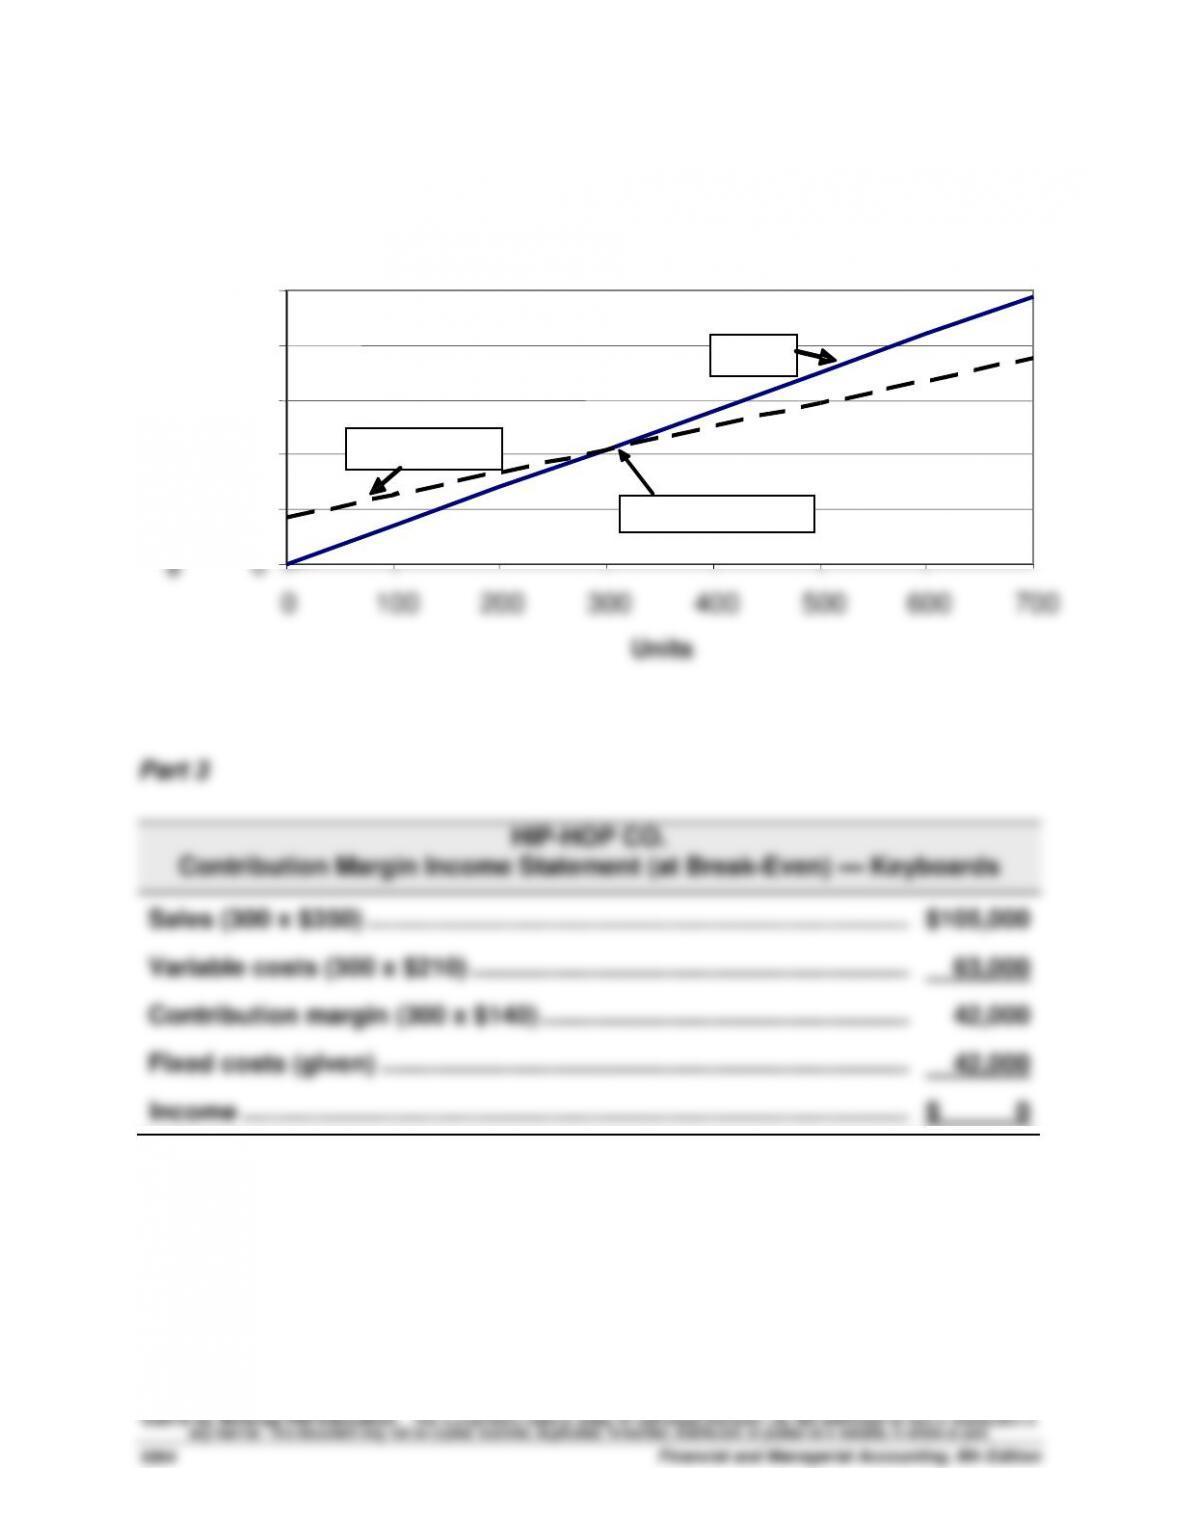
Part 2
Hip-Hop Company CVP chart
$ 0
$50,000
$100,000
$150,000
$200,000
$250,000
0
100
200
300
400
500
600
700
Units
Sales
Total Costs
Breakeven point
Problem 18-4B (75 minutes)
Part 1 Instructor note: Use the equation in Exhibit 18.12
2015 break-even in dollar sales = Fixed costs / Contribution margin ratio
= $200,000 / 20%*
= $1,000,000
Problem 18–4B (Continued)
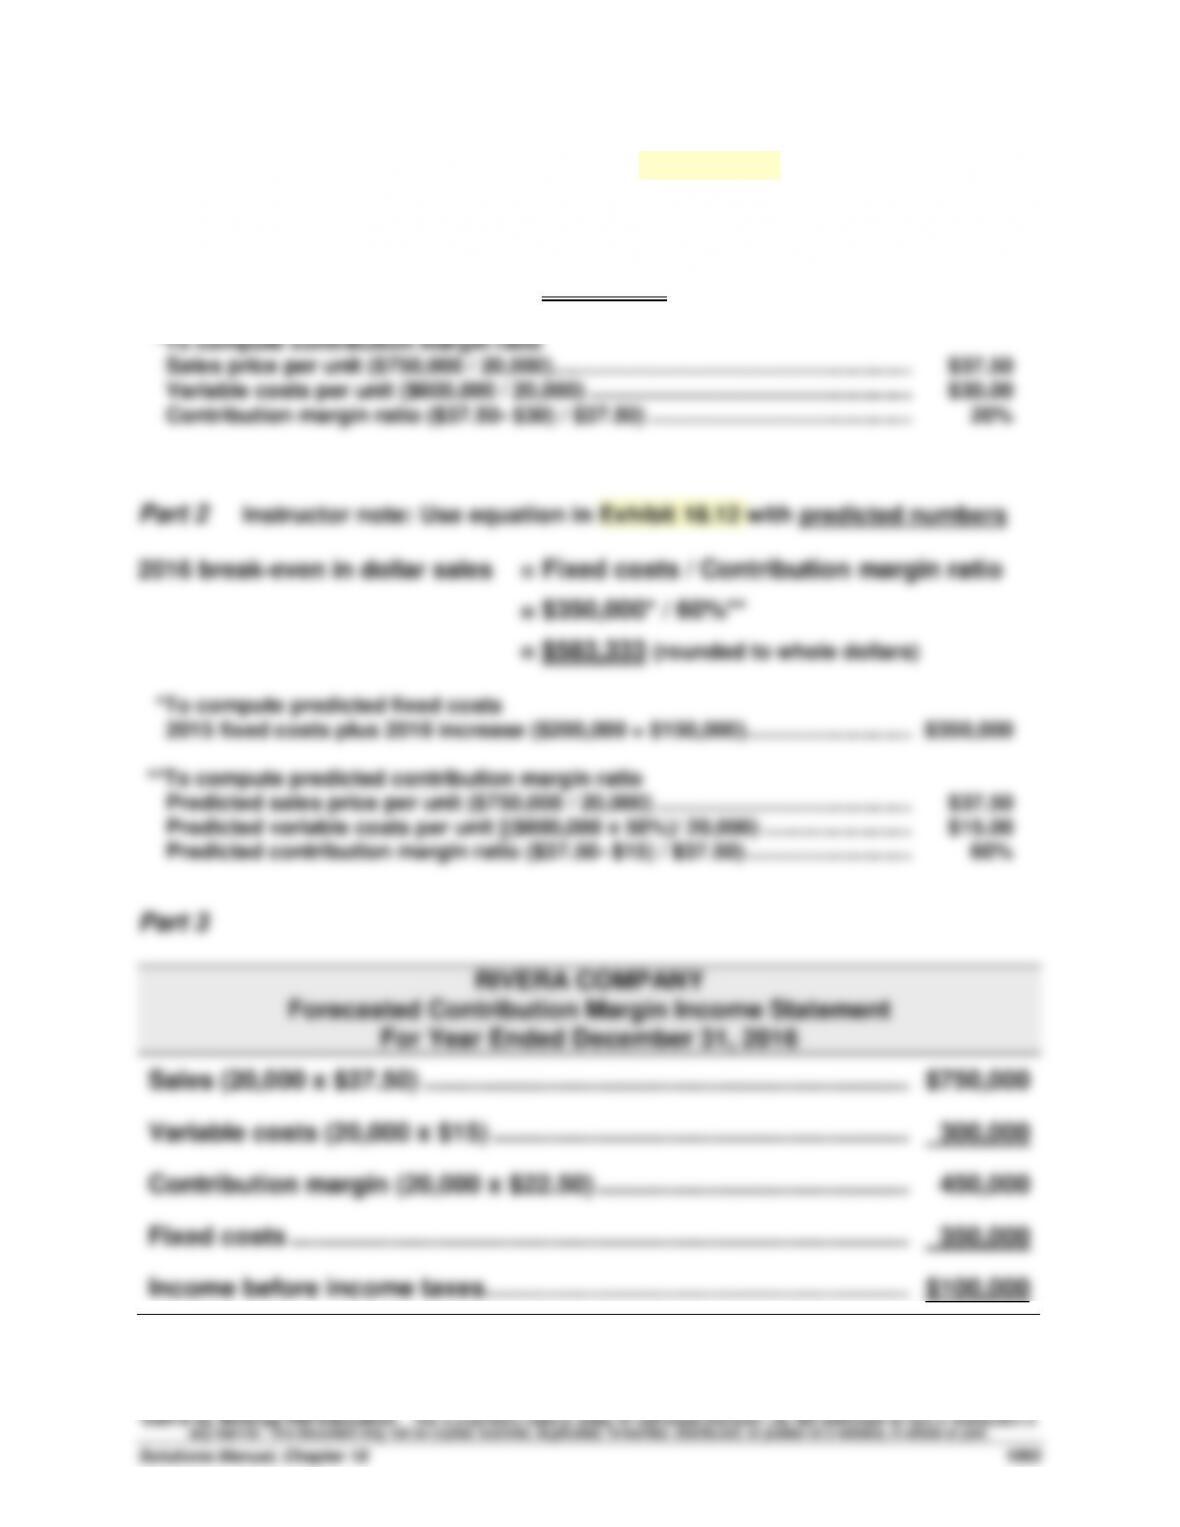
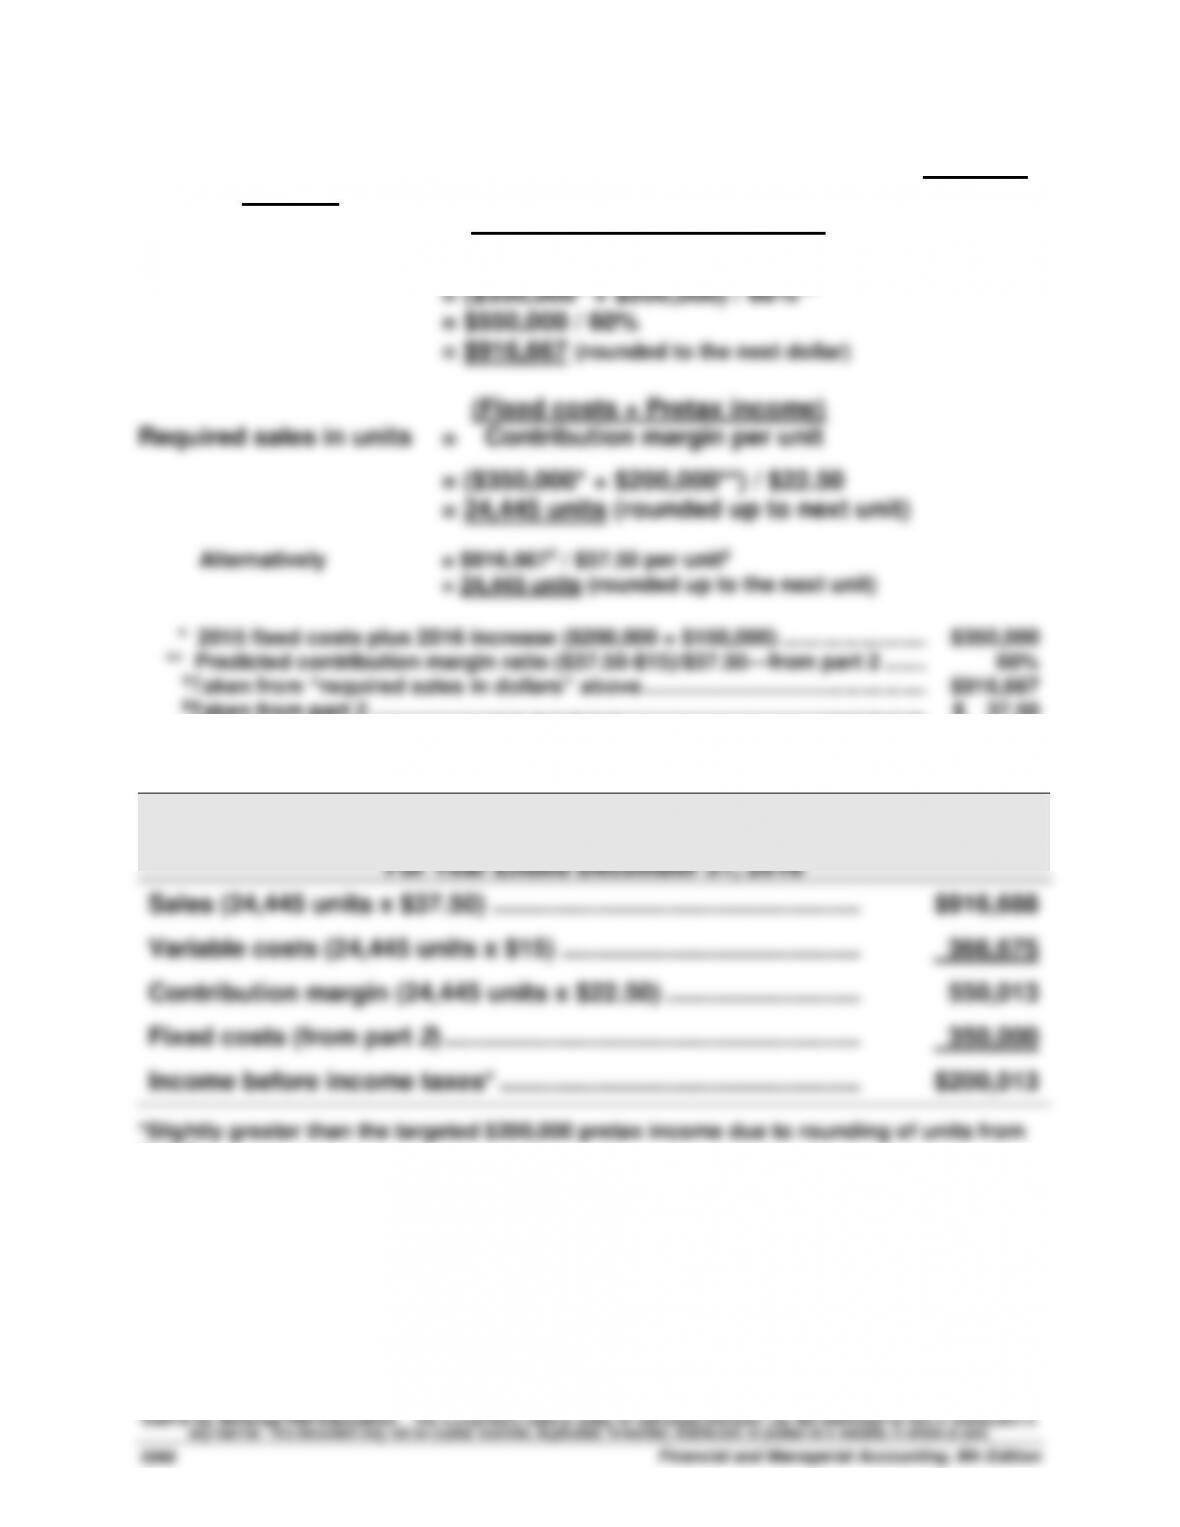
Part 4 Instructor note: Use equations in Exhibit 18.22 and 18.23 with predicted
numbers
(Fixed costs + Pretax income)
Required sales in dollars = Contribution margin ratio
Problem 18-5B (65 minutes)
Part 1 Instructor note: Use the equation in Exhibit 18.12
Break-even in dollar sales = Fixed costs / Contribution margin ratio
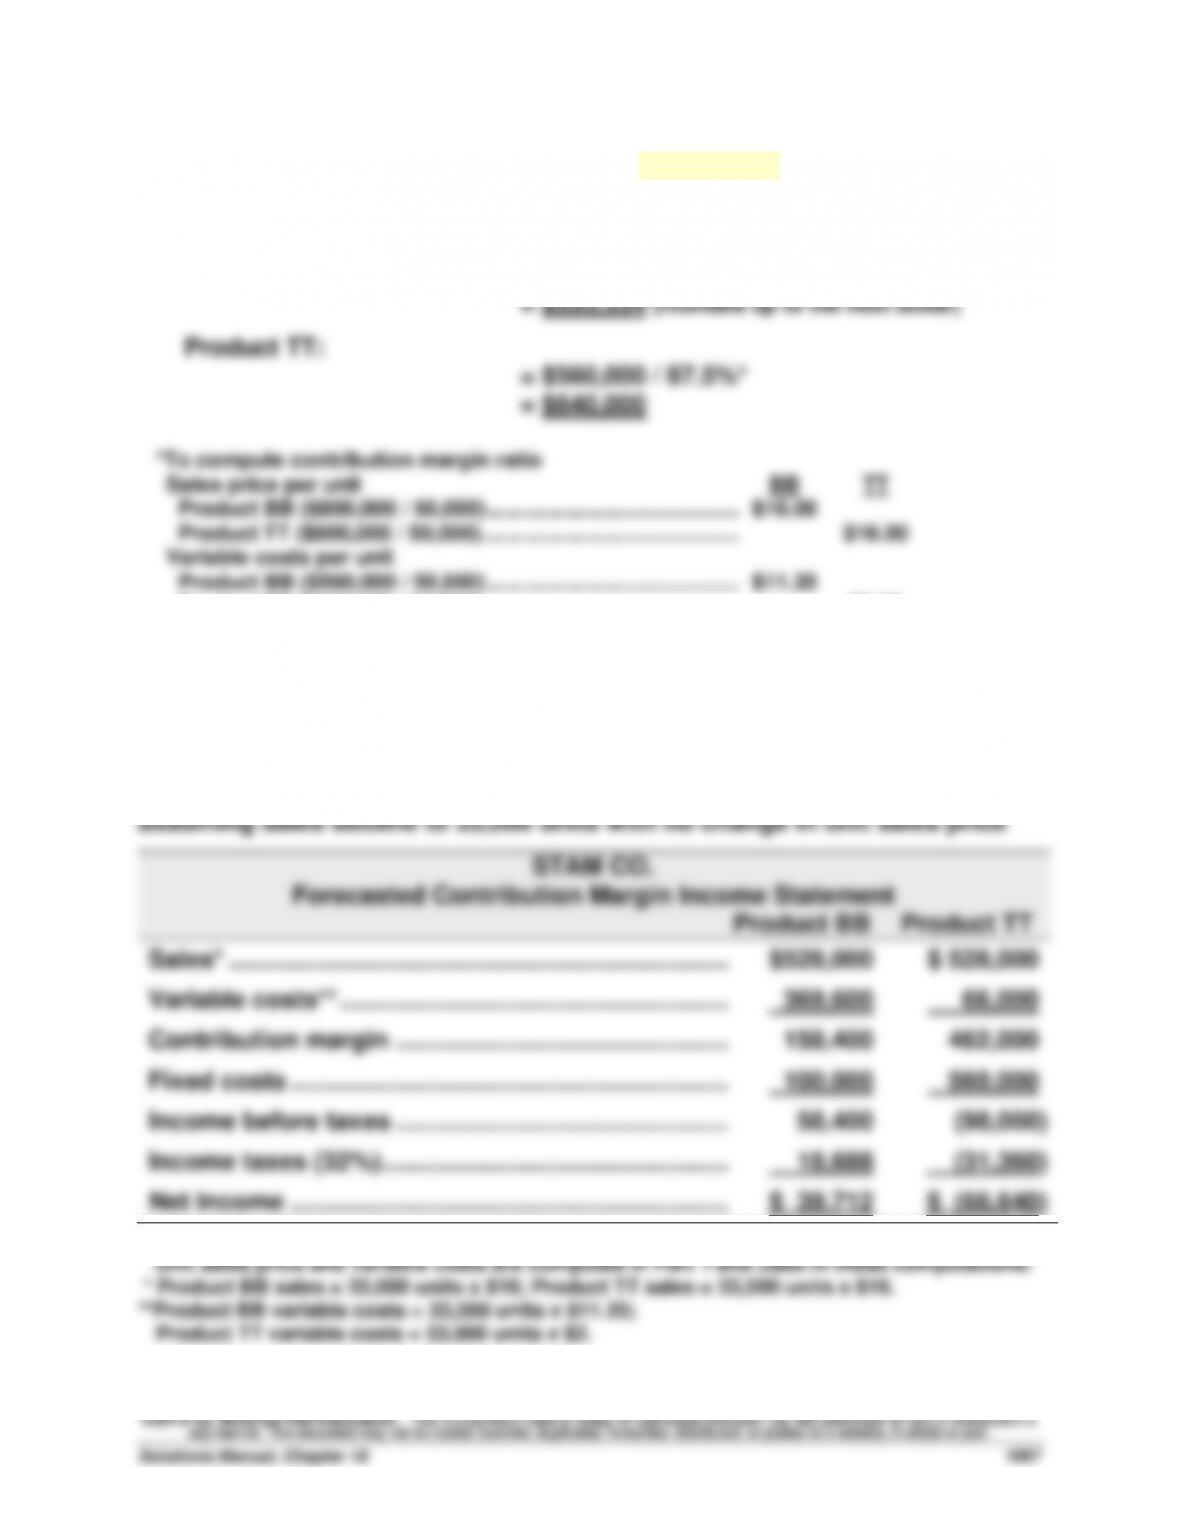
Product BB:
= $100,000 / 30%*
Sales price per unit
Product BB ($800,000 / 50,000) …………………………..……….………………….
Product TT ($800,000 / 50,000)…………………………………….…………………
BB
$16.00
TT
$16.00
Variable costs per unit
Product BB ($560,000 / 50,000) …………………………..……….………………….
Product TT ($100,000 / 50,000)…………………………………….…………………
$11.20
$2.00
Contribution margin ratio
Product BB ($16.00 – $11.20) / $16.00) …………………………..
Product TT ($16 – $2) / $16) ……………………………………………………….
30.0%
87.5%
Part 2
Forecasted contribution margin income statements for each product
Problem 18–5B (Continued)
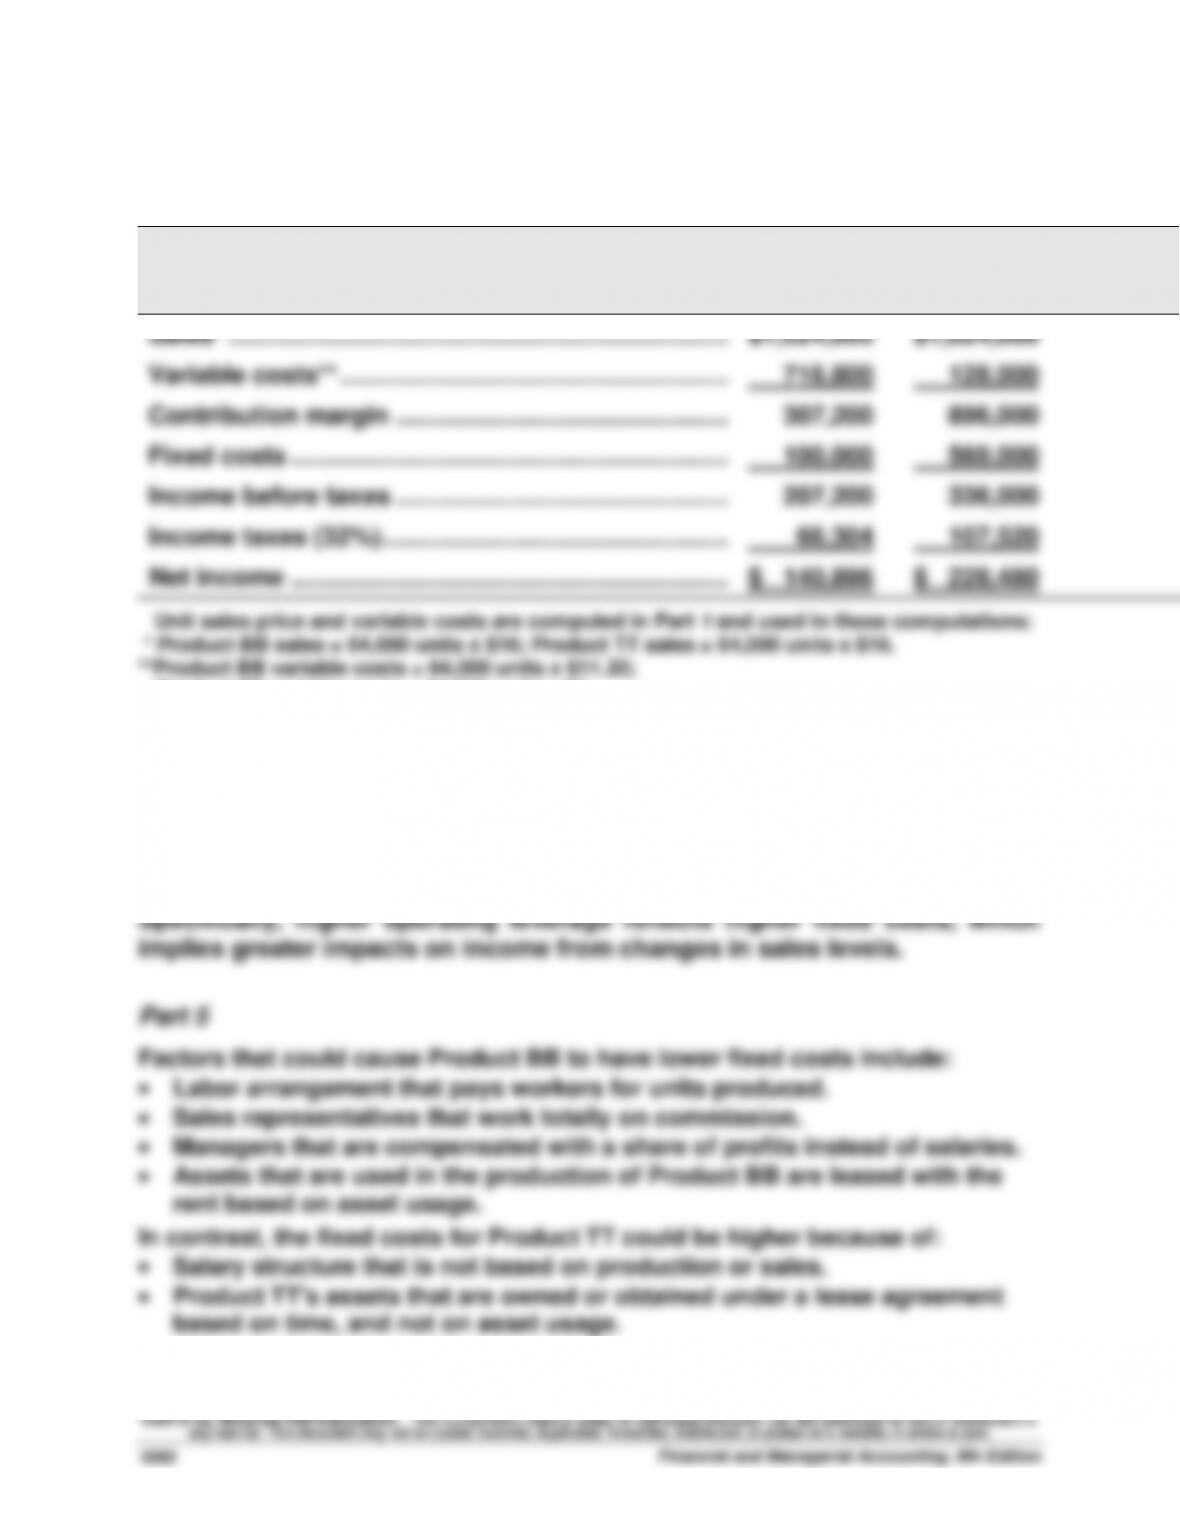
Forecasted contribution margin income statements for each product
assuming sales increase to 64,000 units with no change in unit sales price:
STAM CO.
Forecasted Contribution Margin Income Statement
Product BB
Product TT
Sales* ……………………………………………………….……..…
$1,024,000
$1,024,000
Variable costs** ………………………………………………..…
716,800
128,000
Contribution margin ……………………………………………
307,200
896,000
Fixed costs ……………………………………………………….
100,000
560,000
Income before taxes ……………………………………………
207,200
336,000
Income taxes (32%)…………………………………………..…
66,304
107,520
Net income ……………………………………………………….
$ 140,896
$ 228,480
Unit sales price and variable costs are computed in Part 1 and used in these computations:
* Product BB sales = 64,000 units x $16; Product TT sales = 64,000 units x $16.
**Product BB variable costs = 64,000 units x $11.20;
Product TT variable costs = 64,000 units x $2.
Part 4
If sales were to greatly increase, Product TT would experience the greater
increase in income because it would gain more contribution margin per
unit than Product BB ($14 for TT versus $4.80 for BB). Examining the
operating leverage of these two products would yield the same inference.