Exercise 18-25 (10 minutes)
1. Degree of operating leverage = Total contribution margin
2. If sales decrease by 5%, then pretax income will decrease by 4.0 x 5%,
3. If sales decrease by 5%, a total of 9,120 (computed as 9,600 x 95%)
units will be sold.
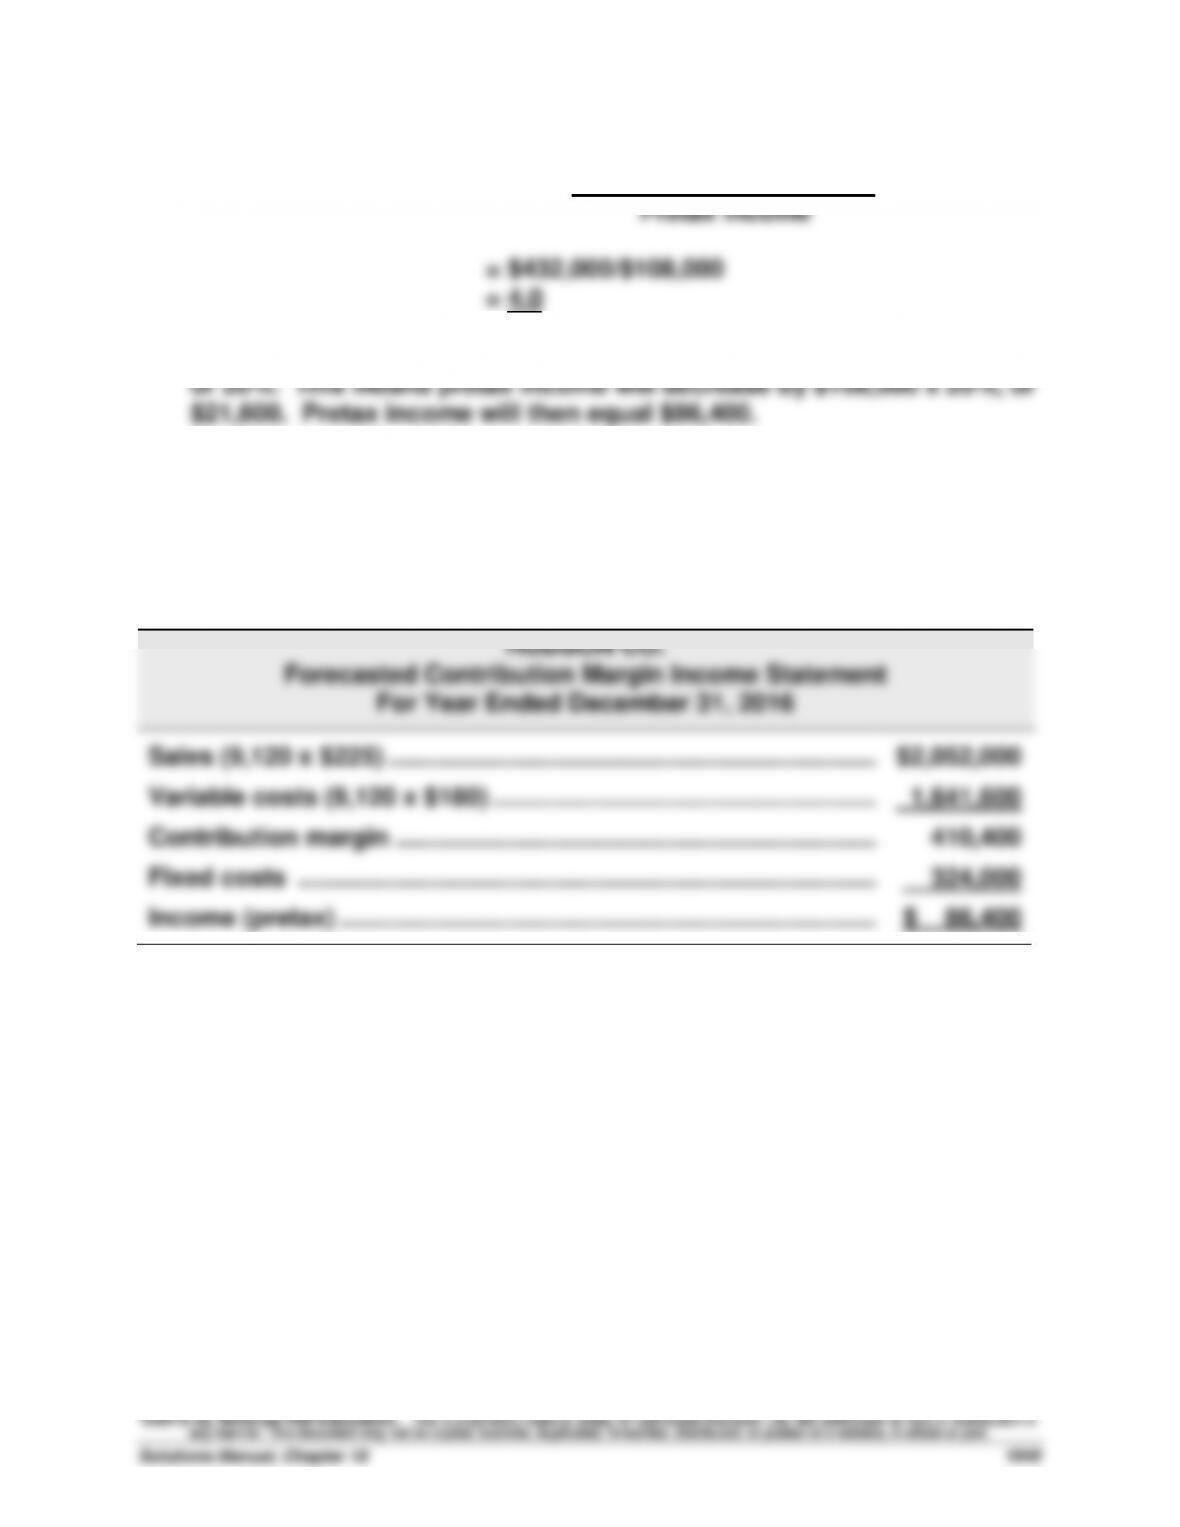
Contribution margin income statement, assuming 5% sales decrease:
HUDSON CO.
Forecasted Contribution Margin Income Statement
For Year Ended December 31, 2016
Sales (9,120 x $225) ……………………………………………………………..….
$2,052,000
Variable costs (9,120 x $180) ………………………………………………..….
1,641,600
Contribution margin …………………………………………………………….….
410,400
Fixed costs …………………………..…………………………………………….….
324,000
Income (pretax) ……………………………………………………………………….
$ 86,400
Problem 18–1A (25 minutes)
Parts 1 and 2
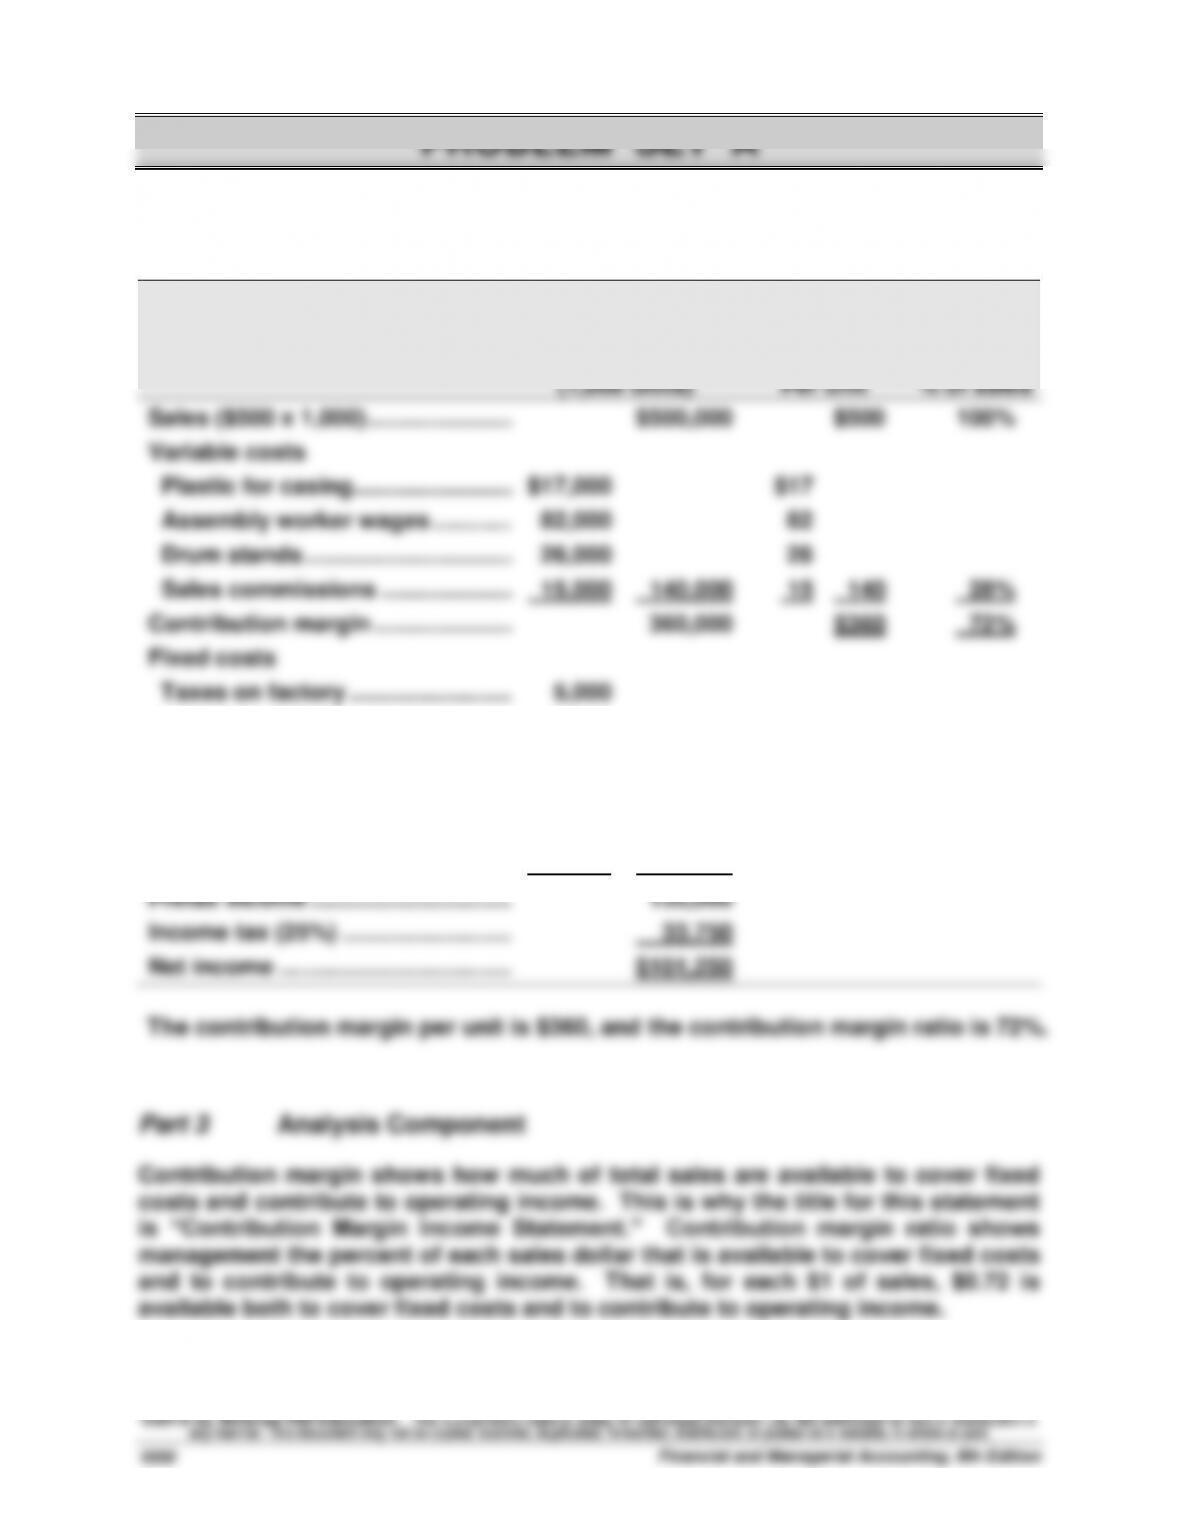
Tight Drums Company
Contribution Margin Income Statement
For Year Ended December 31, 2015
(1,000 units) Per unit % of sales
Sales ($500 x 1,000) ……………………….
$500,000
$500
100%
Variable costs
Plastic for casing …………………..…….
$17,000
$17
Assembly worker wages ………………..
82,000
82
Drum stands …………………………..
26,000
26
Sales commissions ……………….…….
15,000
140,000
15
140
28%
Contribution margin ………………..…….
360,000
$360
72%
Fixed costs
Taxes on factory …………………….…….
5,000
Factory maintenance ……………………..
10,000
Factory machinery deprec. ……..……..
40,000
Sales equipment lease …………………..
10,000
Accounting staff salaries ………..……..
35,000
Admin. mgmt. salaries …………………..
125,000
225,000
Pretax income …………………………..
135,000
Income tax (25%) ……………………..……
33,750
Net income ……………………………………..
$101,250
Problem 18-2A (45 minutes)
Parts 1 and 2
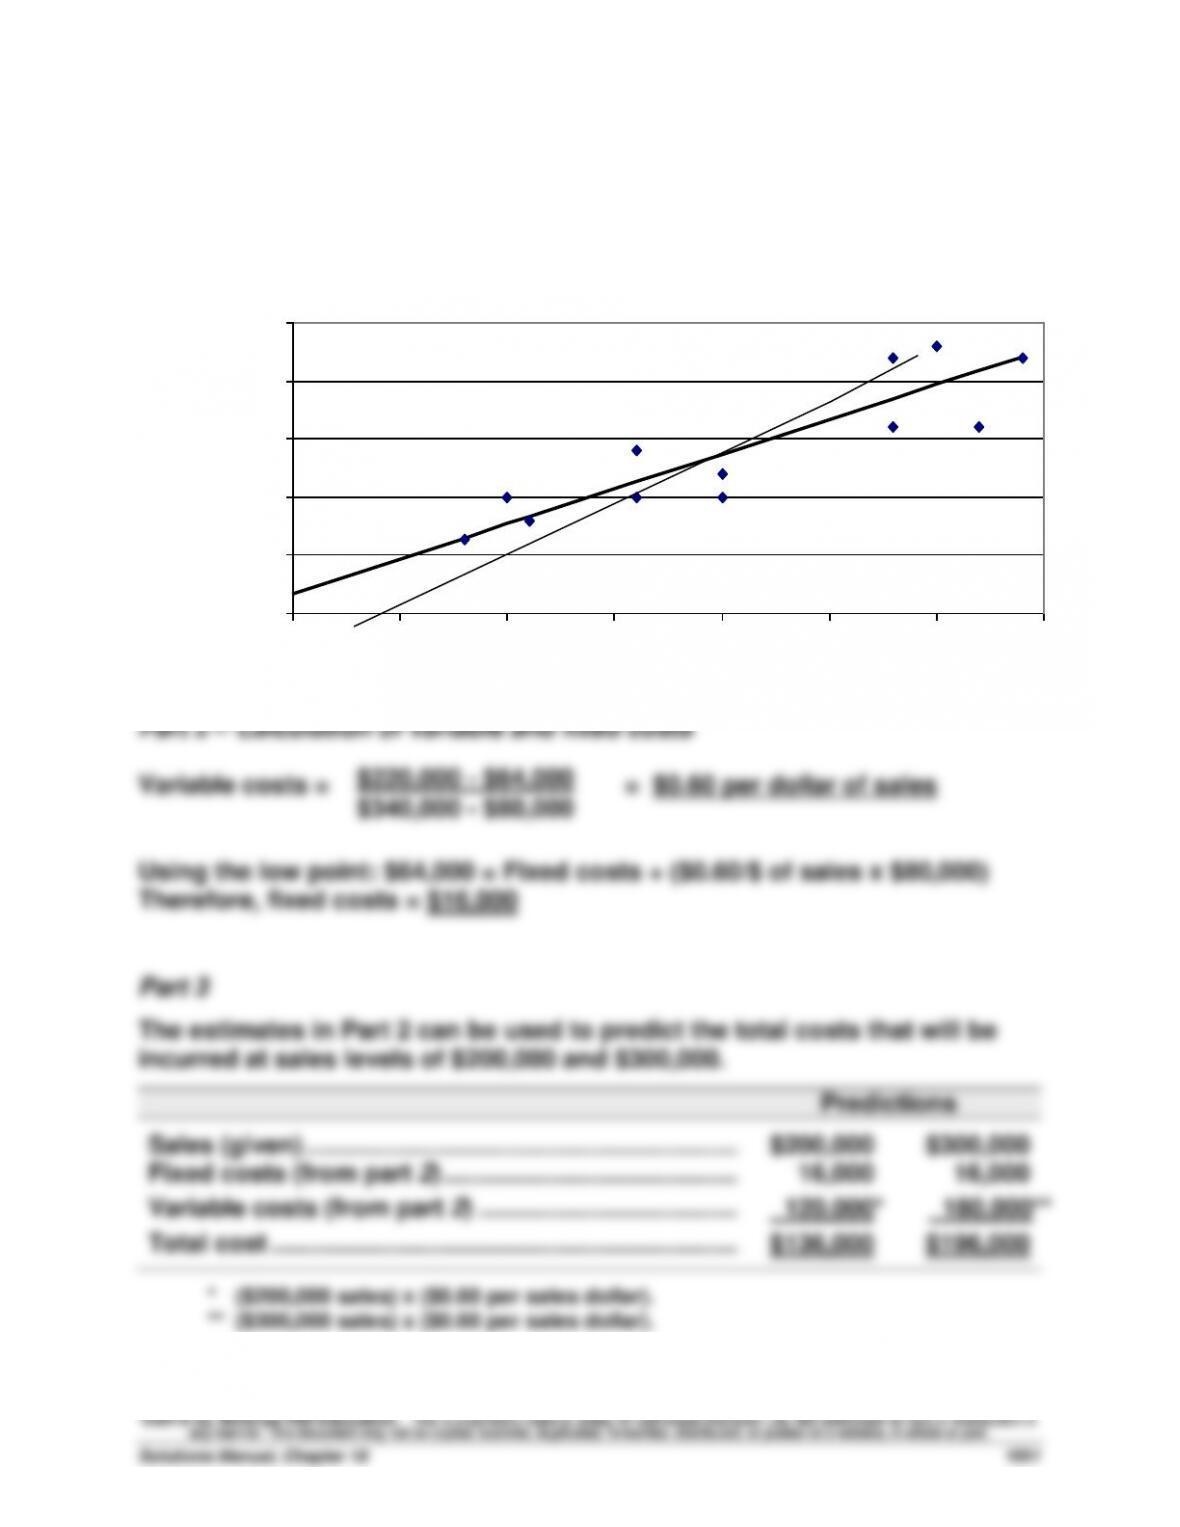
The scatter diagram and its estimated line of cost behavior appear below.
$0
$50,000
$100,000
$150,000
$200,000
$250,000
$0 $50,000 $100,000 $150,000 $200,000 $250,000 $300,000 $350,000
Sales
Total cost
Alden Co.
Problem 18-3A (40 minutes)
Part 1
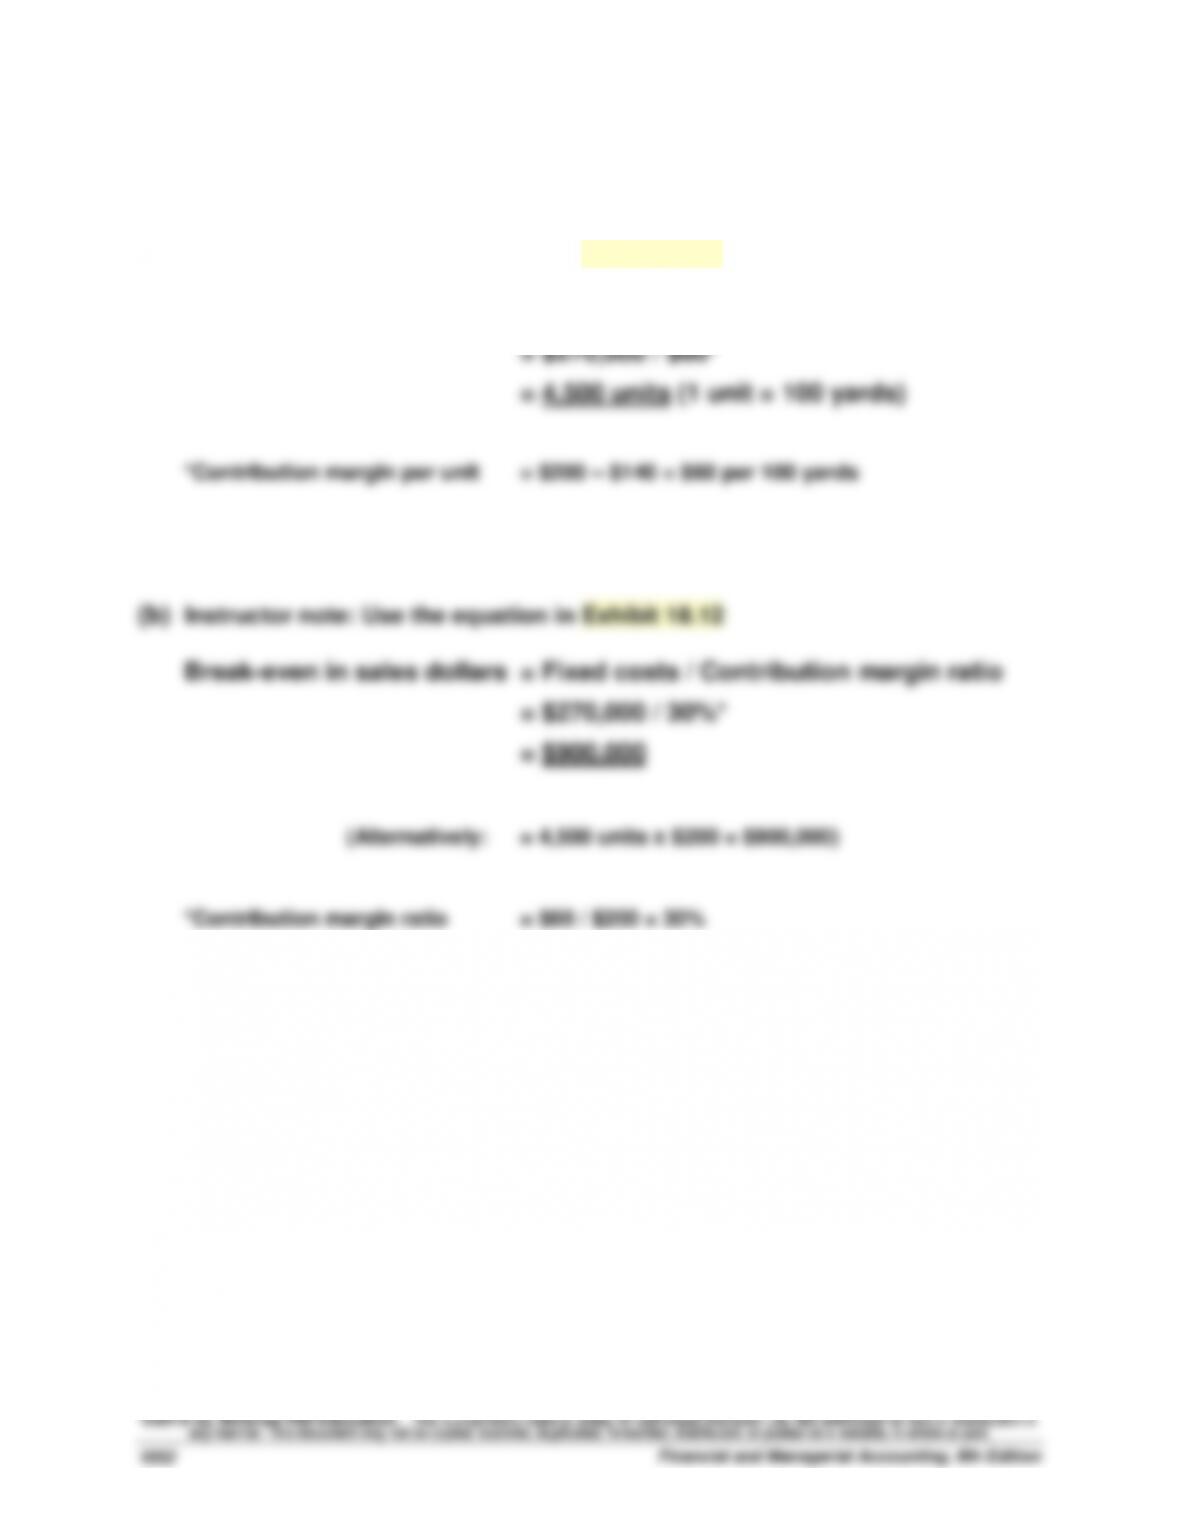
(a) Instructor note: Use the equation in Exhibit 18.11
Break-even in sales units = Fixed costs / Contribution margin per unit
Problem 18-3A (Continued)
Part 2
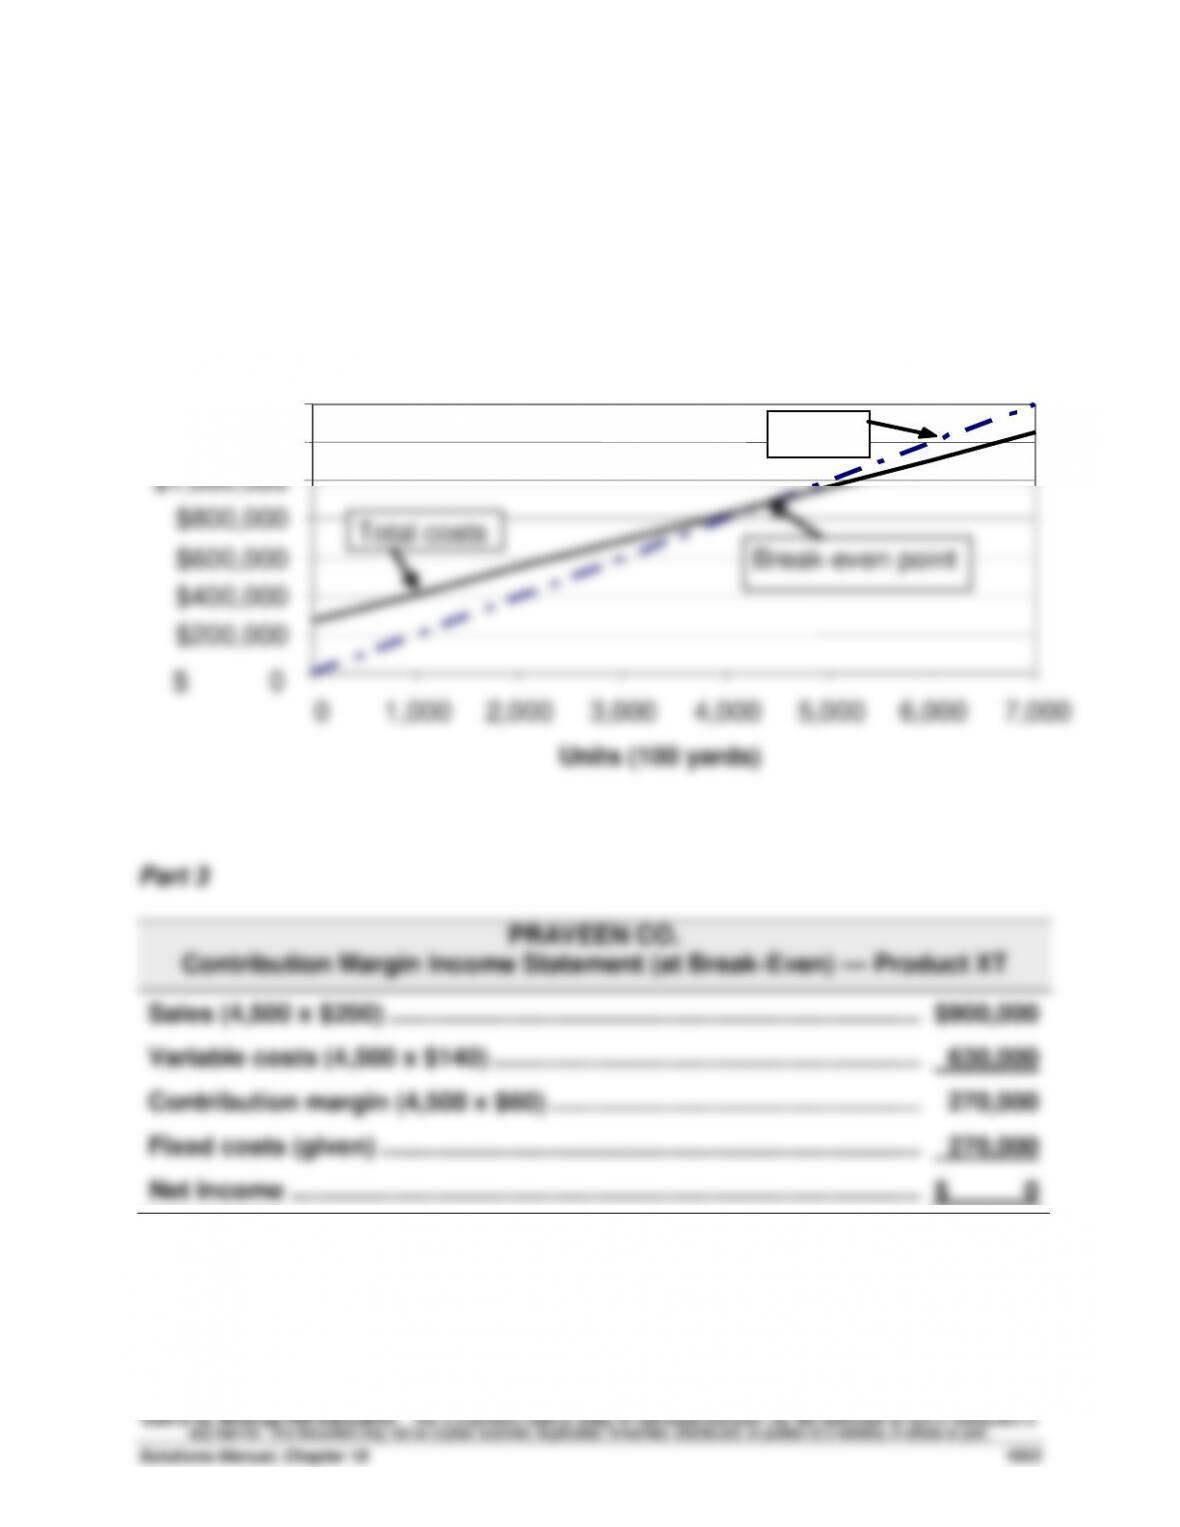
CVP Chart for Praveen Company
$ 0
$200,000
$400,000
$600,000
$800,000
$1,000,000
$1,200,000
$1,400,000
0
1,000
2,000
3,000
4,000
5,000
6,000
7,000
Units (100 yards)
Total costs
Sales
Break-even point
Problem 18-4A (75 minutes)
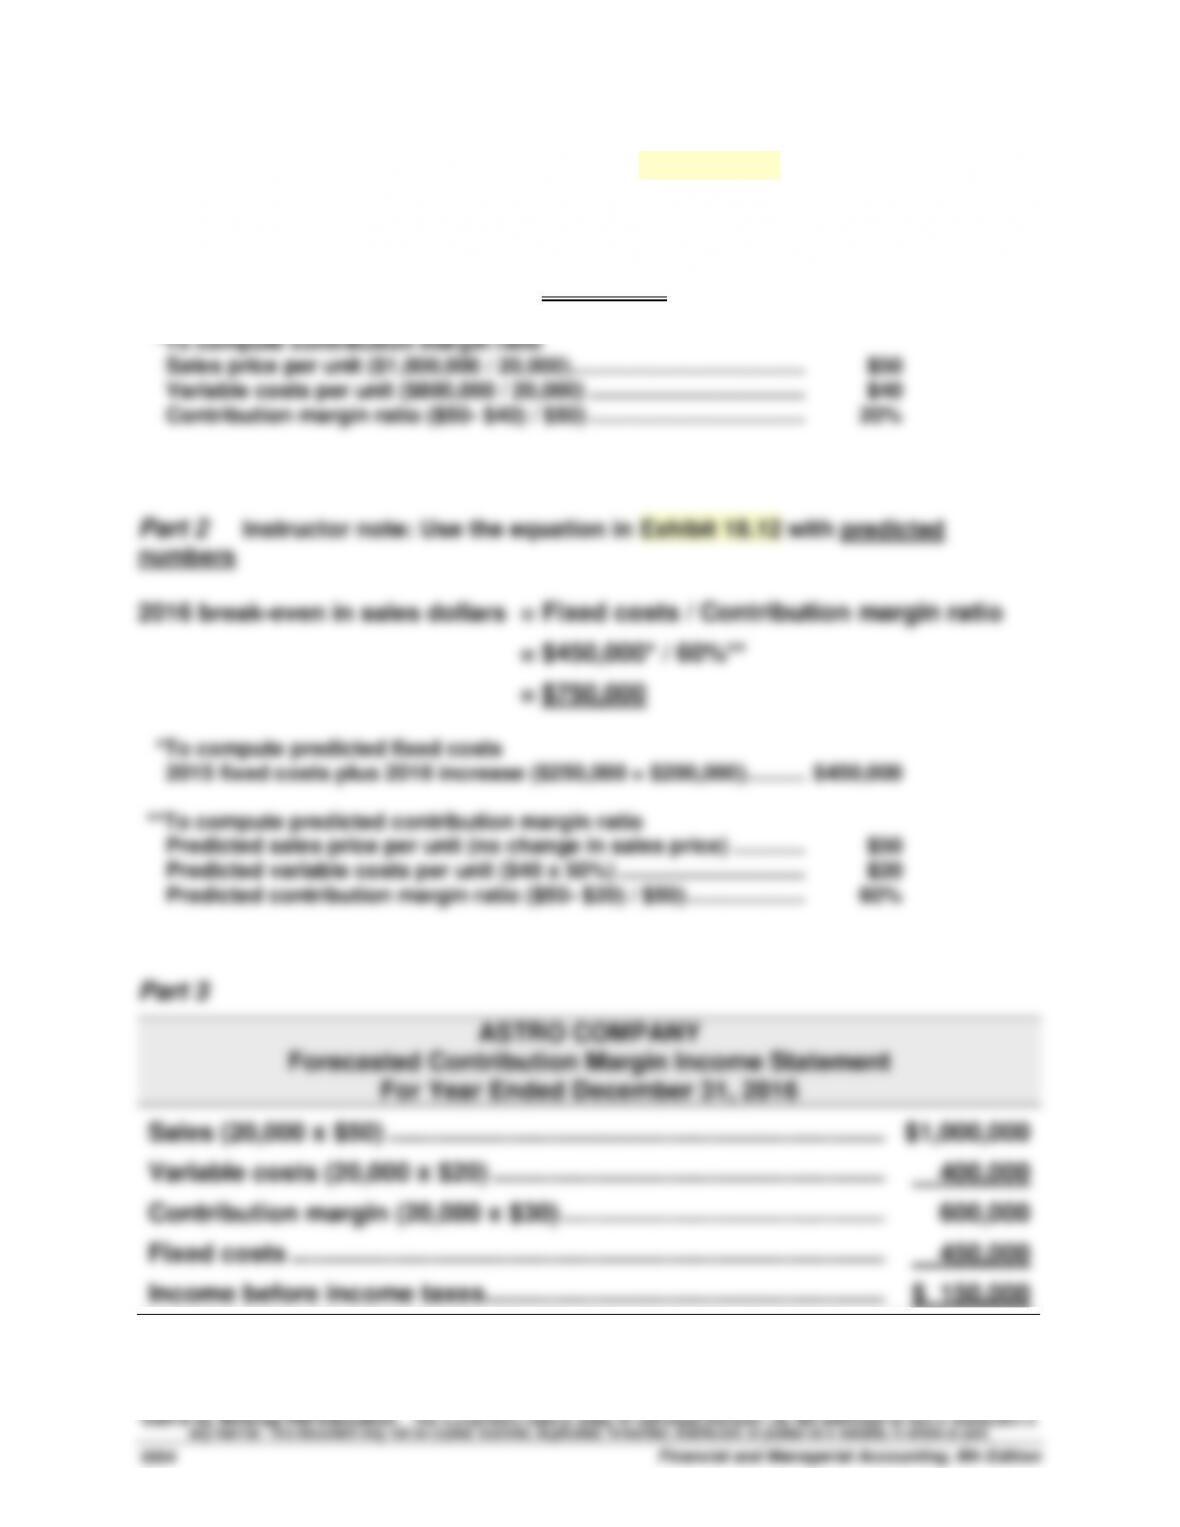
Part 1 Instructor note: Use the equation in Exhibit 18.12
2015 break-even in sales dollars = Fixed costs / Contribution margin ratio
= $250,000 / 20%*
= $1,250,000
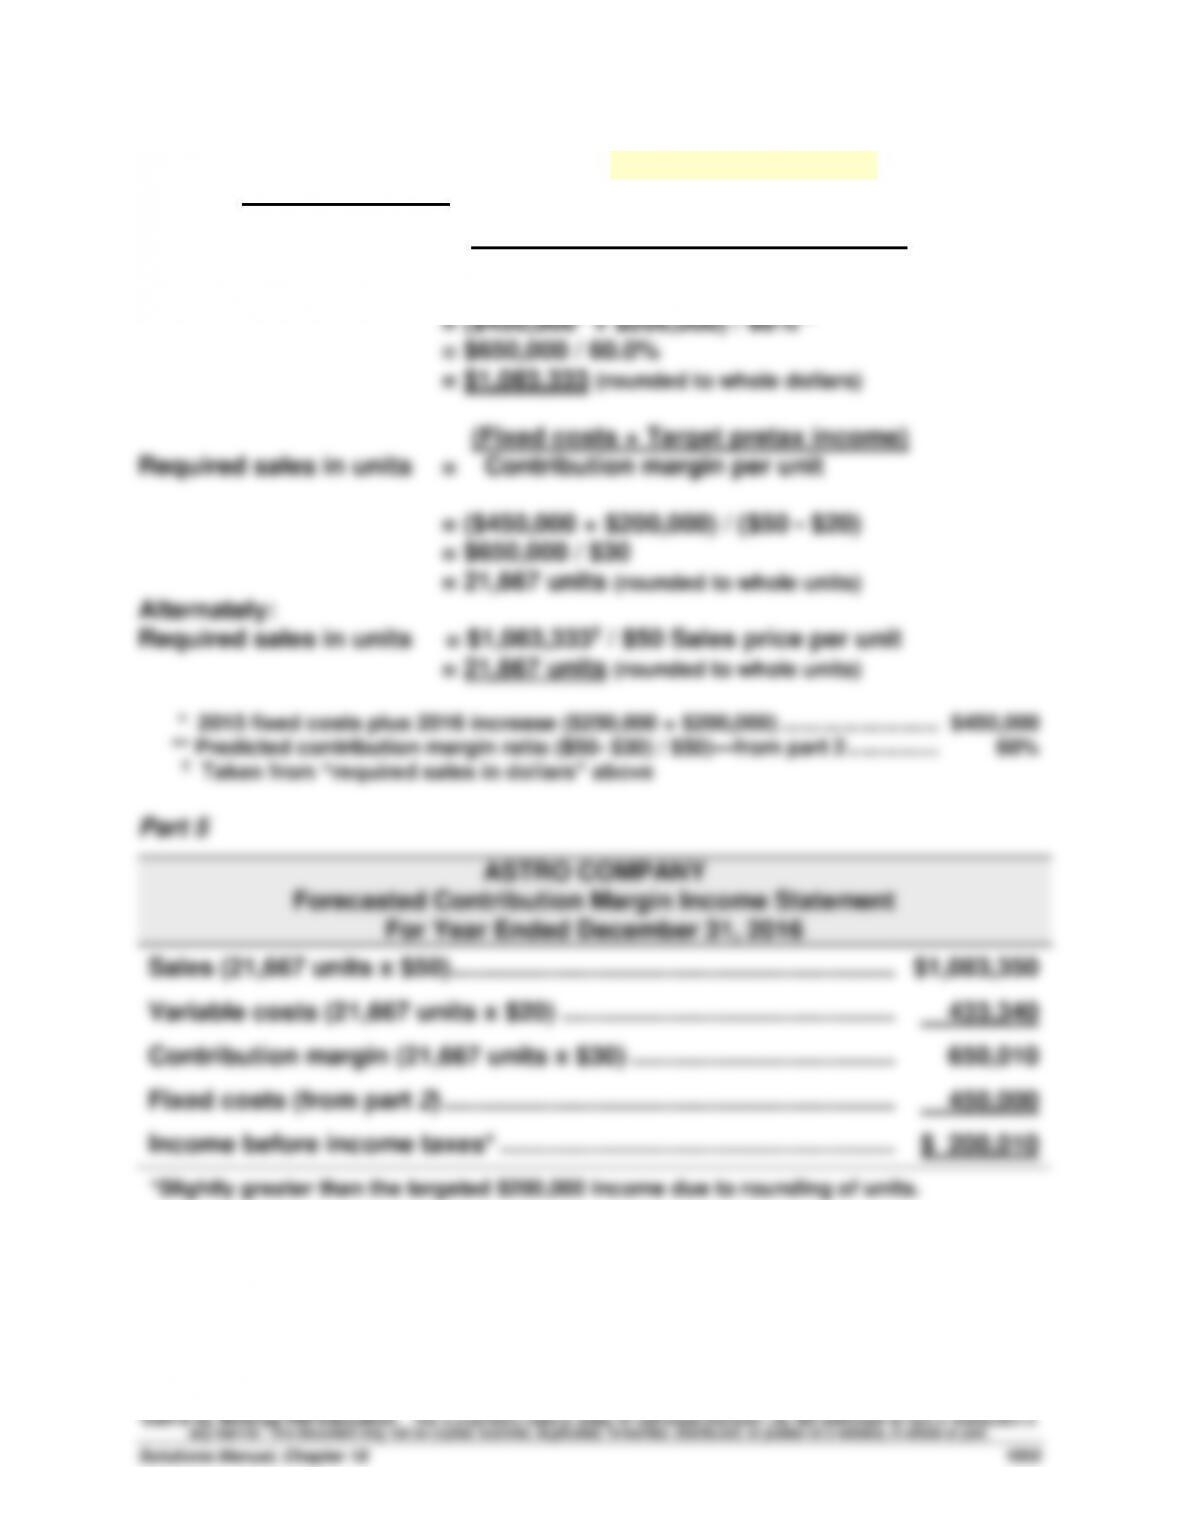
Problem 18–4A (Continued)
Part 4 Instructor note: Use equations in Exhibits 18.22 and 18.23 with
predicted numbers
(Fixed costs + Target pretax income)
Required sales in dollars = Contribution margin ratio
Problem 18-5A (65 minutes)
Part 1 Instructor note: Use the equation in Exhibit 18.12
Break-even in dollar sales = Fixed costs / Contribution margin ratio
Product T:
= $125,000 / 20%*
Sales price per unit
Product T ($2,000,000 / 50,000) ……………………………………………………….
Product O ($2,000,000 / 50,000) …………………………………..…………………..
__T__
$40
__O__
$40
Variable costs per unit
Product T ($1,600,000 / 50,000) ……………………………………………………….
Product O ($250,000 / 50,000) …………………………..…………………………..
$32
$ 5
Contribution margin ratio
Product T ($40- $32) / $40) ………………………………………….……………
Product O ($40- $5) / $40)……………………………………………………….
20.0%
87.5%
Part 2
Forecasted contribution margin income statements for each product
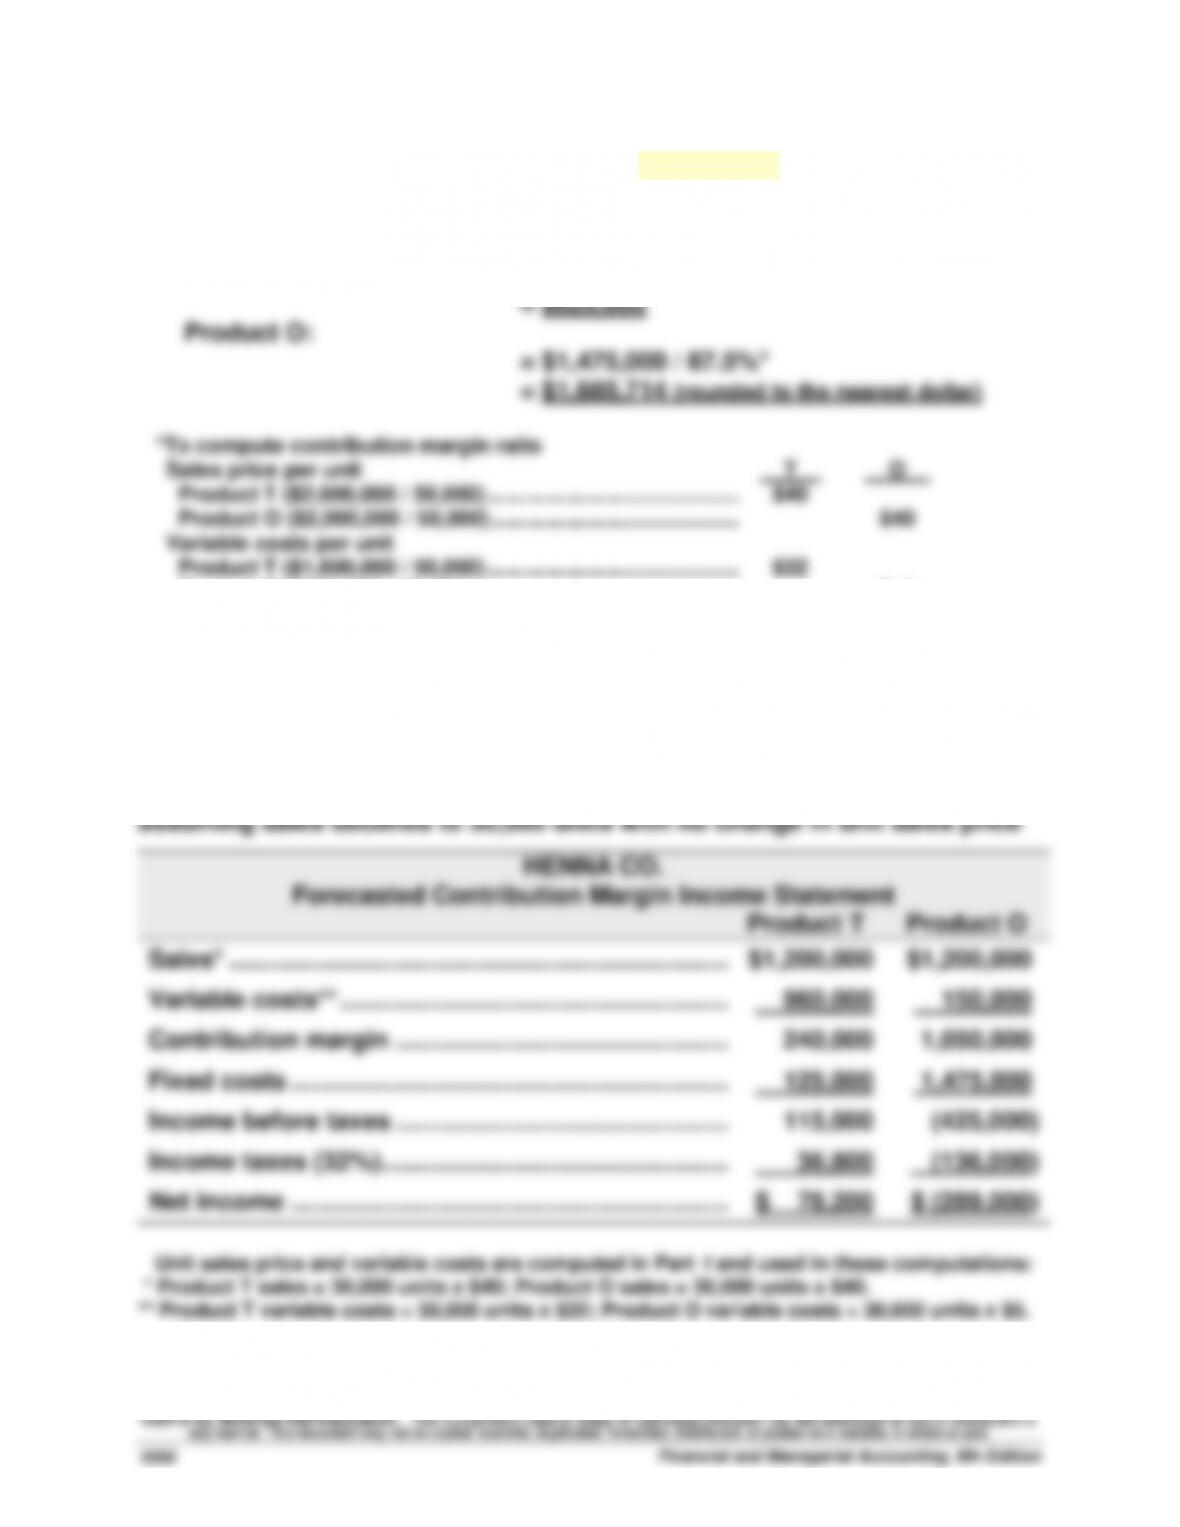
Problem 18-5A (Continued)
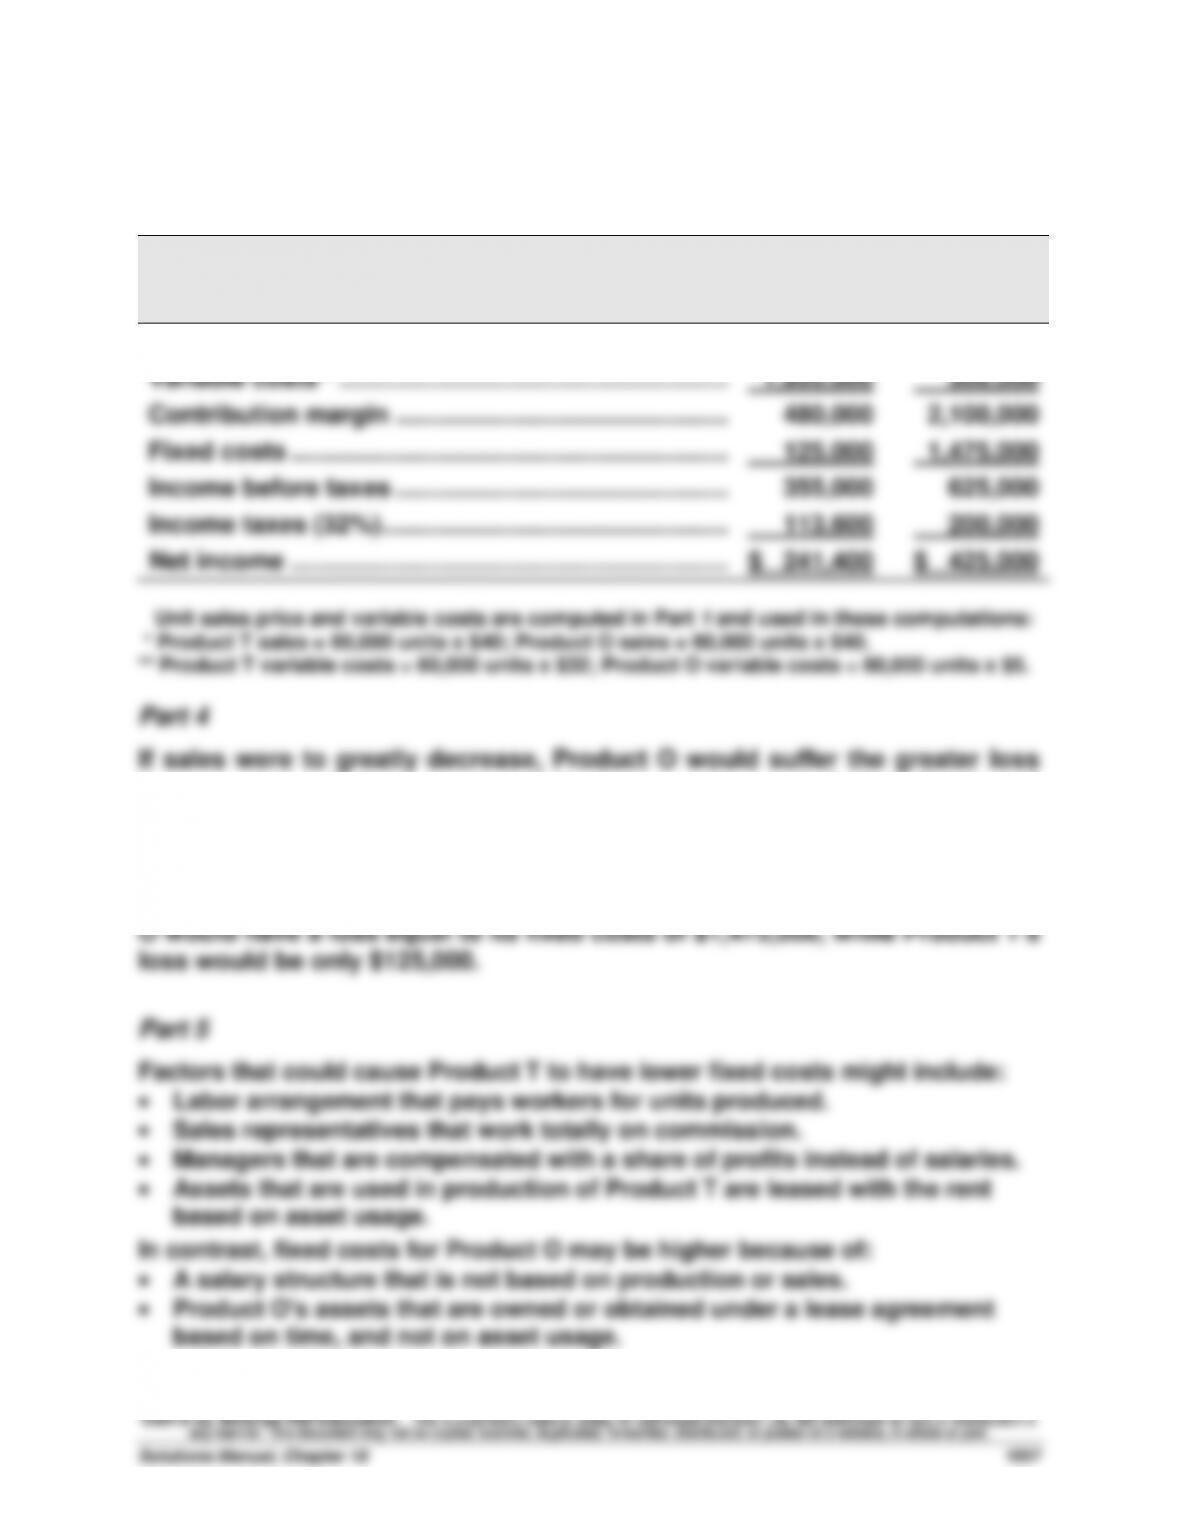
Part 3 Forecasted contribution margin income statements for each product
assuming sales increase to 60,000 units with no change in unit sales price
HENNA CO.
Forecasted Contribution Margin Income Statement
Product T
Product O
Sales* …………………………………………………………………
$2,400,000
$2,400,000
Variable costs** ………………………………………………..…
1,920,000
300,000
Contribution margin ……………………………………………
480,000
2,100,000
Fixed costs …………………………..…………………………..
125,000
1,475,000
Income before taxes ……………………………………………
355,000
625,000
Income taxes (32%)…………………………………………..…
113,600
200,000
Net income ……………………………………………………….
$ 241,400
$ 425,000
Unit sales price and variable costs are computed in Part 1 and used in these computations:
* Product T sales = 60,000 units x $40; Product O sales = 60,000 units x $40.
** Product T variable costs = 60,000 units x $32; Product O variable costs = 60,000 units x $5.
Part 4
If sales were to greatly decrease, Product O would suffer the greater loss
because it would lose more contribution margin per unit than Product T
($35 for O versus $8 for T). Examining the operating leverage of these two
products can yield the same inference. Specifically, higher operating
leverage reflects higher fixed costs, which implies greater impacts on
income from changes in sales levels. In the extreme, at zero sales, Product
Problem 18-6A (45 minutes)
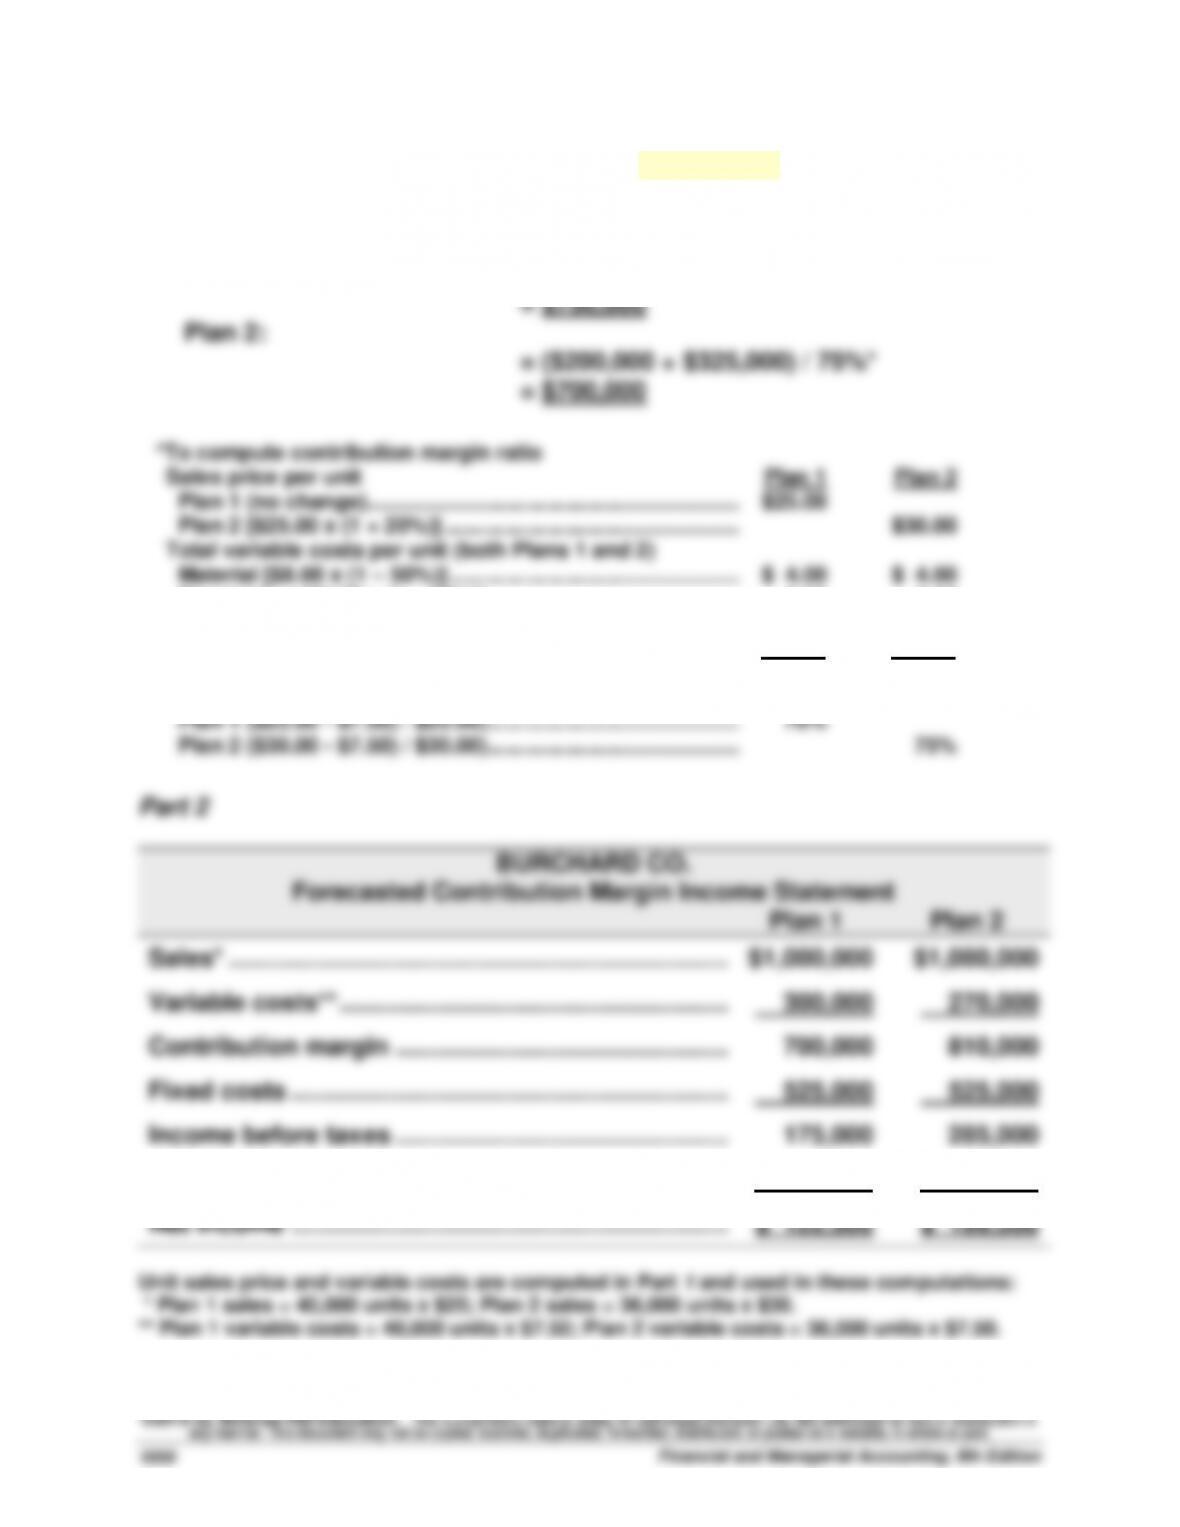
Part 1 Instructor note: Use the equation in Exhibit 18.12
Break-even in dollar sales = Fixed costs / Contribution margin ratio
Plan 1:
= ($200,000 + $325,000) / 70%*