Exercise 18-6 (20 minutes)
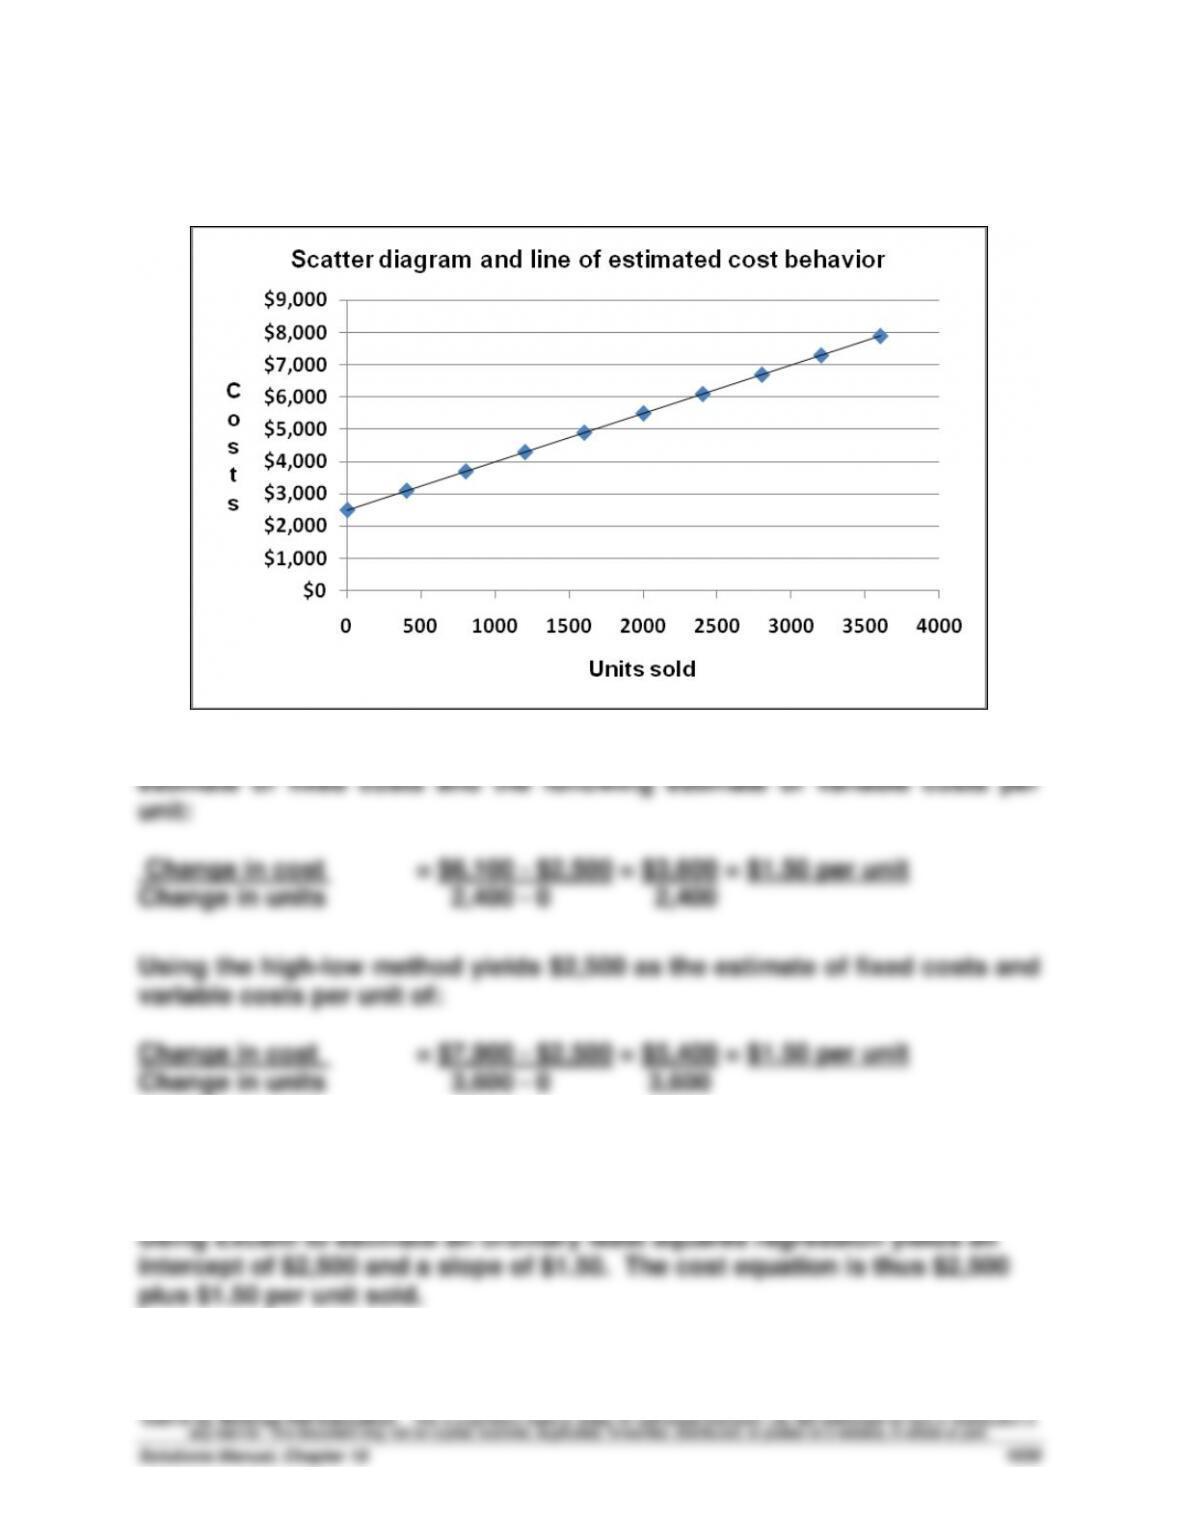
The scatter diagram and line of estimated cost behavior appear below.
Selecting 0 and 2,400 units sold as the activity levels yields $2,500 as the
Exercise 18-7A (20 minutes)
Exercise 18-8 (10 minutes)
(1) Contribution margin = Selling price – Variable costs
(2) Contribution margin ratio = Contribution margin = $41 = 20%
(3) The contribution margin of 20% implies that for each $1 in sales, the
Exercise 18-9 (30 minutes)
(a) Contribution margin per unit = $180 – $135 = $45 per unit
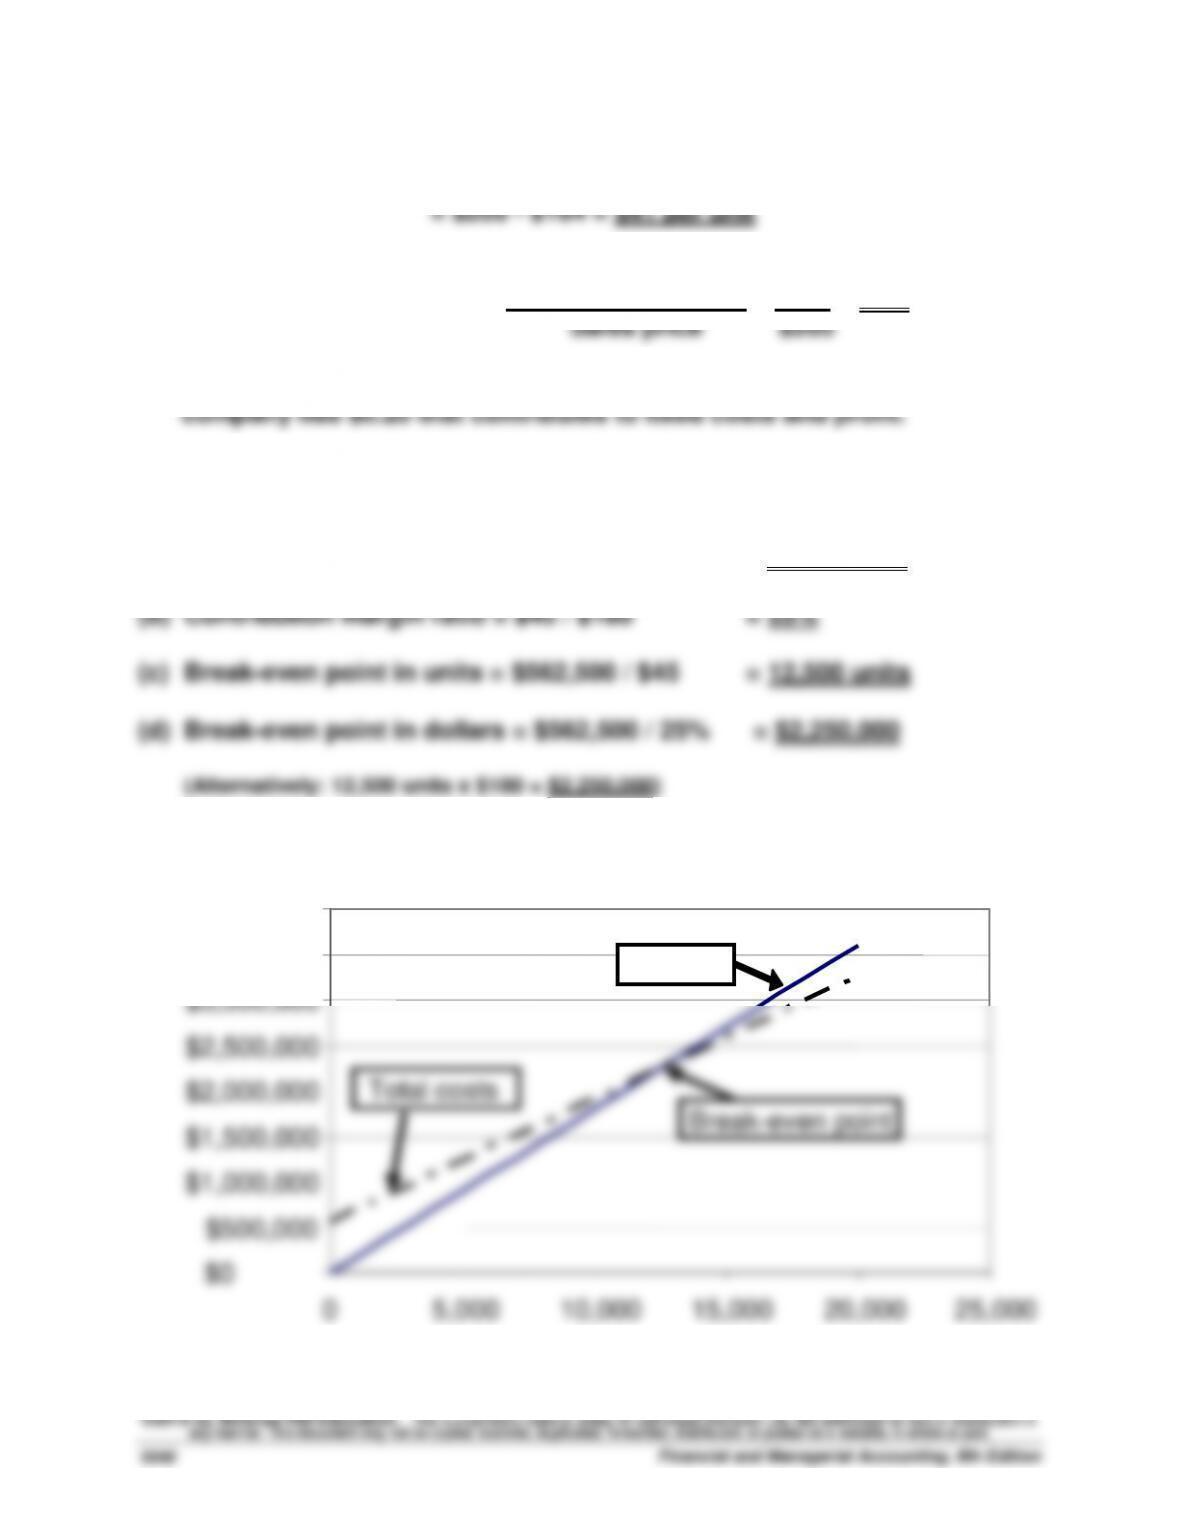
Exercise 18–10 (15 minutes)
$0
$500,000
$1,000,000
$1,500,000
$2,000,000
$2,500,000
$3,000,000
$3,500,000
$4,000,000
0
5,000
10,000
15,000
20,000
25,000
Units
Sales
Total costs
Break-even point
Exercise 18-11 (20 minutes)
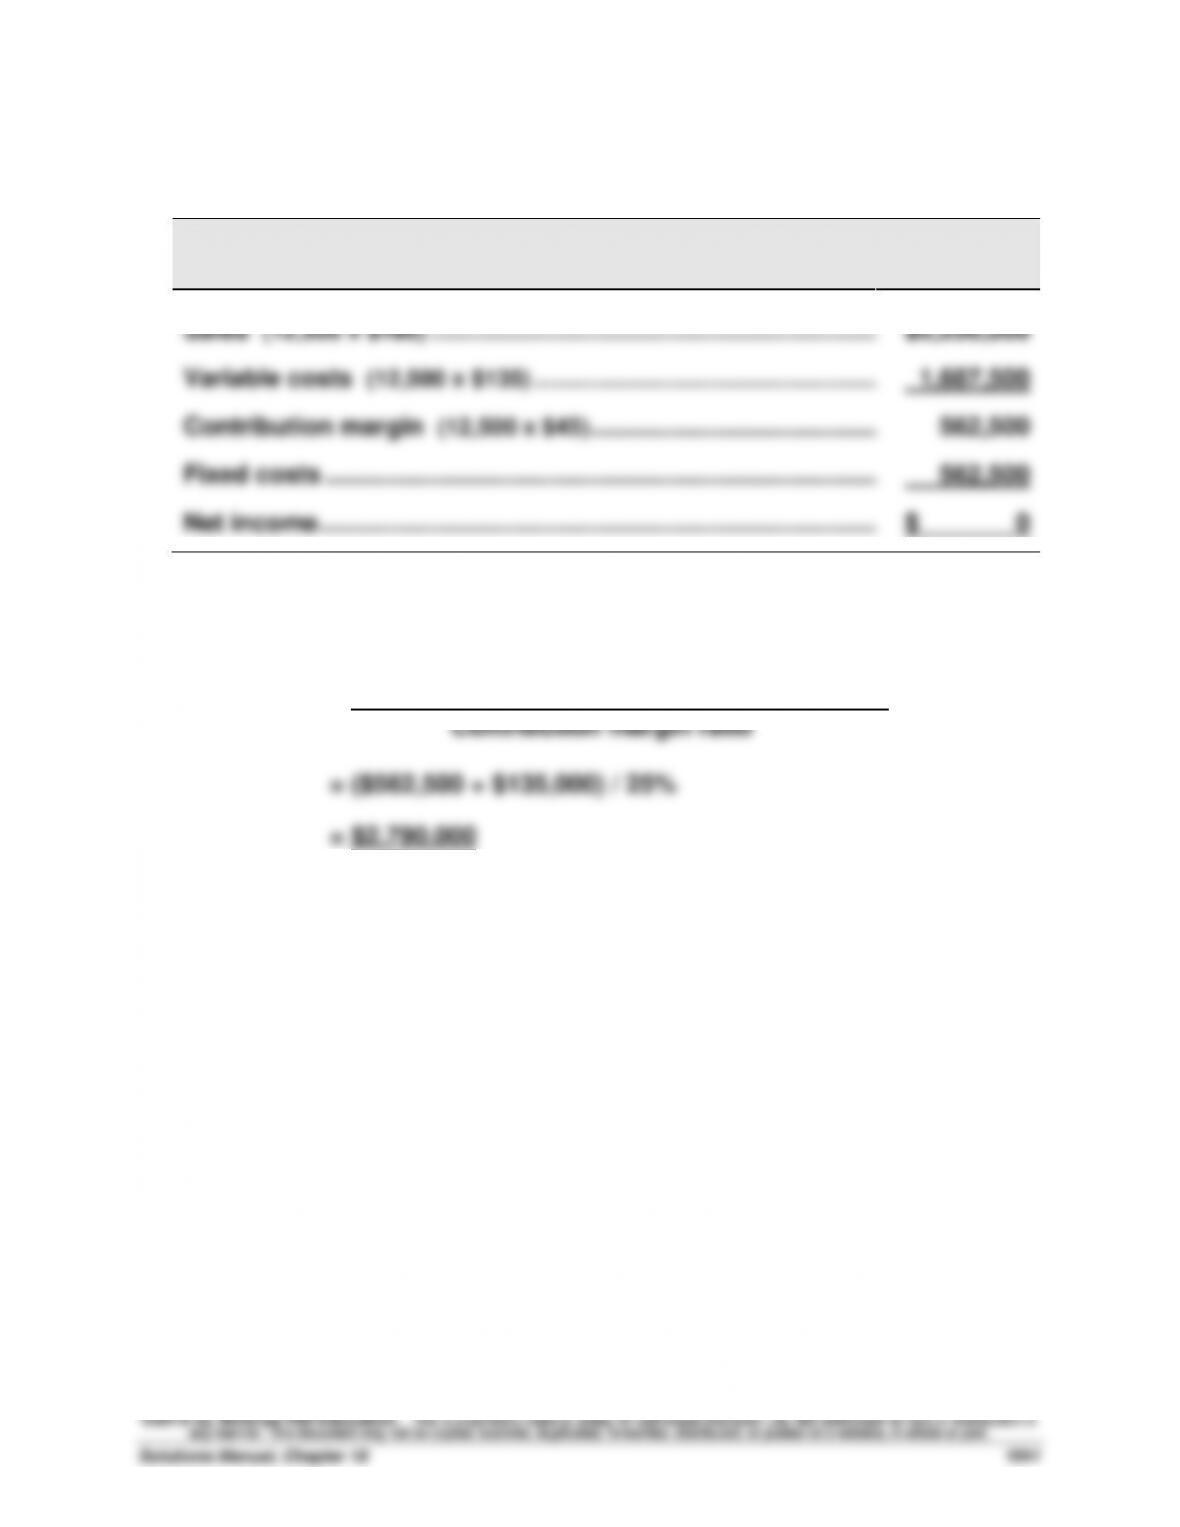
1.
BLANCHARD COMPANY
Contribution Margin Income Statement (at Break-Even)
Sales (12,500 x $180) ………………………………………………………..………
$2,250,000
Variable costs (12,500 x $135) …………………………………………..………
1,687,500
Contribution margin (12,500 x $45) ……………………………………………
562,500
Fixed costs ……………………………………………………………………..………
562,500
Net income ………………………………………………………………………………
$ 0
2. Sales (in dollars) to break even with increased fixed costs
Break-even = (Original fixed costs + Additional fixed costs)
Exercise 18-12 (25 minutes)
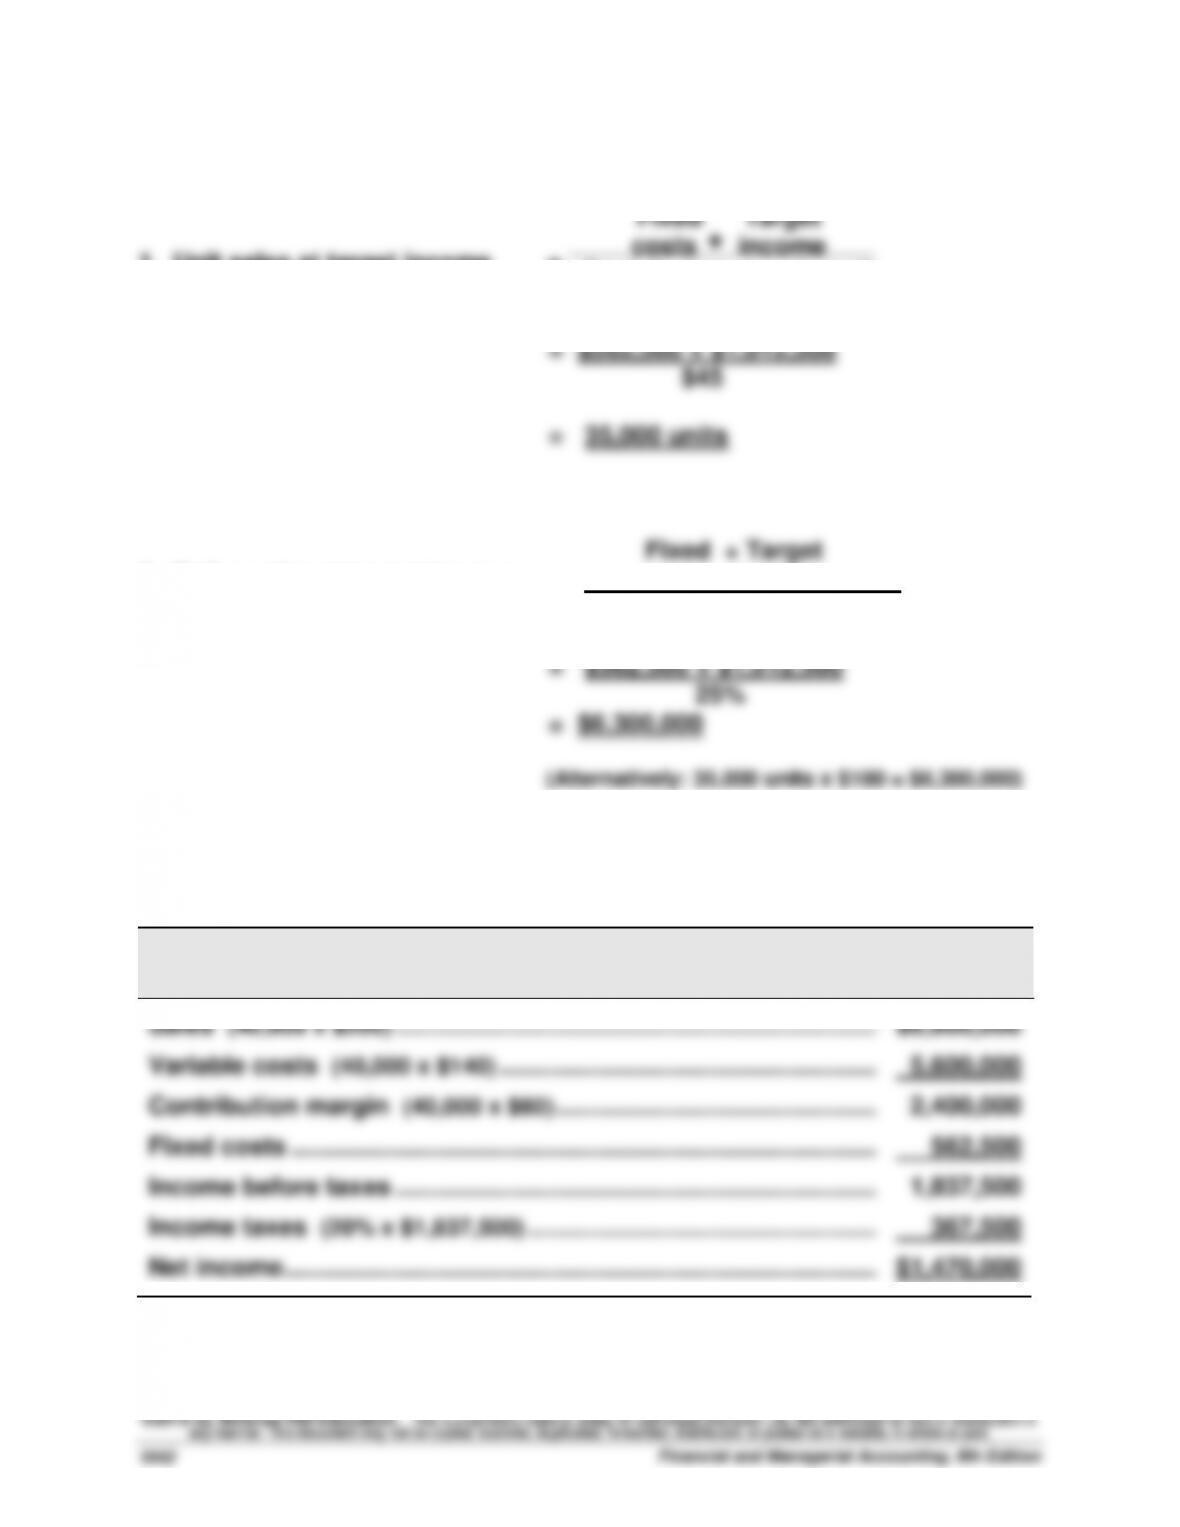
1. Unit sales at target income =
2. Dollar sales at target income = costs income
Contribution margin ratio
Exercise 18-13 (20 minutes)
BLANCHARD COMPANY
Forecasted Contribution Margin Income Statement
Sales (40,000 x $200) …………………………………………………………….….
$8,000,000
Variable costs (40,000 x $140) ……………………………………………….….
5,600,000
Contribution margin (40,000 x $60) ………………………………………..….
2,400,000
Fixed costs ………………………………………………………………………….….
562,500
Income before taxes …………………………..………………………………..….
1,837,500
Income taxes (20% x $1,837,500) ……………………………………………….
367,500
Net income …………………………………………………………………………..….
$1,470,000
Fixed Target
costs income
Contribution margin/unit
+
Exercise 18–14 (10 minutes)
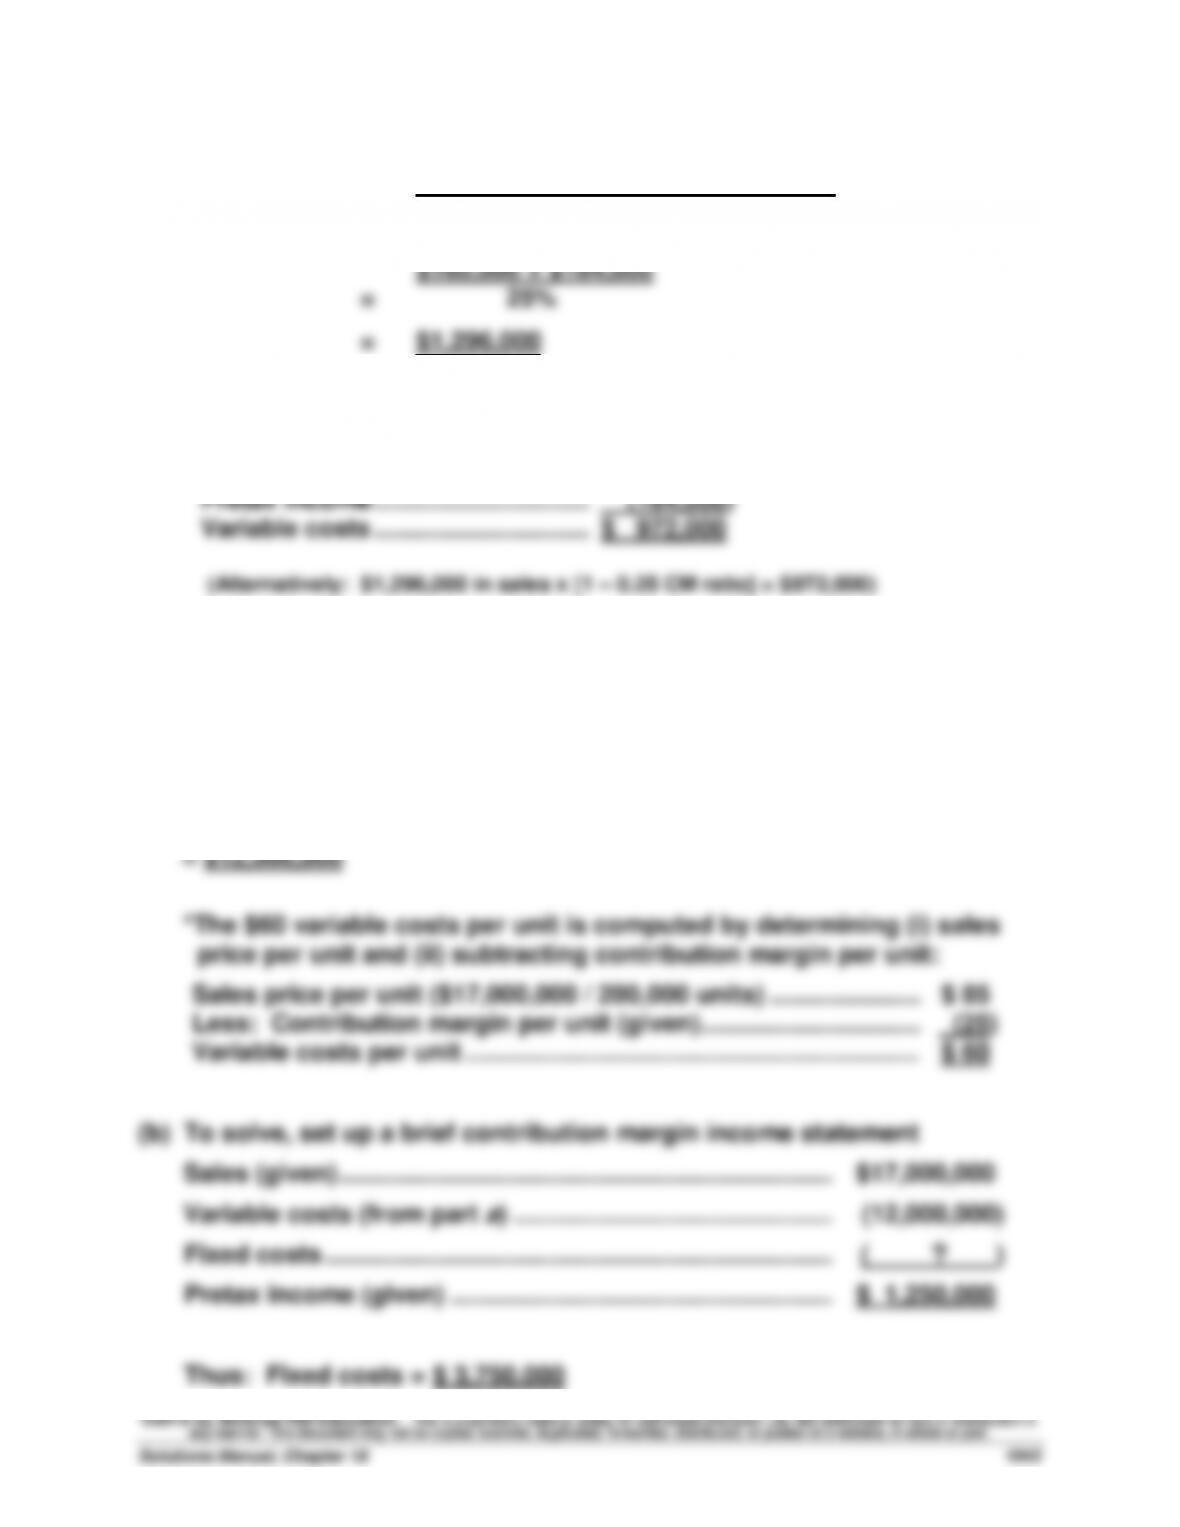
1. Fixed costs + Target pretax income
Dollar sales = Contribution margin ratio
2.
Sales …………………………..…………..……
$1,296,000
Fixed costs ……………………………………
(160,000)
Pretax income …………………………..
(164,000)
Variable costs …………………………..
$ 972,000
(Alternatively: $1,296,000 in sales x [1 – 0.25 CM ratio] = $972,000)
Exercise 18-15 (30 minutes)
(a) Total expected variable costs
= Variable costs per unit x units produced and sold
= $60* x 200,000 units
Exercise 18-16 (10 minutes)
1. Break-even in units = Fixed costs / Contribution margin per unit
2. Break-even point in dollars = Fixed costs / Contribution margin ratio
Exercise 18-17 (15 minutes)
1. Dollar sales for target income = Fixed costs + Target income
2. Margin of safety (%) = Expected sales – breakeven sales
Exercise 18-18 (15 minutes)
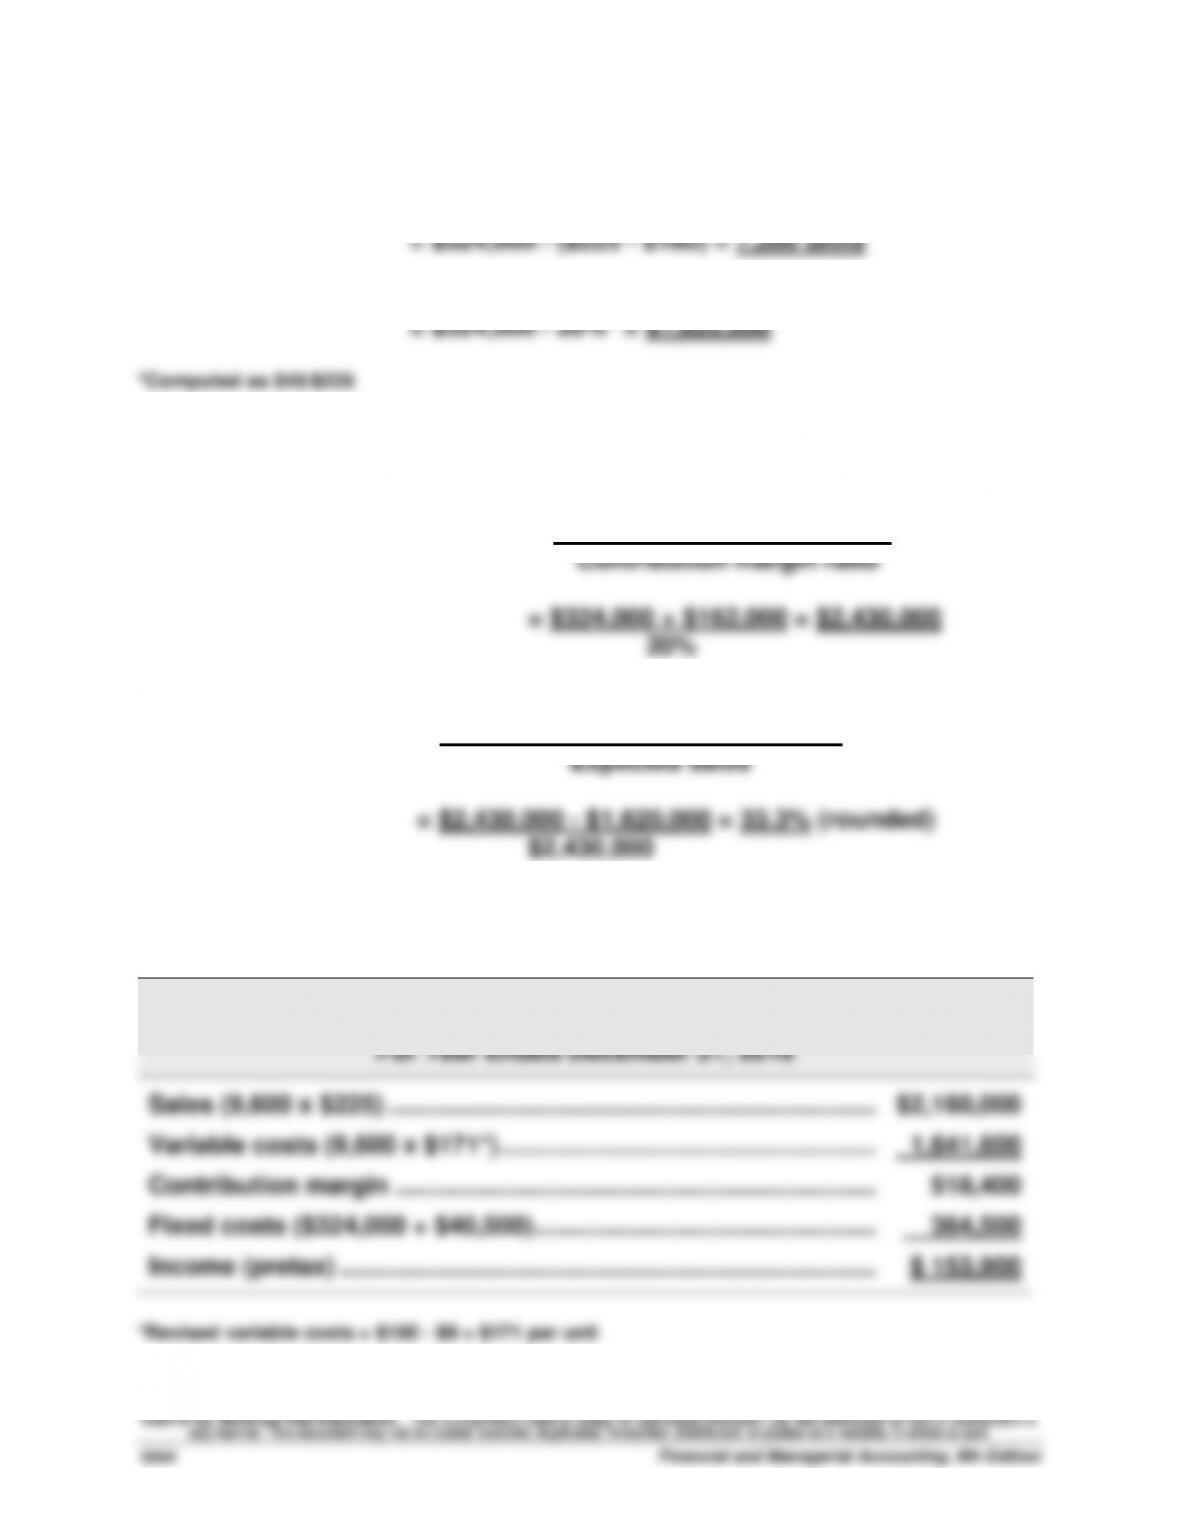
HUDSON CO.
Forecasted Contribution Margin Income Statement
For Year Ended December 31, 2016
Sales (9,600 x $225) ……………………………………………………………..….
$2,160,000
Variable costs (9,600 x $171*) ……………………………………………….….
1,641,600
Contribution margin …………………………………………………………….….
518,400
Fixed costs ($324,000 + $40,500) …………………………………………..….
364,500
Income (pretax) ……………………………………………………………………….
$ 153,900
*Revised variable costs = $180 – $9 = $171 per unit
Exercise 18-19 (10 minutes)
1. Revised contribution margin per unit = $240 – $180 = $60
2. Revised contribution margin ratio = $60/$240 = 25%
3. Break-even in units = Fixed costs / Contribution margin per unit
4. Break-even point in dollars = Fixed costs / Contribution margin ratio
Exercise 18–20 (15 minutes)
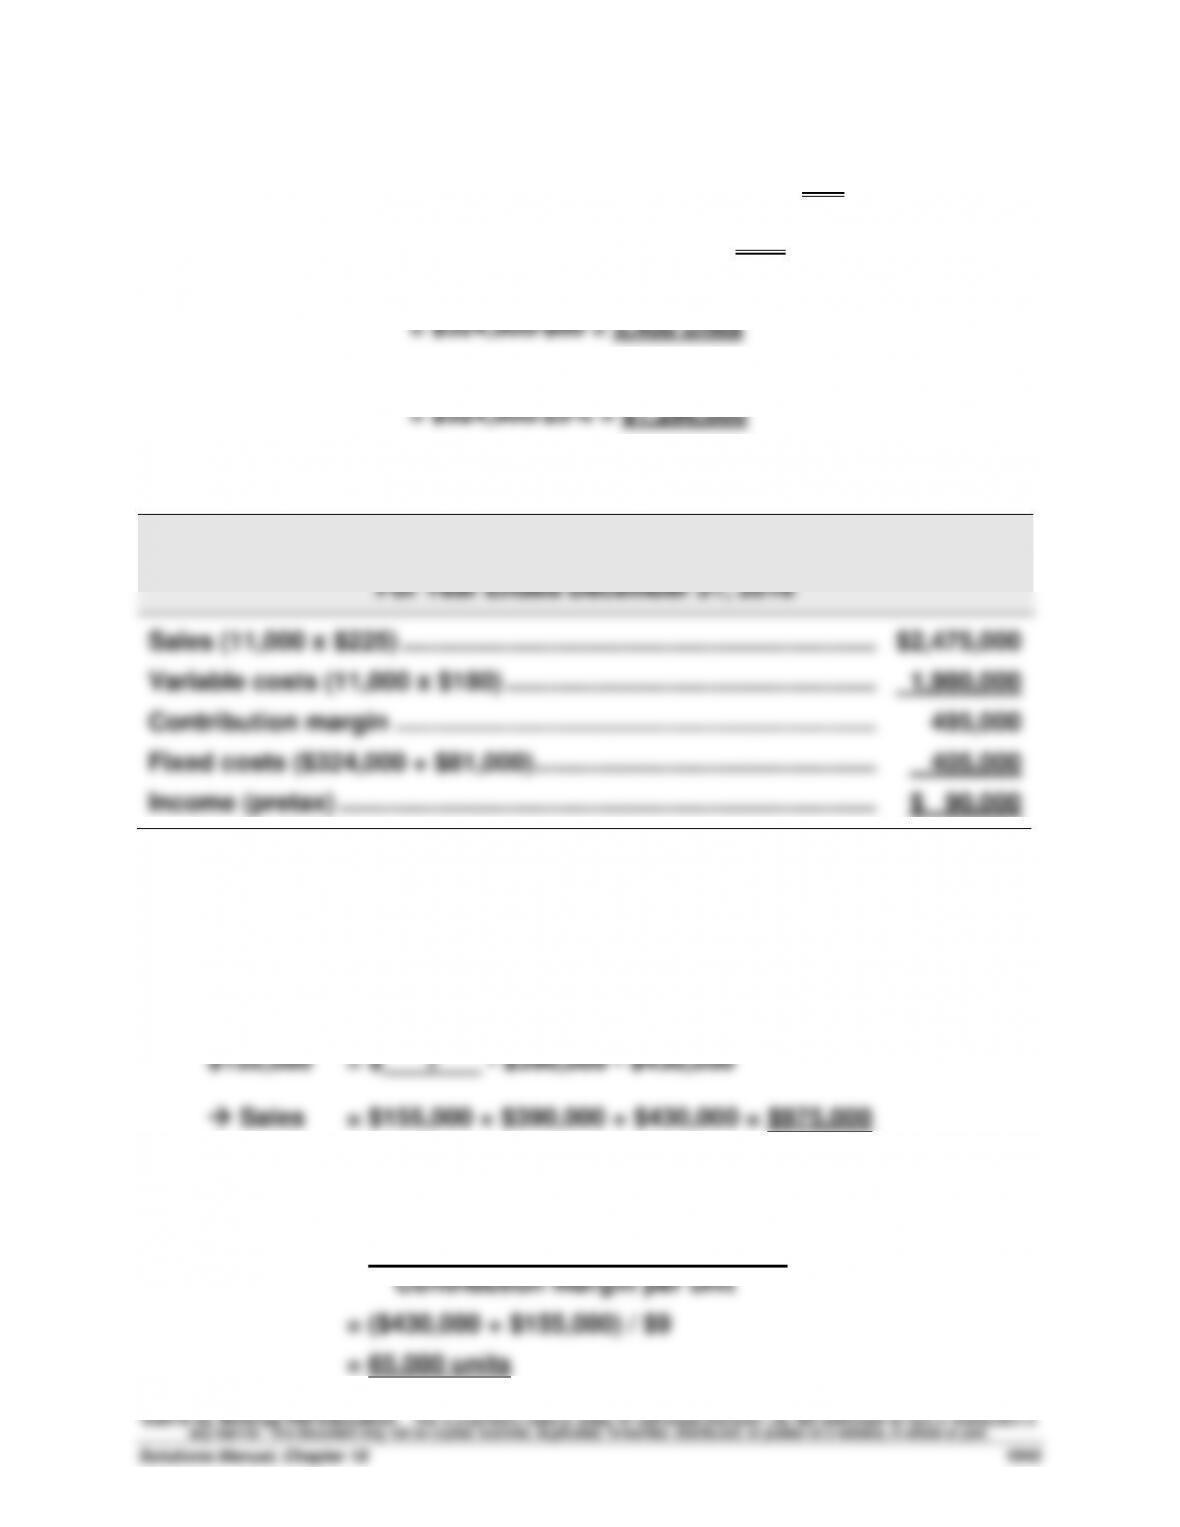
HUDSON CO.
Forecasted Contribution Margin Income Statement
For Year Ended December 31, 2016
Sales (11,000 x $225) ……………………………………………………….…..….
$2,475,000
Variable costs (11,000 x $180) ………………………………………………….
1,980,000
Contribution margin …………………………………………………………….….
495,000
Fixed costs ($324,000 + $81,000) …………………………………………..….
405,000
Income (pretax) ……………………………………………………………………….
$ 90,000
Exercise 18-21 (20 minutes)
1. Pretax income = Sales – Variable costs – Fixed costs
2. Instructor note: Use equation in Exhibit 18.23;
Unit sales = Fixed costs + Target pretax income
Exercise 18-22 (25 minutes)
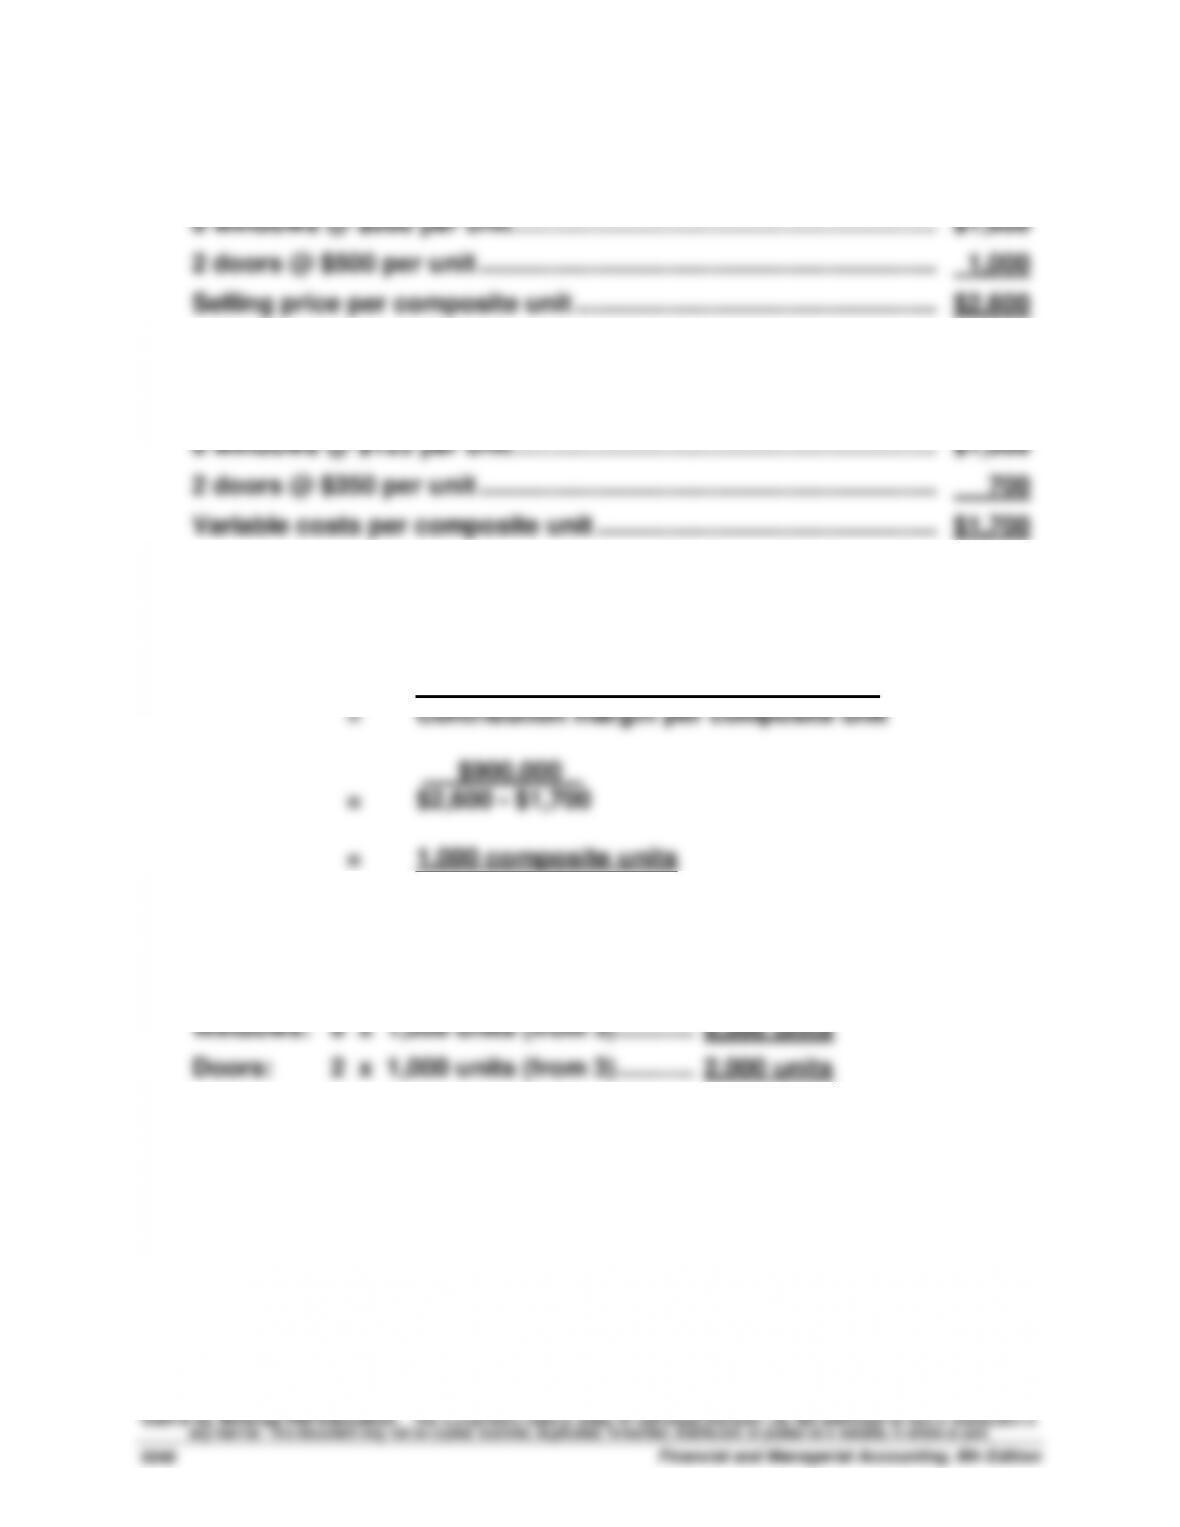
1. Selling price per composite unit
8 windows @ $200 per unit ……………………………………………………...
$1,600
2 doors @ $500 per unit …………………………………………………………..
1,000
Selling price per composite unit ……………………………………………...
$2,600
2. Variable costs per composite unit
8 windows @ $125 per unit ……………………………………………………...
$1,000
2 doors @ $350 per unit …………………………………………………………..
700
Variable costs per composite unit …………………………………………...
$1,700
3. Break-even point in composite units
Fixed costs .
4. Unit sales of windows and doors at break-even point
Windows: 8 x 1,000 units (from 3) ………..…….
8,000 units
Doors: 2 x 1,000 units (from 3) ………..…….
2,000 units
Exercise 18-23 (25 minutes)
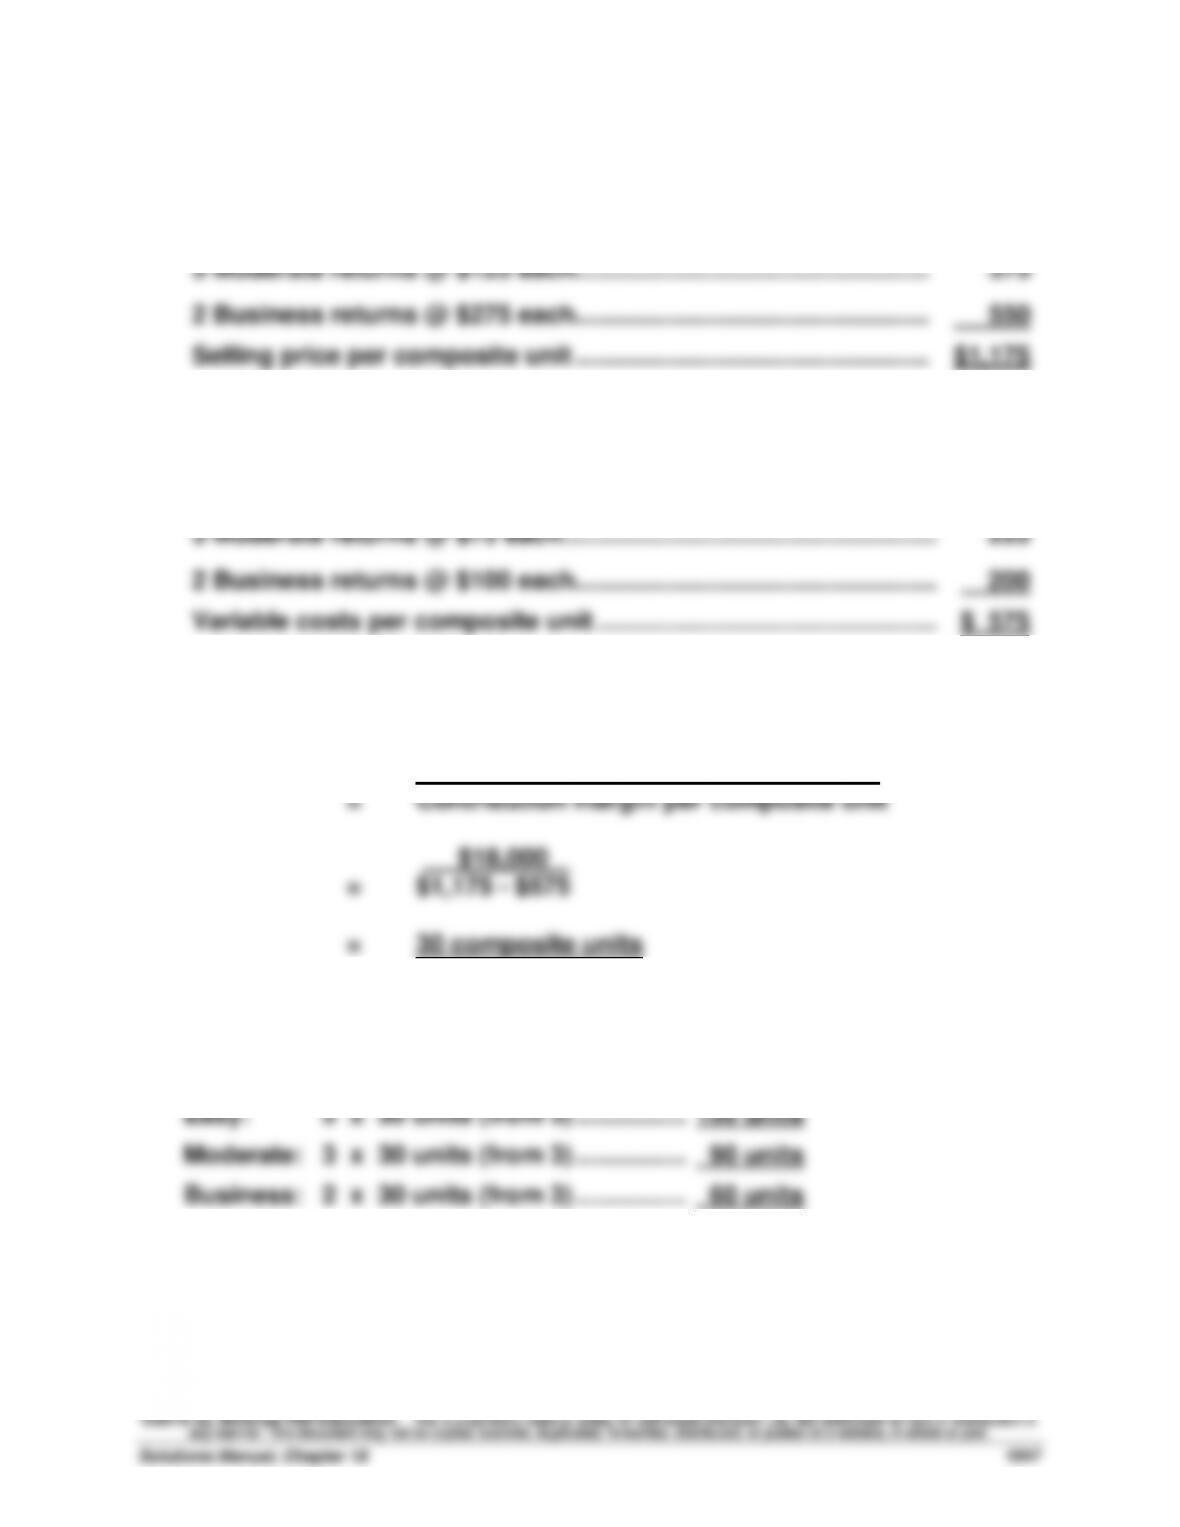
1. Selling price per composite unit
5 Easy returns @ $50 each …………………………………………………….
$ 250
3 Moderate returns @ $125 each…………………………………………….
375
2 Business returns @ $275 each…………………………………………….
Selling price per composite unit …………………………………………….
550
$1,175
2. Variable costs per composite unit
5 Easy returns @ $30 each …………………………………………………….
$ 150
3 Moderate returns @ $75 each………………………………………………
225
2 Business returns @ $100 each…………………………………………….
Variable costs per composite unit ………………………………………….
200
$ 575
3. Break-even point in composite units
Fixed costs .
4. Unit sales of Easy, Moderate, and Business returns at break-even point
Easy: 5 x 30 units (from 3) …………….…….
150 units
Moderate: 3 x 30 units (from 3) …………….…….
90 units
Business: 2 x 30 units (from 3) …………….…….
60 units
Exercise 18-24 (30 minutes)
1. Prepare a contribution margin income statement for Co. A to compute its DOL;
2. Prepare a contribution margin income statement for Co. B to compute its DOL;
3. Analyze and interpret which company benefits more from a 20% sales increase.
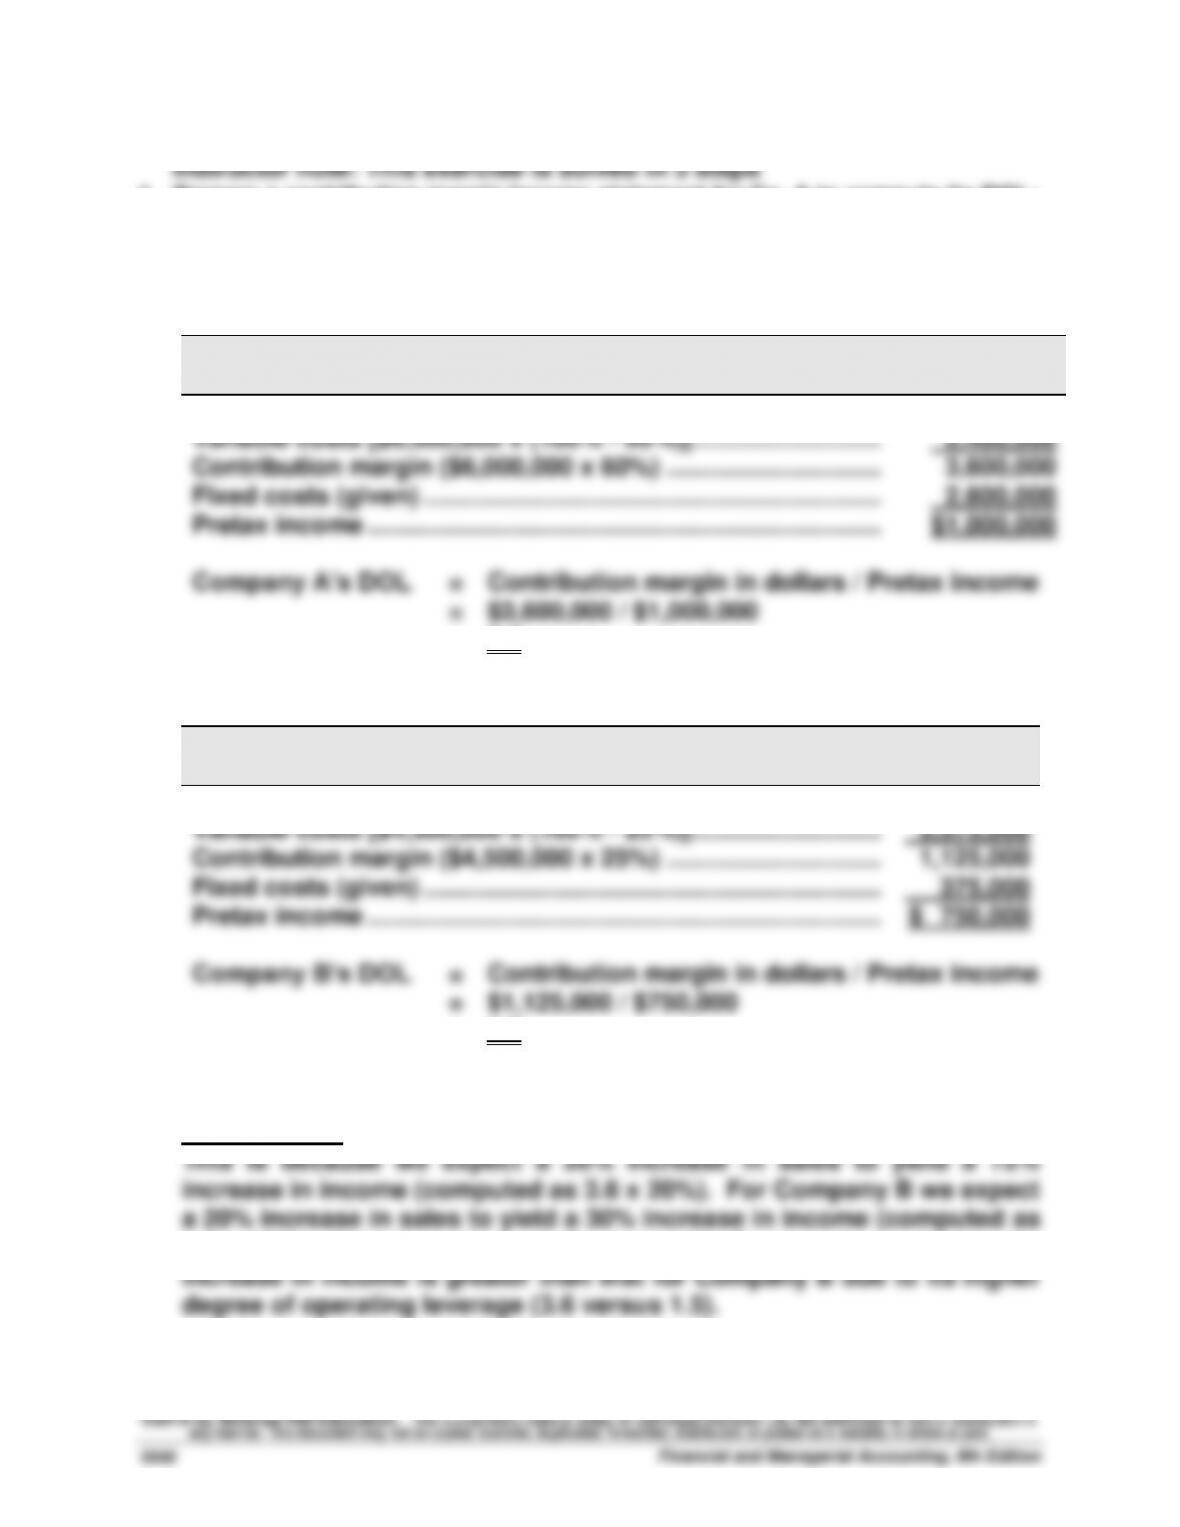
Step 1.
Company A
Contribution Margin Income Statement
Sales (given)…………………………………………………………………..
$6,000,000
Variable costs [$6,000,000 x (100% – 60%)] ………………………
2,400,000
Contribution margin ($6,000,000 x 60%) ………………………….
3,600,000
Fixed costs (given) ………………………………………………………...
2,600,000
Pretax income …………………………..……………………………………
$1,000,000
Company A’s DOL
=
Contribution margin in dollars / Pretax income
=
$3,600,000 / $1,000,000
=
3.6
Step 2.
Company B
Contribution Margin Income Statement
Sales (given)…………………………………………………………………..
$4,500,000
Variable costs [$4,500,000 x (100% – 25%)] ………………………
3,375,000
Contribution margin ($4,500,000 x 25%) ………………………….
1,125,000
Fixed costs (given) ………………………………………………………...
375,000
Pretax income …………………………..……………………………………
$ 750,000
Company B’s DOL
=
Contribution margin in dollars / Pretax income
=
$1,125,000 / $750,000
=
1.5
Step 3.
Interpretation: Company A benefits more from a 20% increase in sales.
1.5 x 20%). Note that although Company A’s fixed costs are higher, its