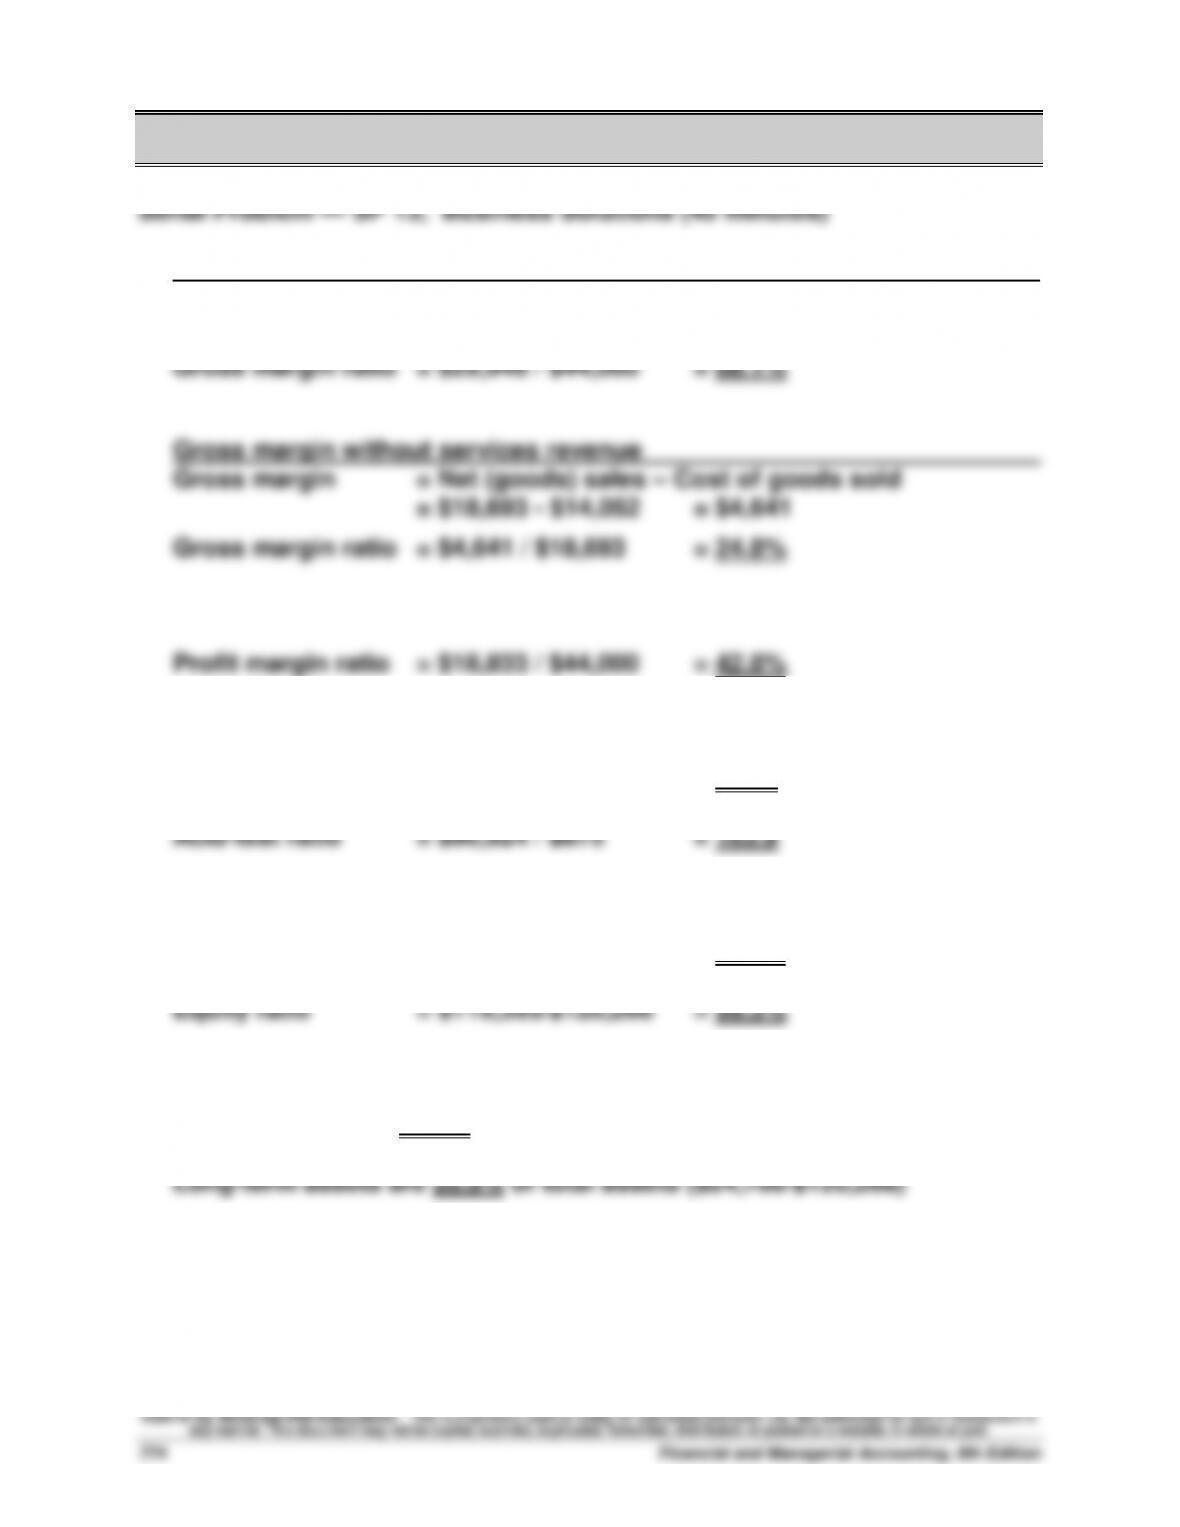
SERIAL PROBLEM — SP 13
1. Gross margin with services revenue
Gross margin = Total revenue – Cost of goods sold
= $44,000 – $14,052 = $29,948
2. Current ratio = $95,568 / $875 = 109.2
3. Debt ratio = $875 / $120,268 = 0.7%
4. Current assets are 79.4% of total assets ($95,568/$120,268)
©2016 by McGraw–Hill Education. This is proprietary material solely for authorized instructor use. Not authorized for sale or distribution in
any manner. This document may not be copied, scanned, duplicated, forwarded, distributed, or posted on a website, in whole or part.
Solutions Manual, Chapter 13
775
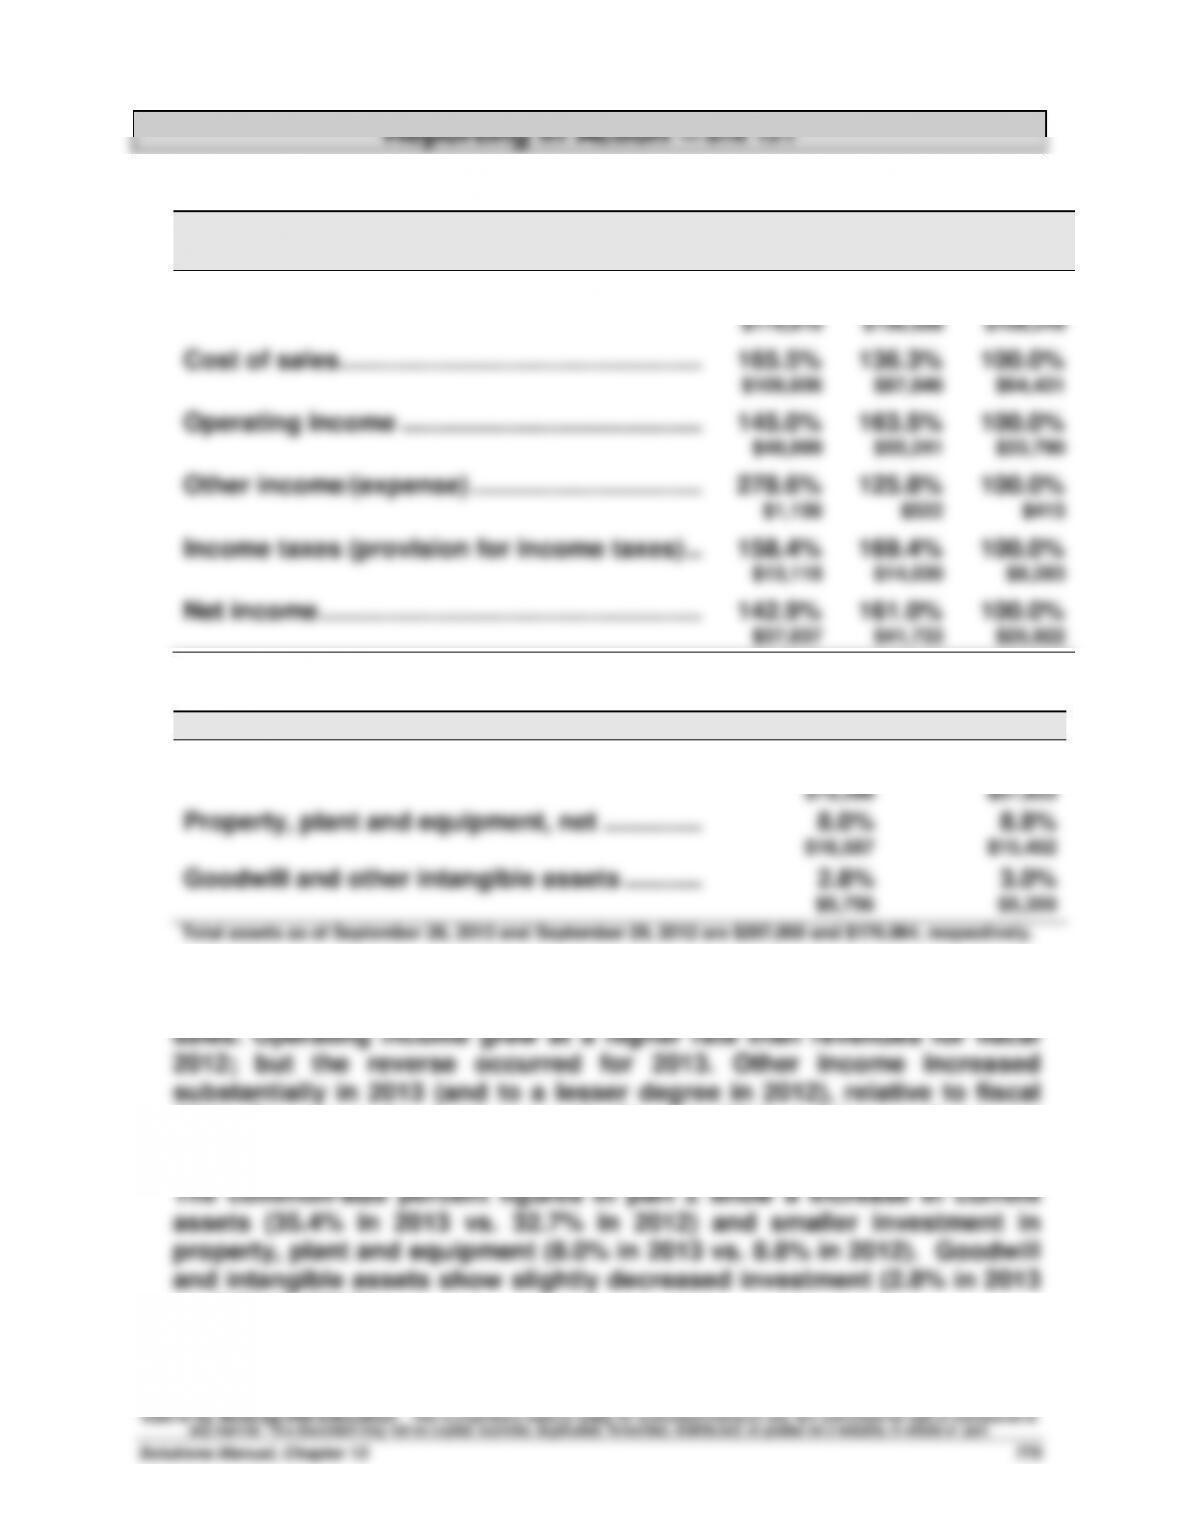
Reporting in Action — BTN 13-1
1. Trend percents for selected income statement accounts
($ in millions)
Fiscal
2013
Fiscal
2012
Fiscal
2011
Net Sales …………………………………………………..….
157.9%
144.6%
100.0%
$170,910
$156,508
$108,249
Cost of sales ……………………………………………..….
165.5%
136.3%
100.0%
$106,606
$87,846
$64,431
Operating income ……………………………………..….
145.0%
163.5%
100.0%
$48,999
$55,241
$33,790
Other income/(expense) …………………………….….
278.6%
125.8%
100.0%
$1,156
$522
$415
Income taxes (provision for income taxes) …….
158.4%
169.4%
100.0%
$13,118
$14,030
$8,283
Net income ………………………………………………..….
142.9%
161.0%
100.0%
$37,037
$41,733
$25,922
2. Common–size percents for asset categories and accounts
($ in millions)
Sep. 28, 2013
Sep. 29, 2012
Total current assets …………………………………..….
35.4%
32.7%
$73,286
$57,653
Property, plant and equipment, net ……………….
8.0%
8.8%
$16,597
$15,452
Goodwill and other intangible assets …………….
2.8%
3.0%
$5,756
$5,359
Total assets as of September 28, 2013 and September 29, 2012 are $207,000 and $176,064, respectively.
3. For fiscal 2013, revenues grew at a lower rate than cost of sales,
however, for fiscal 2012, revenues grew at a higher rate than cost of
2011. Consequently, net income declined in 2013 and its trend percent
was lower than revenue growth for 2013 (the reverse occurred in 2012).
vs. 3.0% in 2012).
4. Answers depend on the financial statement information obtained.
©2016 by McGraw–Hill Education. This is proprietary material solely for authorized instructor use. Not authorized for sale or distribution in
any manner. This document may not be copied, scanned, duplicated, forwarded, distributed, or posted on a website, in whole or part.
Financial and Managerial Accounting, 6th Edition
776
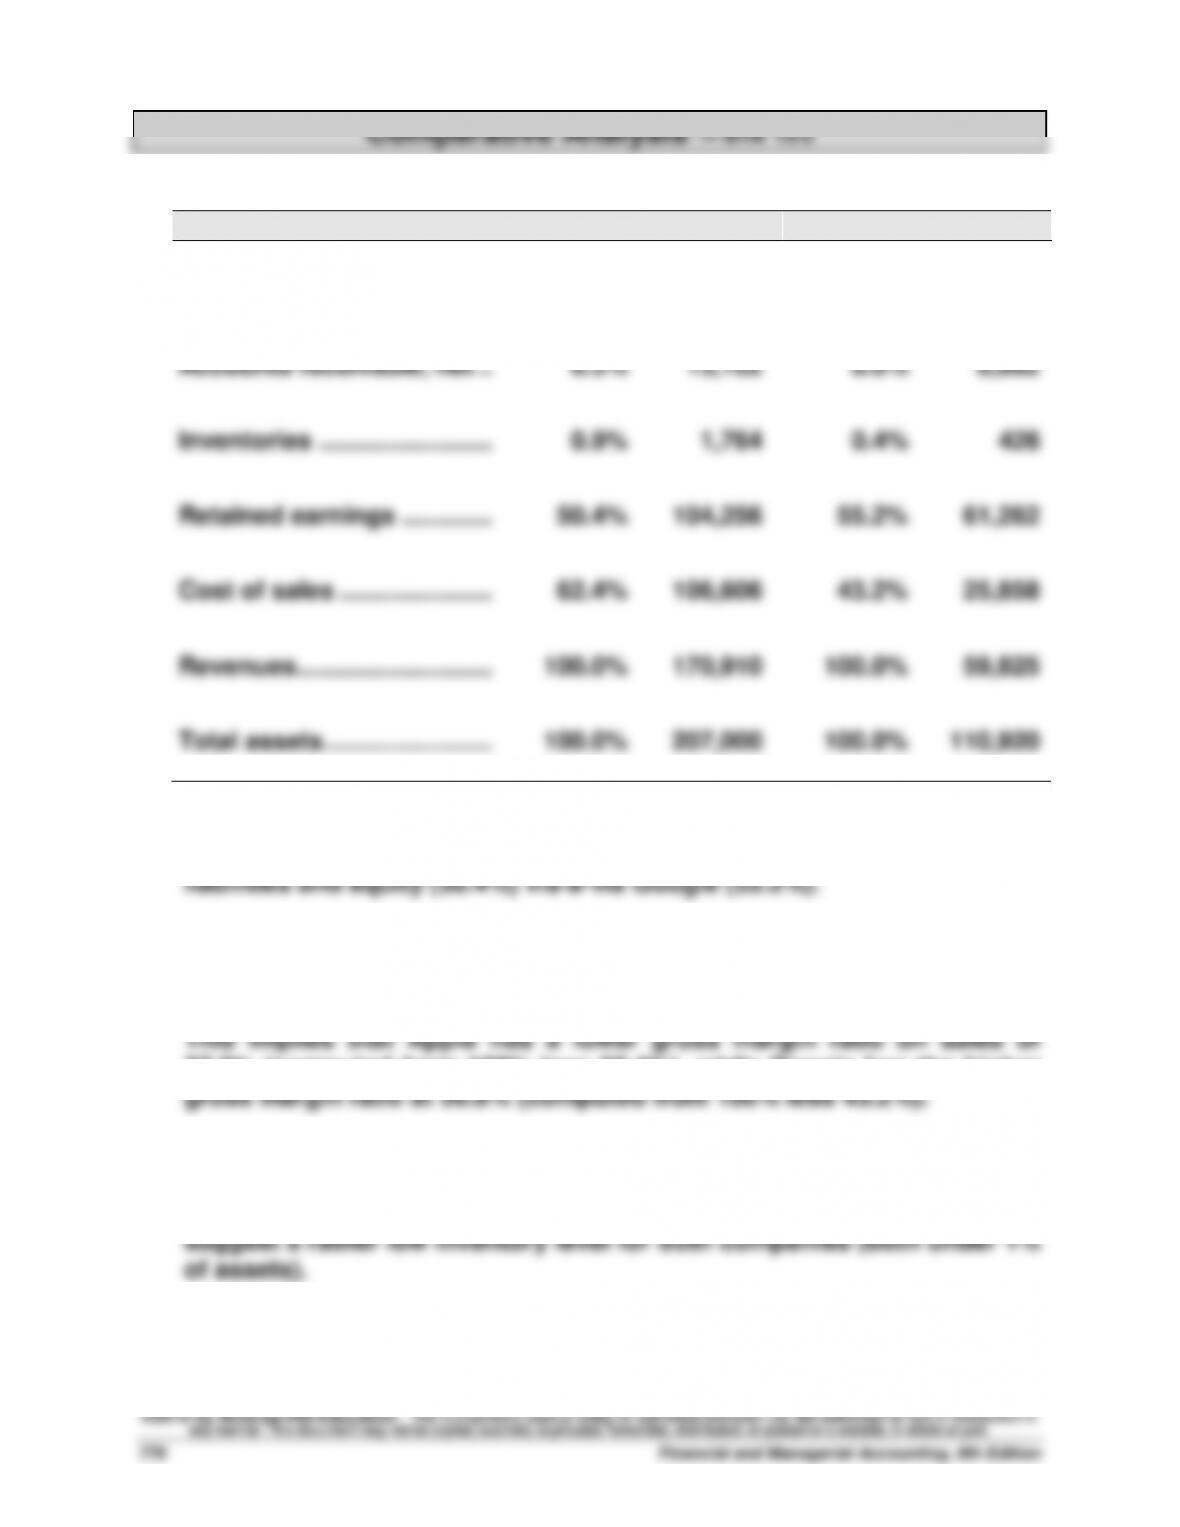
Comparative Analysis — BTN 13-2
1.
Key figures ($ millions)
Apple
Google
Cash and equivalents ……..…..
6.9%
$14,259
17.0%
$18,898
Accounts receivable, net ..…..
6.3%
13,102
8.0%
8,882
Inventories …………………….…..
0.9%
1,764
0.4%
426
Retained earnings ………….…..
50.4%
104,256
55.2%
61,262
Cost of sales ………………….…..
62.4%
106,606
43.2%
25,858
Revenues ……………………….….
100.0%
170,910
100.0%
59,825
Total assets ………………………..
100.0%
207,000
100.0%
110,920
2. Apple’s retained earnings make up a smaller percentage of its total
3. Apple’s cost of sales percent is higher at 62.4% compared to Google’s
at 43.2%.
37.6% (computed from 100% less 62.4%), while Google has the higher
4. Although Apple has almost twice as much inventory as a percent of
total assets (0.9%) compared to Google (0.4%), both of these ratios
©2016 by McGraw–Hill Education. This is proprietary material solely for authorized instructor use. Not authorized for sale or distribution in
any manner. This document may not be copied, scanned, duplicated, forwarded, distributed, or posted on a website, in whole or part.
Solutions Manual, Chapter 13
777
Ethics Challenge — BTN 13-3
1. The CEO appears to have selectively chosen from the 11 available
ratios to present only the ones that show trends that are favorable to
2. The consequences of this action by the CEO might be mixed. It is likely
that the analysts will ask other questions that may reveal some
negative trends such as the trends in return and profit margins. The
CEO’s actions may become transparent to the analysts as they
discover the presence of less favorable trends through their questions.
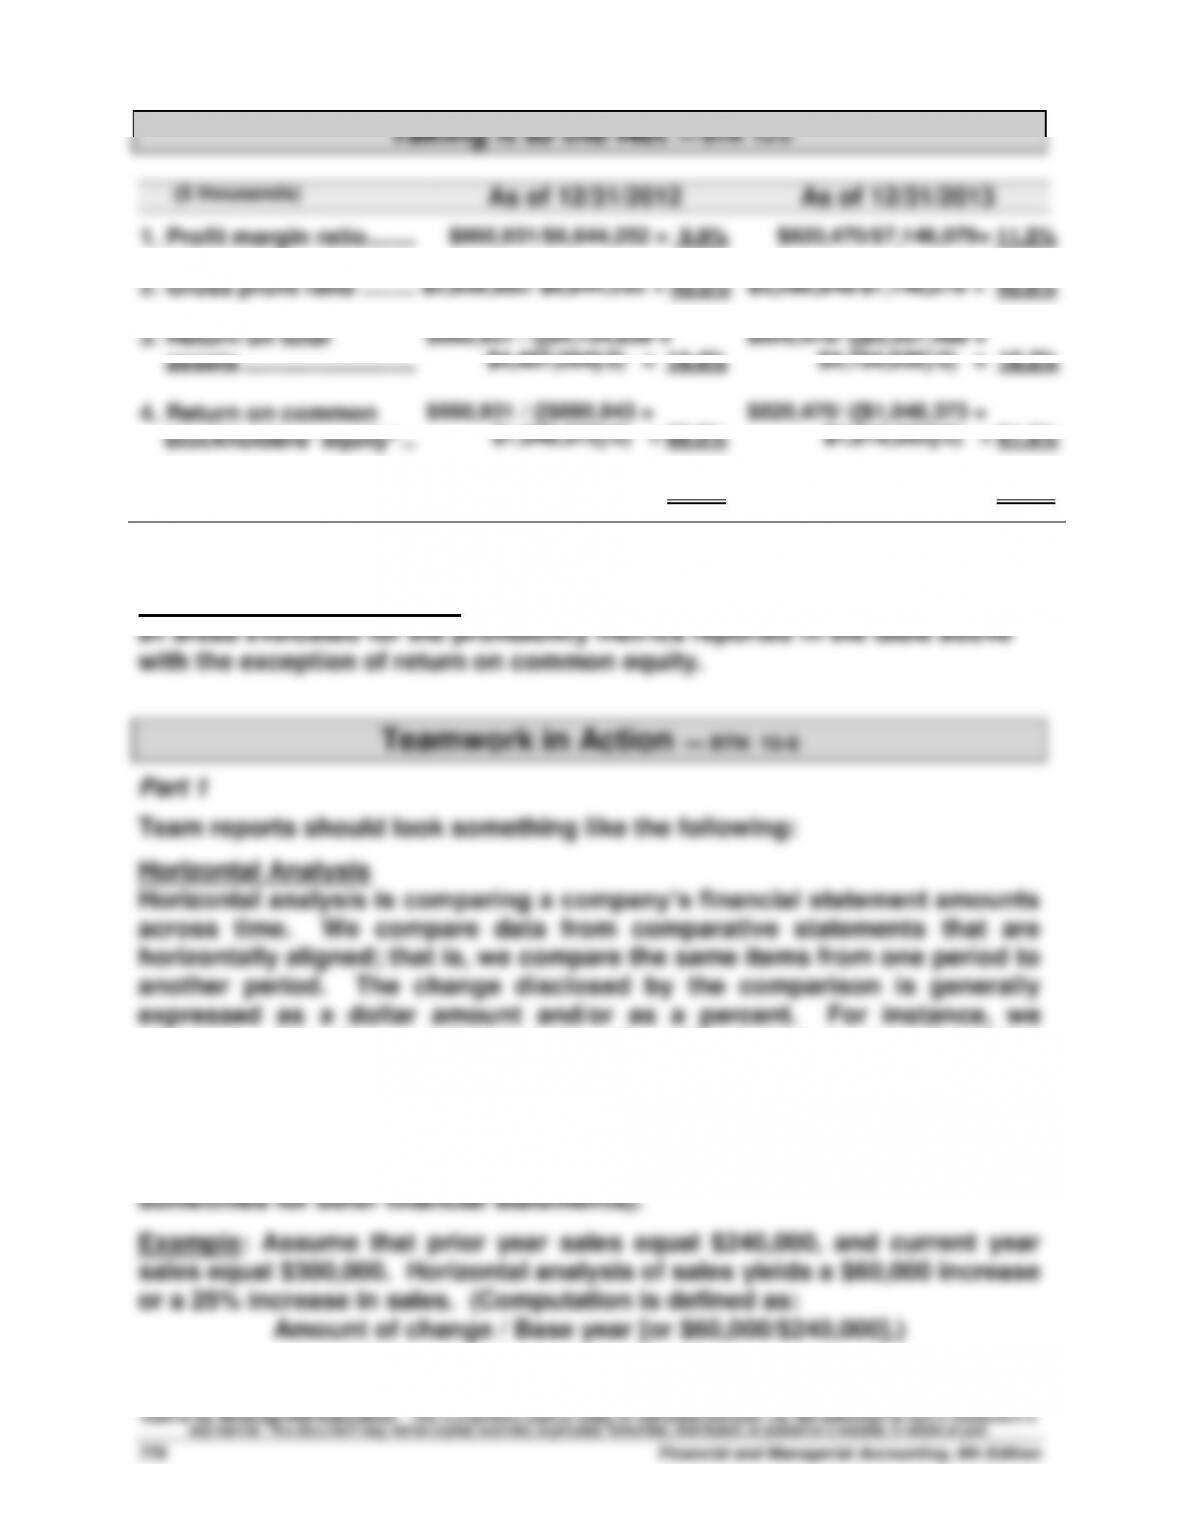
Taking It to the Net — BTN 13-5
($ thousands)
As of 12/31/2012
As of 12/31/2013
1. Profit margin ratio …….……….
$660,931/$6,644,252 = 9.9%
$820,470/$7,146,079= 11.5%
2. Gross profit ratio ……..……….
$2,859,882/ $6,644,252 = 43.0%
$3,280,848/$7,146,079 = 45.9%
3. Return on total
assets …………………….…….
$660,931 / ([$4,754,839 +
$4,407,094]/2) = 14.4%
$820,470/ ([$5,357,488 +
$4,754,839]/2) = 16.2%
4. Return on common
stockholders’ equity* ..……….
$660,931 / ([$880,943 +
$1,048,373]/2) = 68.5%
$820,470/ ([$1,048,373 +
$1,616,052]/2) = 61.6%
5. Basic net income per
common share** ……………….
$ 3.01
$ 3.76
*An acceptable alternative solution would be to include minority interest in equity.
**Taken from consolidated statement of income.
Analysis and Interpretation: Hershey’s performance generally improved in
compare sales of one period to sales of another and determine the dollar
amount of the increase or decrease.
We also determine the percent of increase or decrease in sales that this
change represents. This type of comparison is generally completed on a
line–by-line basis for both income statement and balance sheet items (and
©2016 by McGraw–Hill Education. This is proprietary material solely for authorized instructor use. Not authorized for sale or distribution in
any manner. This document may not be copied, scanned, duplicated, forwarded, distributed, or posted on a website, in whole or part.
Solutions Manual, Chapter 13
779
Teamwork in Action (Concluded)
If a horizontal comparison is made over a number of periods, the
comparisons are made to corresponding amounts in a selected period
called the base period. Each subsequent period’s amount is compared to
the base period. The change is expressed as a percent of the base period.
This is commonly referred to as trend analysis.
Vertical Analysis
Vertical analysis is comparing a company’s financial statement amounts to
a base amount. Usually this base amount is a total or aggregate amount.
An income statement’s base is usually total revenue and a balance sheet’s
b. Solvency analysis measures a company‘s long–run financial viability and
its ability to cover long-term obligations.
c. Profitability analysis measures a company’s ability to generate an
adequate return on invested capital.
d. Market analysis measures the company’s returns (for example, EPS and
©2016 by McGraw–Hill Education. This is proprietary material solely for authorized instructor use. Not authorized for sale or distribution in
any manner. This document may not be copied, scanned, duplicated, forwarded, distributed, or posted on a website, in whole or part.
Financial and Managerial Accounting, 6th Edition
780
Entrepreneurial Decision — BTN 13-7
1. No. Although the current ratio improved over the three–year period, the
acid-test ratio declined and accounts receivable and merchandise
paid.
2. No. The decreasing turnover of accounts receivable indicates the
3. No. Sales are increasing and accounts receivable are turning more
4. Yes. To illustrate, if sales are assumed to equal $100 in 2013, the sales
$33.33 for plant assets in 2013 ($100/ 3.0), $37.88 in 2014 ($125/ 3.3) and
$39.14 in 2015 ($137/ 3.5).
5. No. The percent of return on equity declines from 12.25% in 2013 to
9.75% in 2015.
6. The dollar amount of selling expenses increased in 2014 and decreased
and $13.43 in 2015.
Hitting the Road — BTN 13-8
One possible strategy to fulfill the requirements of this assignment is:
Assume that a $37,500 salary will be earned upon graduation at age 25.
Also, assume that the level of investment will be at 8% of your salary (or
©2016 by McGraw–Hill Education. This is proprietary material solely for authorized instructor use. Not authorized for sale or distribution in
any manner. This document may not be copied, scanned, duplicated, forwarded, distributed, or posted on a website, in whole or part.
Solutions Manual, Chapter 13
781
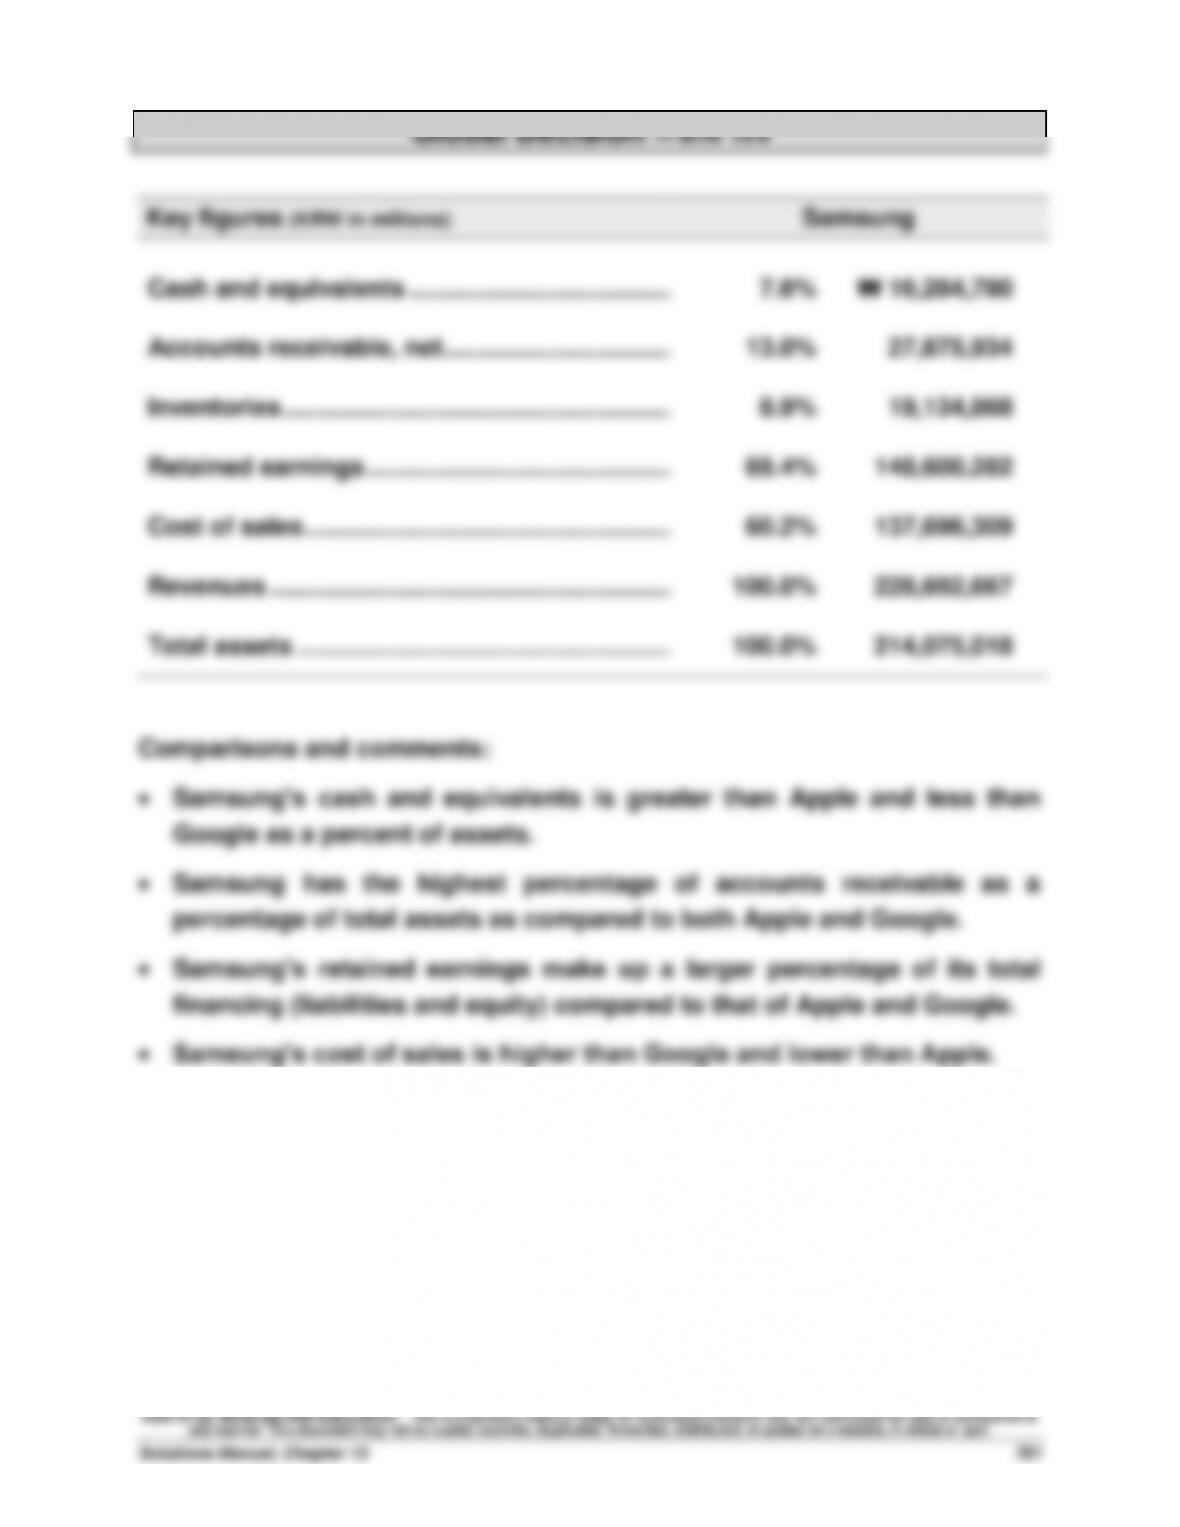
Global Decision — BTN 13-9
Key figures (KRW in millions)
Samsung
Cash and equivalents ………………………………....
7.6%
₩ 16,284,780
Accounts receivable, net ……………………………..
13.0%
27,875,934
Inventories ………………………………………………....
8.9%
19,134,868
Retained earnings …………………………..…………..
69.4%
148,600,282
Cost of sales …………………………..…………………..
60.2%
137,696,309
Revenues …………………………………………………...
100.0%
228,692,667
Total assets …………………………..…………………...
100.0%
214,075,018
Comparisons and comments:
Samsung’s cash and equivalents is greater than Apple and less than
Google as a percent of assets.
Samsung has the highest percentage of accounts receivable as a
percentage of total assets as compared to both Apple and Google.
Samsung’s retained earnings make up a larger percentage of its total
financing (liabilities and equity) compared to that of Apple and Google.
Samsung’s cost of sales is higher than Google and lower than Apple.