Problem 13-2A (Concluded)
Part 3
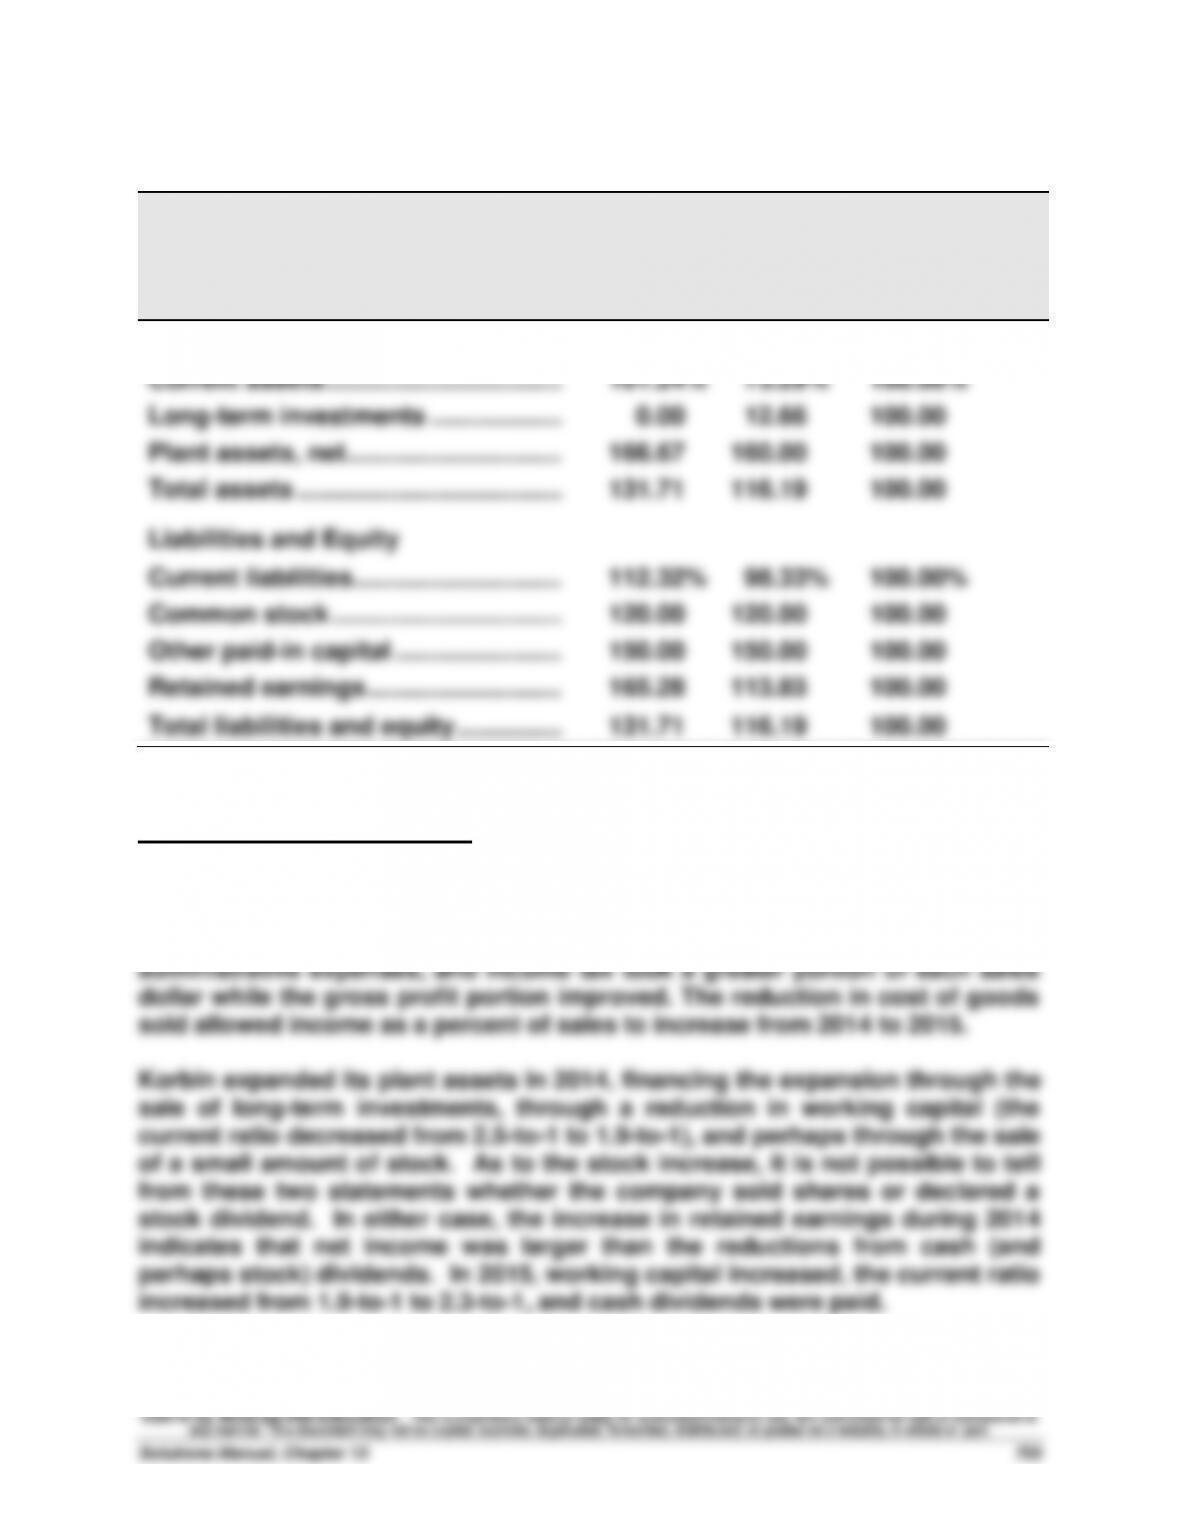
KORBIN COMPANY
Balance Sheet Data in Trend Percents
December 31, 2015, 2014, and 2013
2015
2014
2013
Assets
Current assets …………………………….
101.24%
73.29%
100.00%
Long-term investments ……………….
0.00
12.66
100.00
Plant assets, net ………………………….
166.67
160.00
100.00
Total assets …………………………..……
131.71
116.19
100.00
Liabilities and Equity
Current liabilities …………………………
112.32%
98.33%
100.00%
Common stock …………………………...
120.00
120.00
100.00
Other paid–in capital ……………………
150.00
150.00
100.00
Retained earnings ……………………….
165.28
113.83
100.00
Total liabilities and equity ……………
131.71
116.19
100.00
Part 4
Significant relations revealed
Korbin’s selling expenses and income taxes consumed smaller portions of
each sales dollar in 2014 than 2013. However, cost of goods sold and
administrative expenses consumed a larger portion in 2014. Therefore, income
as a percent of sales declined from 2013 to 2014. In 2015, selling expenses,
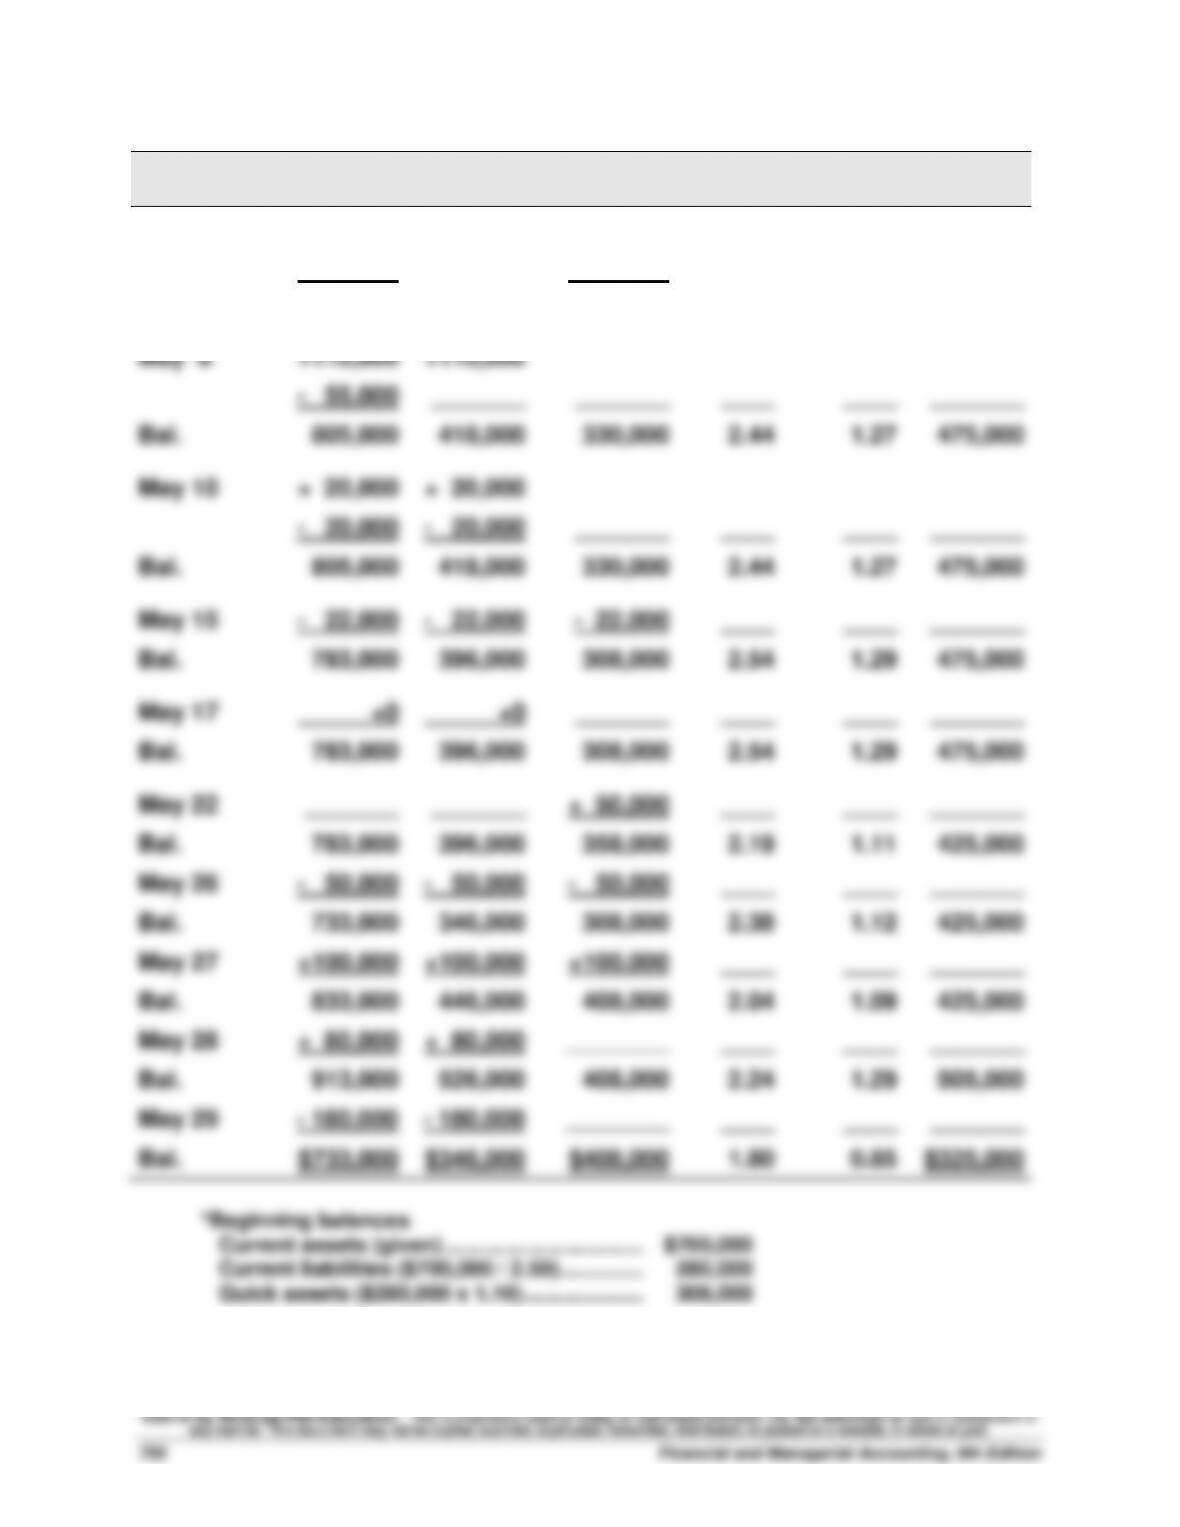
Problem 13-3A (60 minutes)
Trans-
action
Current
Assets
Quick
Assets
Current
Liabilities
Current
Ratio
Acid-Test
Ratio
Working
Capital
Beginning*
$700,000
$308,000
$280,000
2.50
1.10
$420,000
May 2
+ 50,000
_______
+ 50,000
____
____
_______
Bal.
750,000
308,000
330,000
2.27
0.93
420,000
May 8
+110,000
+110,000
– 55,000
_______
_______
____
____
_______
Bal.
805,000
418,000
330,000
2.44
1.27
475,000
May 10
+ 20,000
+ 20,000
– 20,000
– 20,000
_______
____
____
_______
Bal.
805,000
418,000
330,000
2.44
1.27
475,000
May 15
– 22,000
– 22,000
– 22,000
____
____
_______
Bal.
783,000
396,000
308,000
2.54
1.29
475,000
May 17
+0
+0
_______
____
____
_______
Bal.
783,000
396,000
308,000
2.54
1.29
475,000
May 22
_______
_______
+ 50,000
____
____
_______
Bal.
783,000
396,000
358,000
2.19
1.11
425,000
May 26
– 50,000
– 50,000
– 50,000
____
____
_______
Bal.
733,000
346,000
308,000
2.38
1.12
425,000
May 27
+100,000
+100,000
+100,000
____
____
_______
Bal.
833,000
446,000
408,000
2.04
1.09
425,000
May 28
+ 80,000
+ 80,000
________
____
____
_______
Bal.
913,000
526,000
408,000
2.24
1.29
505,000
May 29
– 180,000
– 180,000
________
____
____
_______
Bal.
$733,000
$346,000
$408,000
1.80
0.85
$325,000
*Beginning balances
Current assets (given) ……………………………………..
$700,000
Current liabilities ($700,000 / 2.50)…………..………..
280,000
Quick assets ($280,000 x 1.10) ………………..………..
308,000
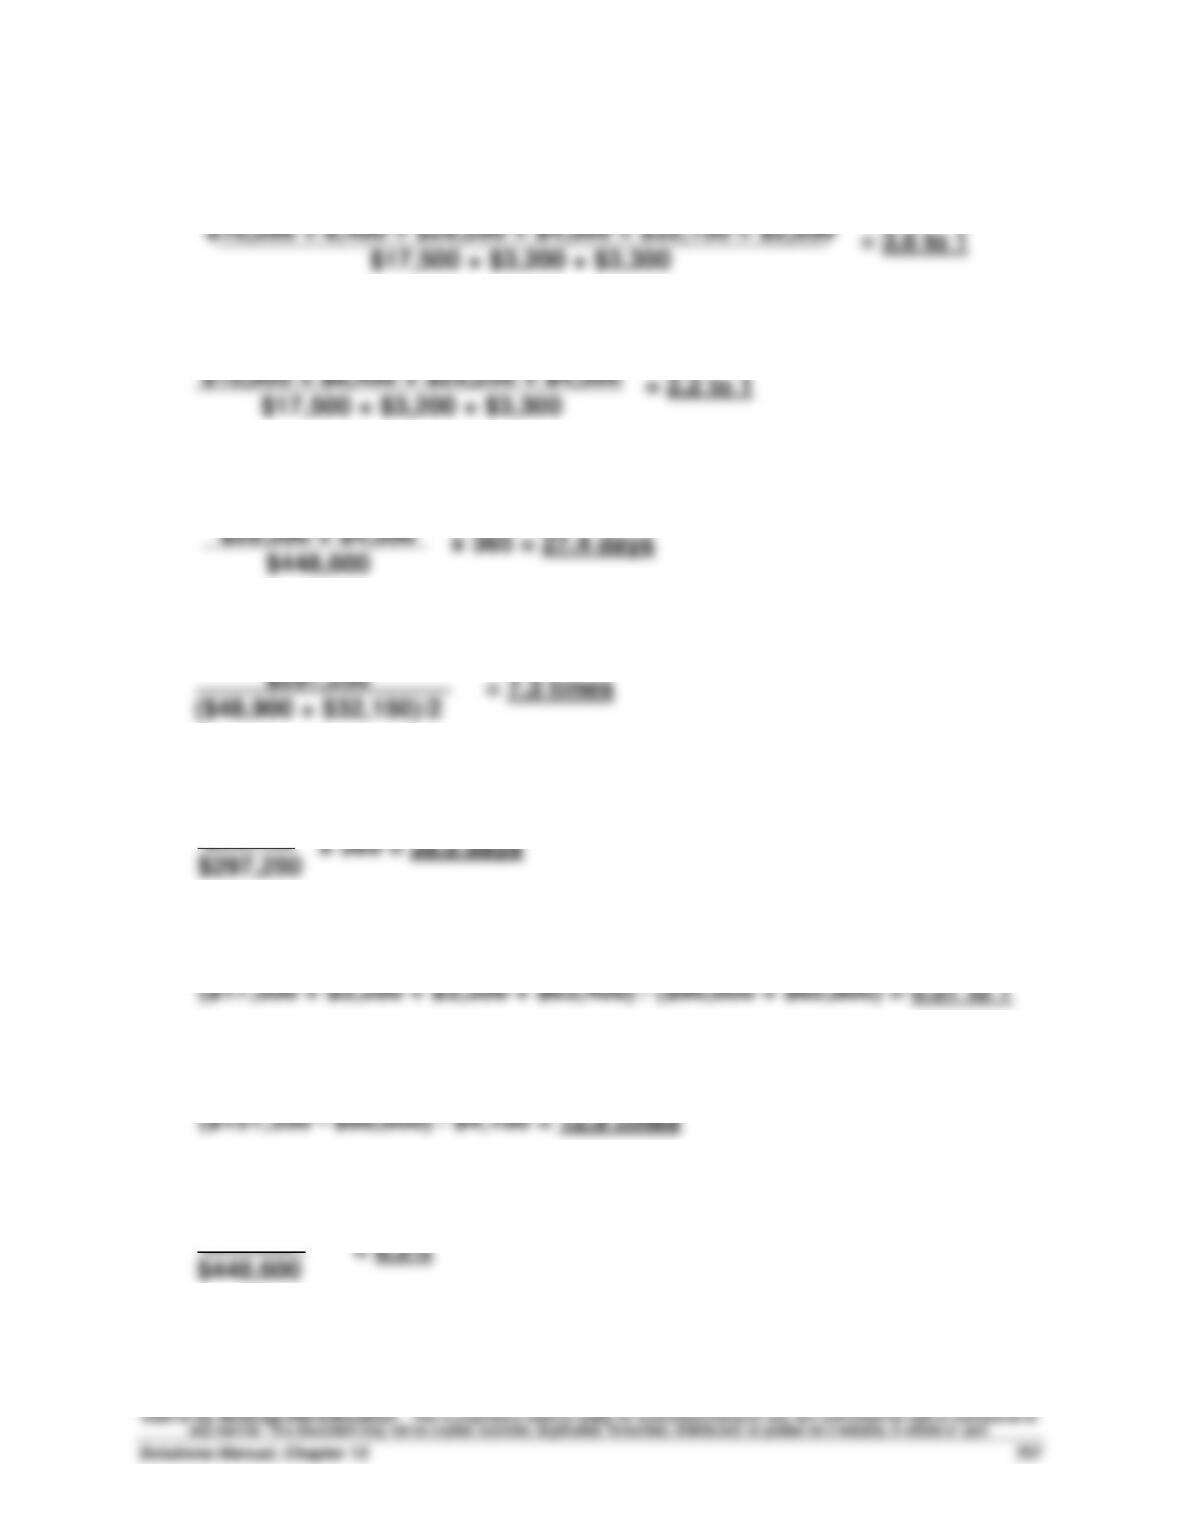
Problem 13-4A (50 minutes)
1. Current ratio
2. Acid-test ratio
3. Days’ sales uncollected
4. Inventory turnover
5. Days’ sales in inventory
6. Debt–to-equity ratio
7. Times interest earned
8. Profit margin ratio
$10,000 + 8,400 + $29,200 + $4,500 + $32,150 + $2,650
$17,500 + $3,200 + $3,300
$10,000 + $8,400 + $29,200 + $4,500
$17,500 + $3,200 + $3,300
$29,200 + $4,500
$448,600
$297,250
($48,900 + $32,150)/2
$32,150
$297,250
$29,052
$448,600
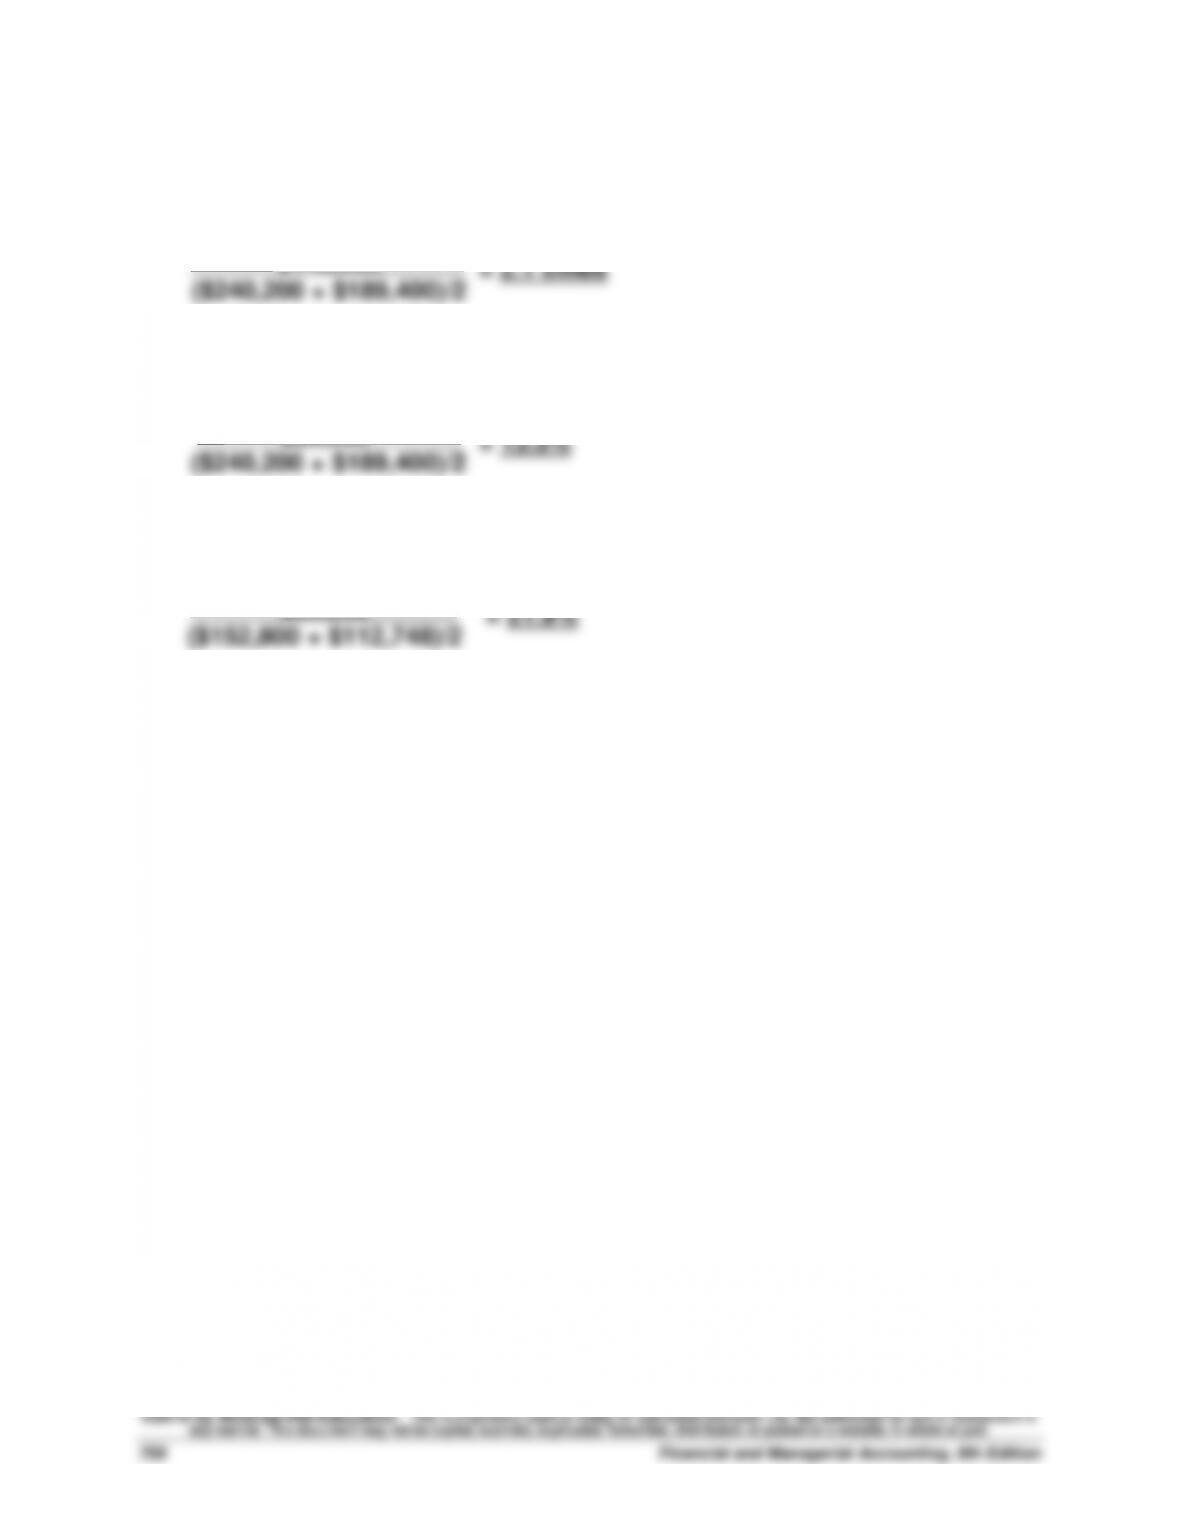
Problem 13-4A (Concluded)
9. Total asset turnover
10. Return on total assets
11. Return on common stockholders’ equity
$448,600
($240,200 + $189,400)/2
$29,052
($240,200 + $189,400)/2
$29,052
($152,800 + $112,748)/2
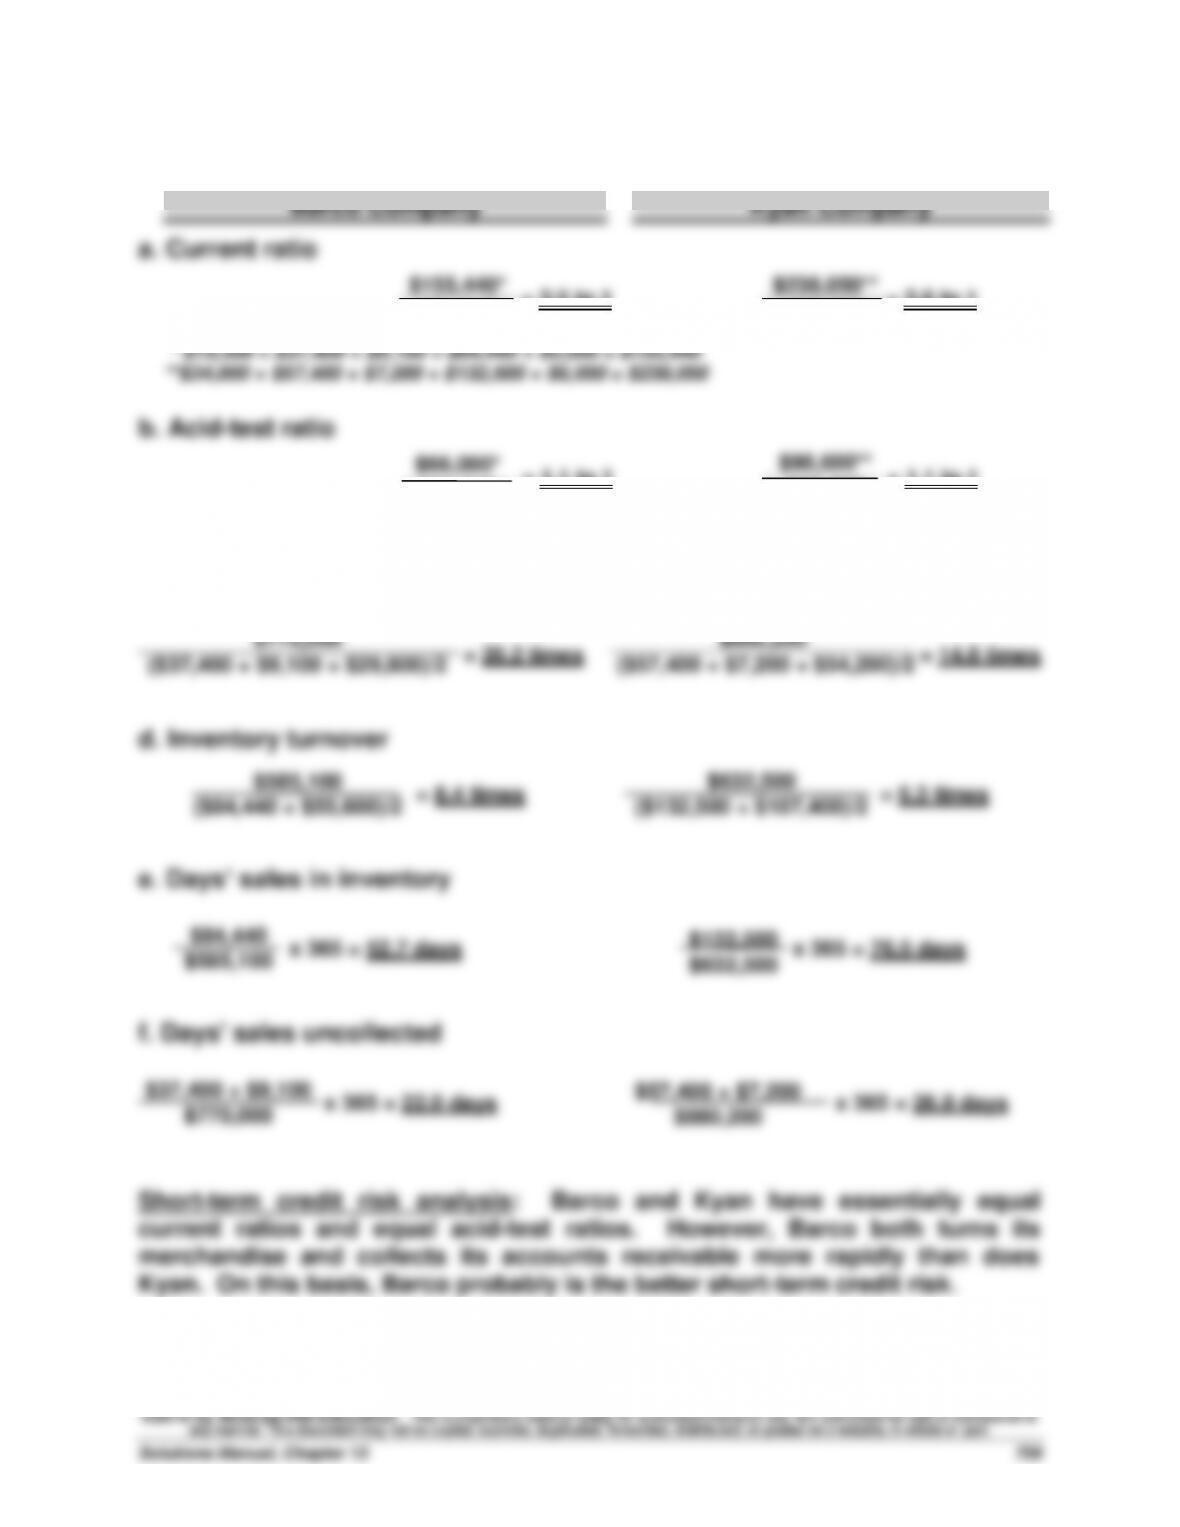
Problem 13-5A (60 minutes)
Part 1
Barco Company
Kyan Company
a. Current ratio
= 2.5 to 1
= 2.6 to 1
$155,440*
$61,340
$238,050**
$93,300
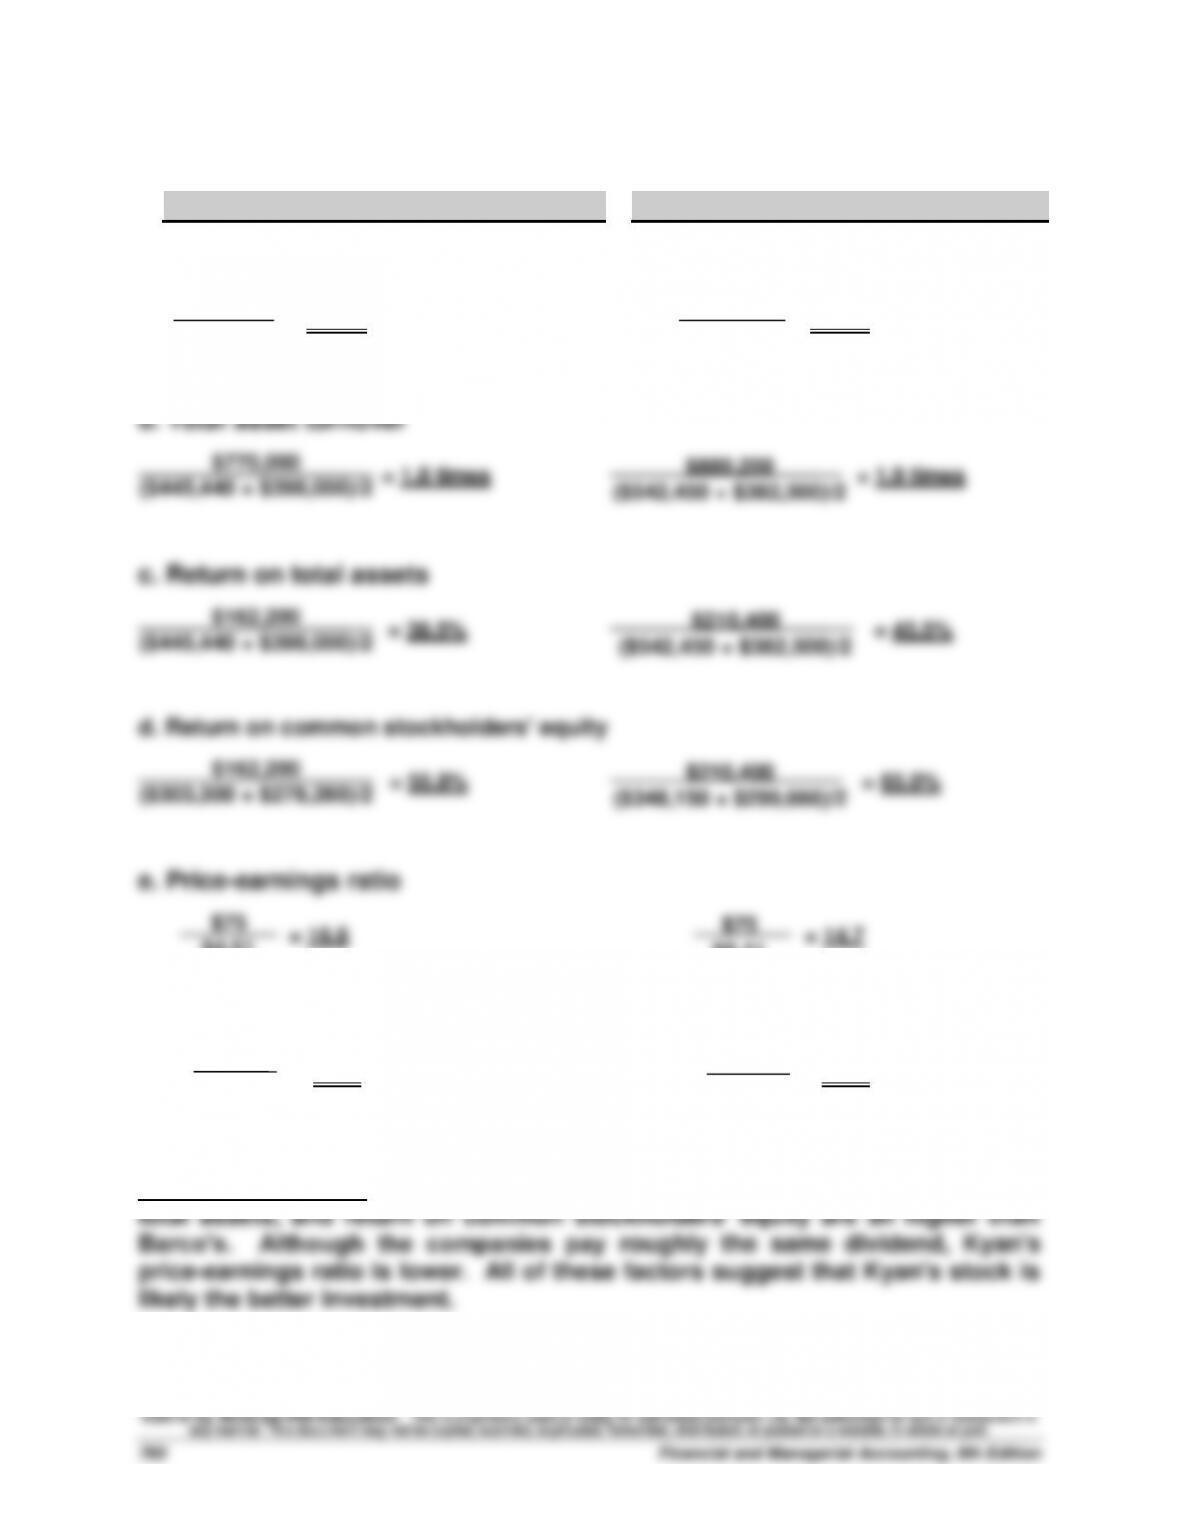
Problem 13–5A (Concluded)
Part 2
Barco Company
Kyan Company
a. Profit margin ratio
= 21.1% = 23.9%
f. Dividend yield
= 5.1% = 5.2%
Investment analysis: Kyan’s profit margin ratio, total asset turnover, return on
$162,200
$770,000
$4.51
$3.81
$75
$210,400
$880,200
$5.11
$3.93
$75
Problem 13–6AA (60 minutes)
Part 1
Effect of income taxes (debits or losses in parentheses)
Pretax
30% Tax
Effect
After-Tax
i. Loss from operating a discontinued segment …………..
(18,250)
(5,475)
(12,775)
j. Gain on insurance recovery of tornado damage …...
29,120
8,736
20,384
m. Correction of overstatement of prior year’s sales ……..
(16,000)
(4,800)
(11,200)
n. Gain on sale of discontinued segment’s assets ………..
34,000
10,200
23,800
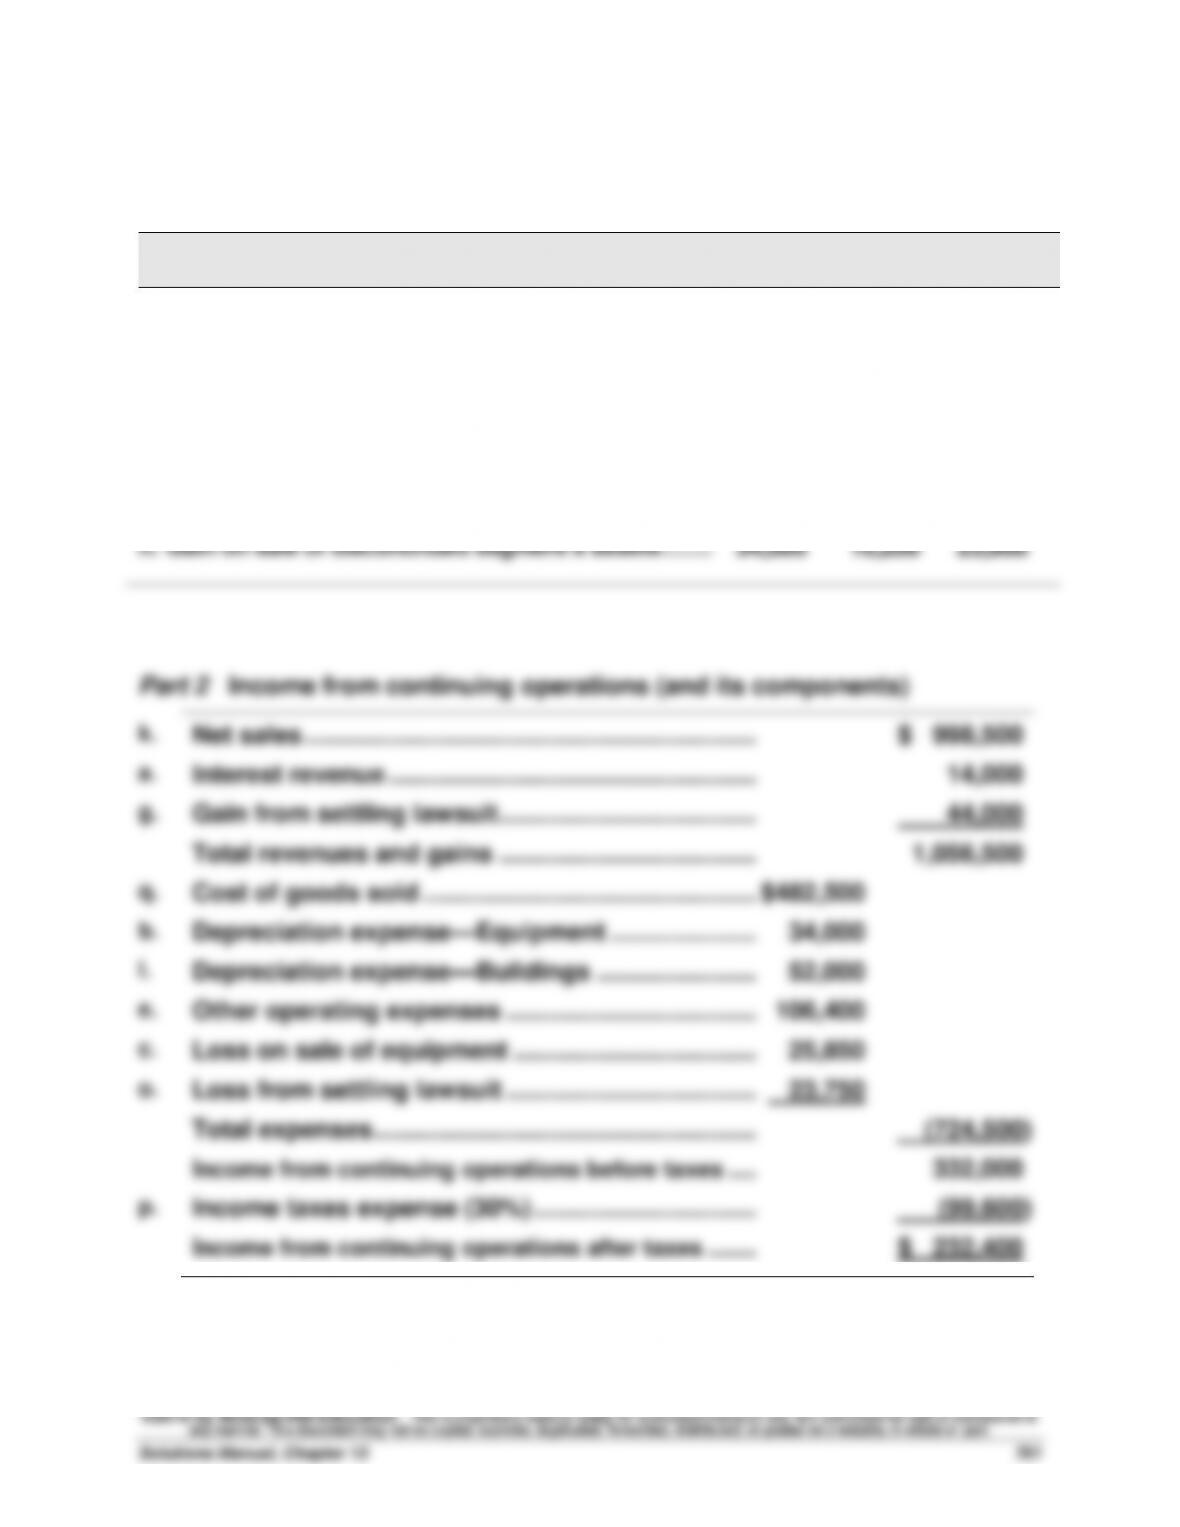
Part 2 Income from continuing operations (and its components)
k.
Net sales ………………………………………………………...
$ 998,500
a.
Interest revenue ……………………………………………...
14,000
g.
Gain from settling lawsuit …………………………..…...
44,000
Total revenues and gains ………………………………..
1,056,500
q.
Cost of goods sold …………………………..……………..
$482,500
b.
Depreciation expense—Equipment ………………….
34,000
l.
Depreciation expense—Buildings …………………...
52,000
e.
Other operating expenses ……………………………….
106,400
c.
Loss on sale of equipment …………………………..….
25,850
o.
Loss from settling lawsuit …………………………..…..
23,750
Total expenses …………………………..…………………...
(724,500)
Income from continuing operations before taxes …..
332,000
p.
Income taxes expense (30%) …………………………..
(99,600)
Income from continuing operations after taxes ……..
$ 232,400
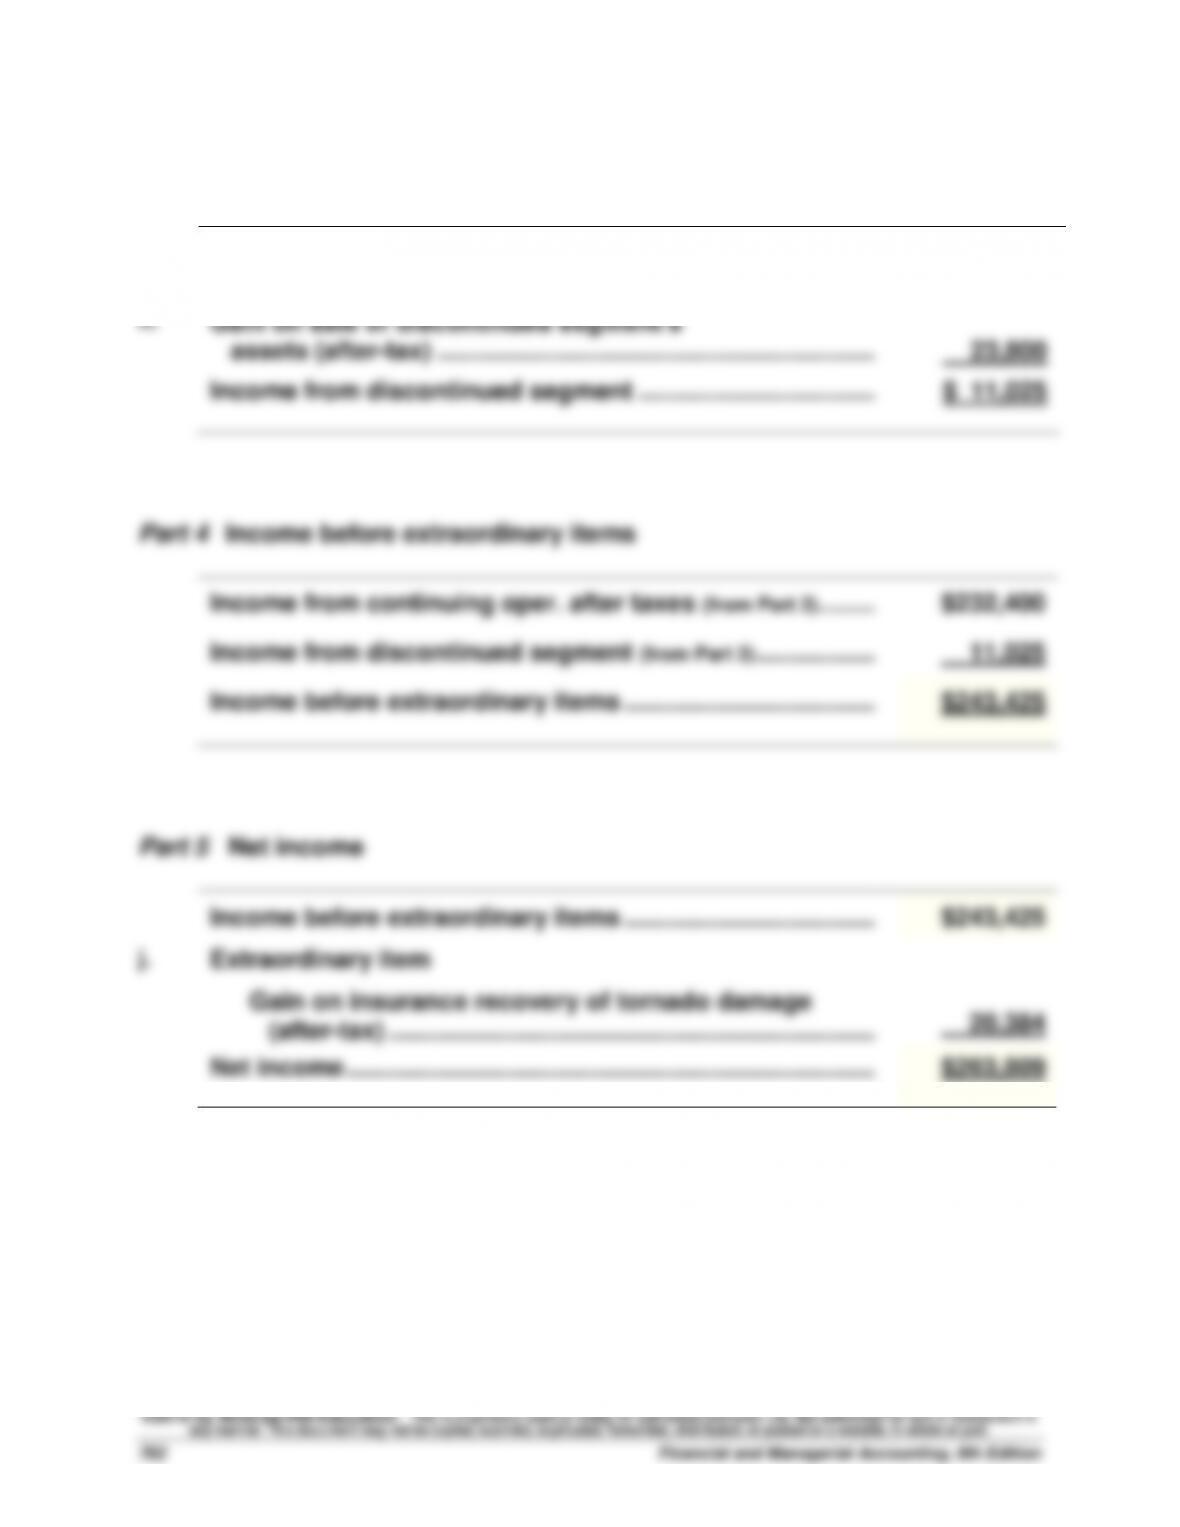
Problem 13–6AA (Concluded)
Part 3 Income from discontinued segment
i.
Loss from operating a discontinued
segment (after-tax) …………………………………………………….…
$ (12,775)
n.
Gain on sale of discontinued segment’s
assets (after-tax) ……………………………………………………….
23,800
Income from discontinued segment ……………………………..…………………..
$ 11,025
Part 4 Income before extraordinary items
Income from continuing oper. after taxes (from Part 2) …………………………..
$232,400
Income from discontinued segment (from Part 3) …………………………..
11,025
Income before extraordinary items …………………………..…..…………………..
$243,425
Part 5 Net income
Income before extraordinary items …………………………..…..…………………..
$243,425
j.
Extraordinary item
Gain on insurance recovery of tornado damage
(after-tax) ……………………………………………………….…….…………………..
20,384
Net income …………………………………………………………………..……………….
$263,809
Problem 13-1B (120 minutes)
Part 1
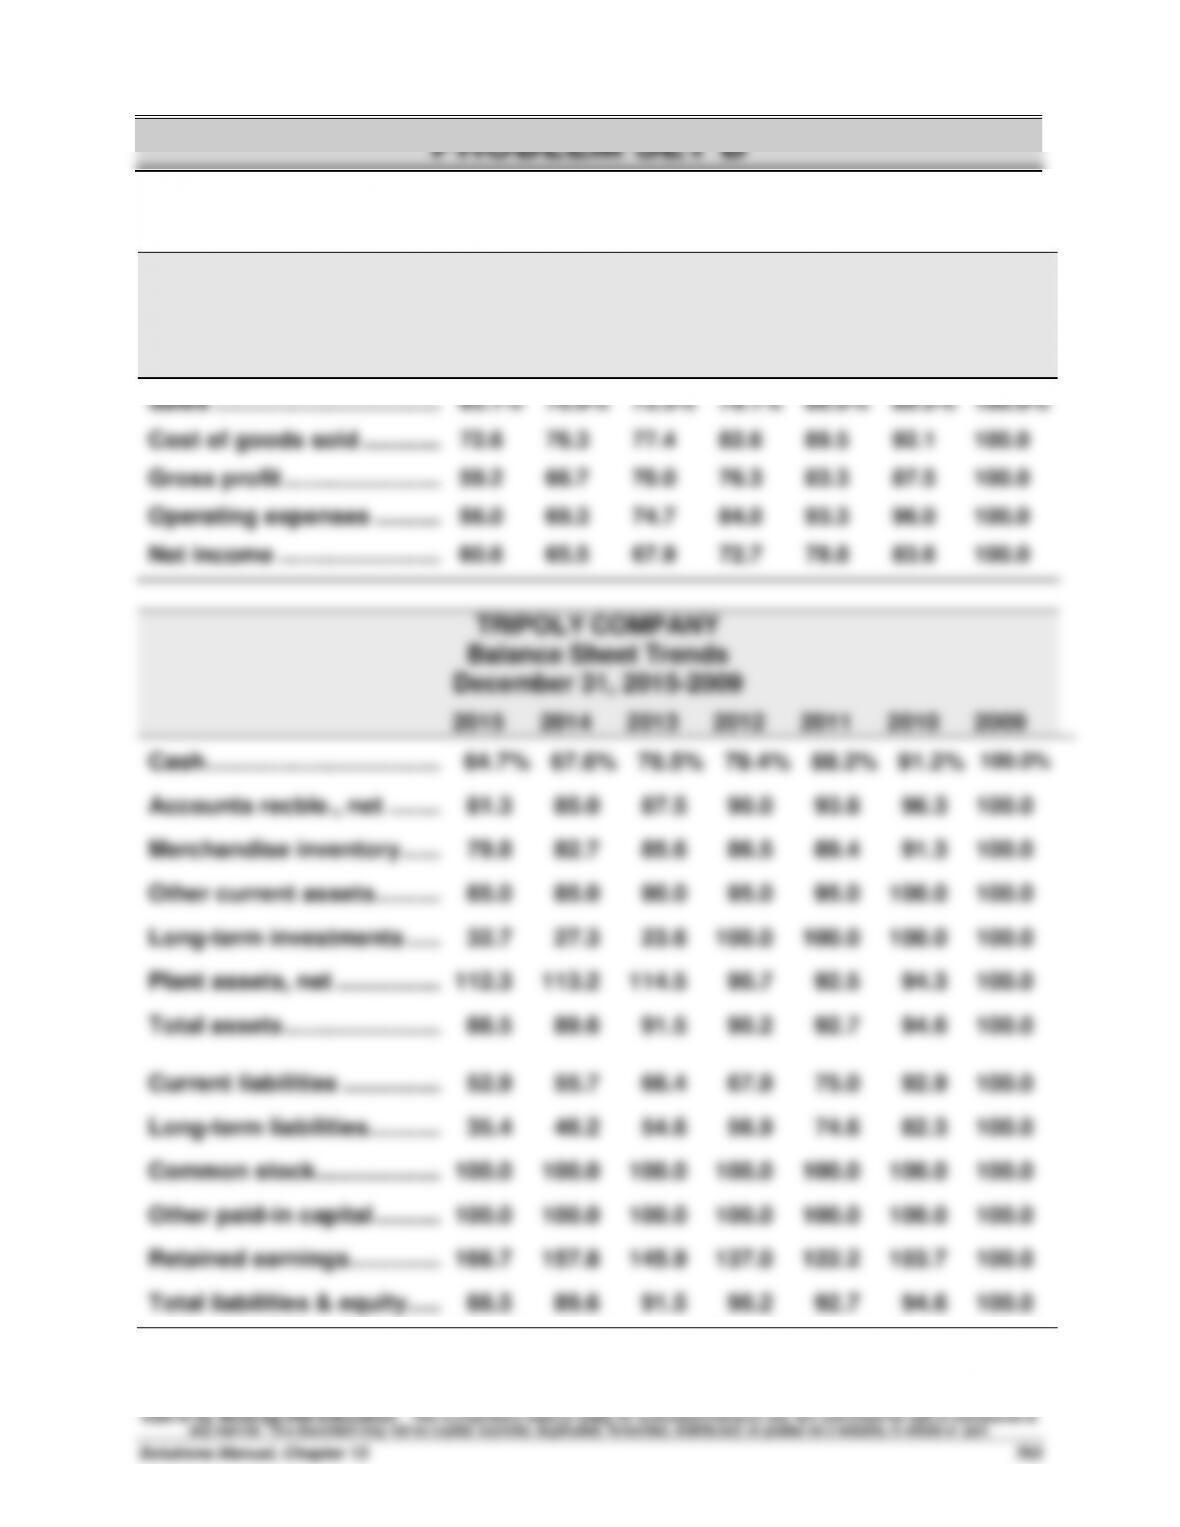
TRIPOLY COMPANY
Income Statement Trends
For Years Ended December 31, 2015-2009
2015
2014
2013
2012
2011
2010
2009
Sales ……………………………….
65.1%
70.9%
73.3%
79.1%
86.0%
89.5%
100.0%
Cost of goods sold …………..
72.6
76.3
77.4
82.6
89.5
92.1
100.0
Gross profit ……………………..
59.2
66.7
70.0
76.3
83.3
87.5
100.0
Operating expenses ………...
56.0
69.3
74.7
84.0
93.3
96.0
100.0
Net income ……………………...
60.6
65.5
67.9
72.7
78.8
83.6
100.0
TRIPOLY COMPANY
Balance Sheet Trends
December 31, 2015-2009
2015
2014
2013
2012
2011
2010
2009
Cash ………………………………
64.7%
67.6%
76.5%
79.4%
88.2%
91.2%
100.0%
Accounts recble., net ……….
81.3
85.0
87.5
90.0
93.8
96.3
100.0
Merchandise inventory ……..
79.8
82.7
85.6
86.5
89.4
91.3
100.0
Other current assets ………...
85.0
85.0
90.0
95.0
95.0
100.0
100.0
Long-term investments …….
32.7
27.3
23.6
100.0
100.0
100.0
100.0
Plant assets, net ……………...
112.3
113.2
114.5
90.7
92.5
94.3
100.0
Total assets ……………………..
88.5
89.6
91.5
90.2
92.7
94.6
100.0
Current liabilities ……………..
52.9
55.7
66.4
67.9
75.0
92.9
100.0
Long-term liabilities ………….
35.4
46.2
54.6
56.9
74.6
82.3
100.0
Common stock ………………...
100.0
100.0
100.0
100.0
100.0
100.0
100.0
Other paid-in capital ………...
100.0
100.0
100.0
100.0
100.0
100.0
100.0
Retained earnings …………….
166.7
157.8
145.9
137.0
122.2
103.7
100.0
Total liabilities & equity …….
88.5
89.6
91.5
90.2
92.7
94.6
100.0
Problem 13-1B (Concluded)
Part 2
Analysis and Interpretation
The statements and the trend percent data show that sales declined
every year. However, cost of goods sold did not fall as rapidly as sales.