Unlock document.
This document is partially blurred.
Unlock all pages and 1 million more documents.
Get Access
Exercise 13-8 (25 minutes)
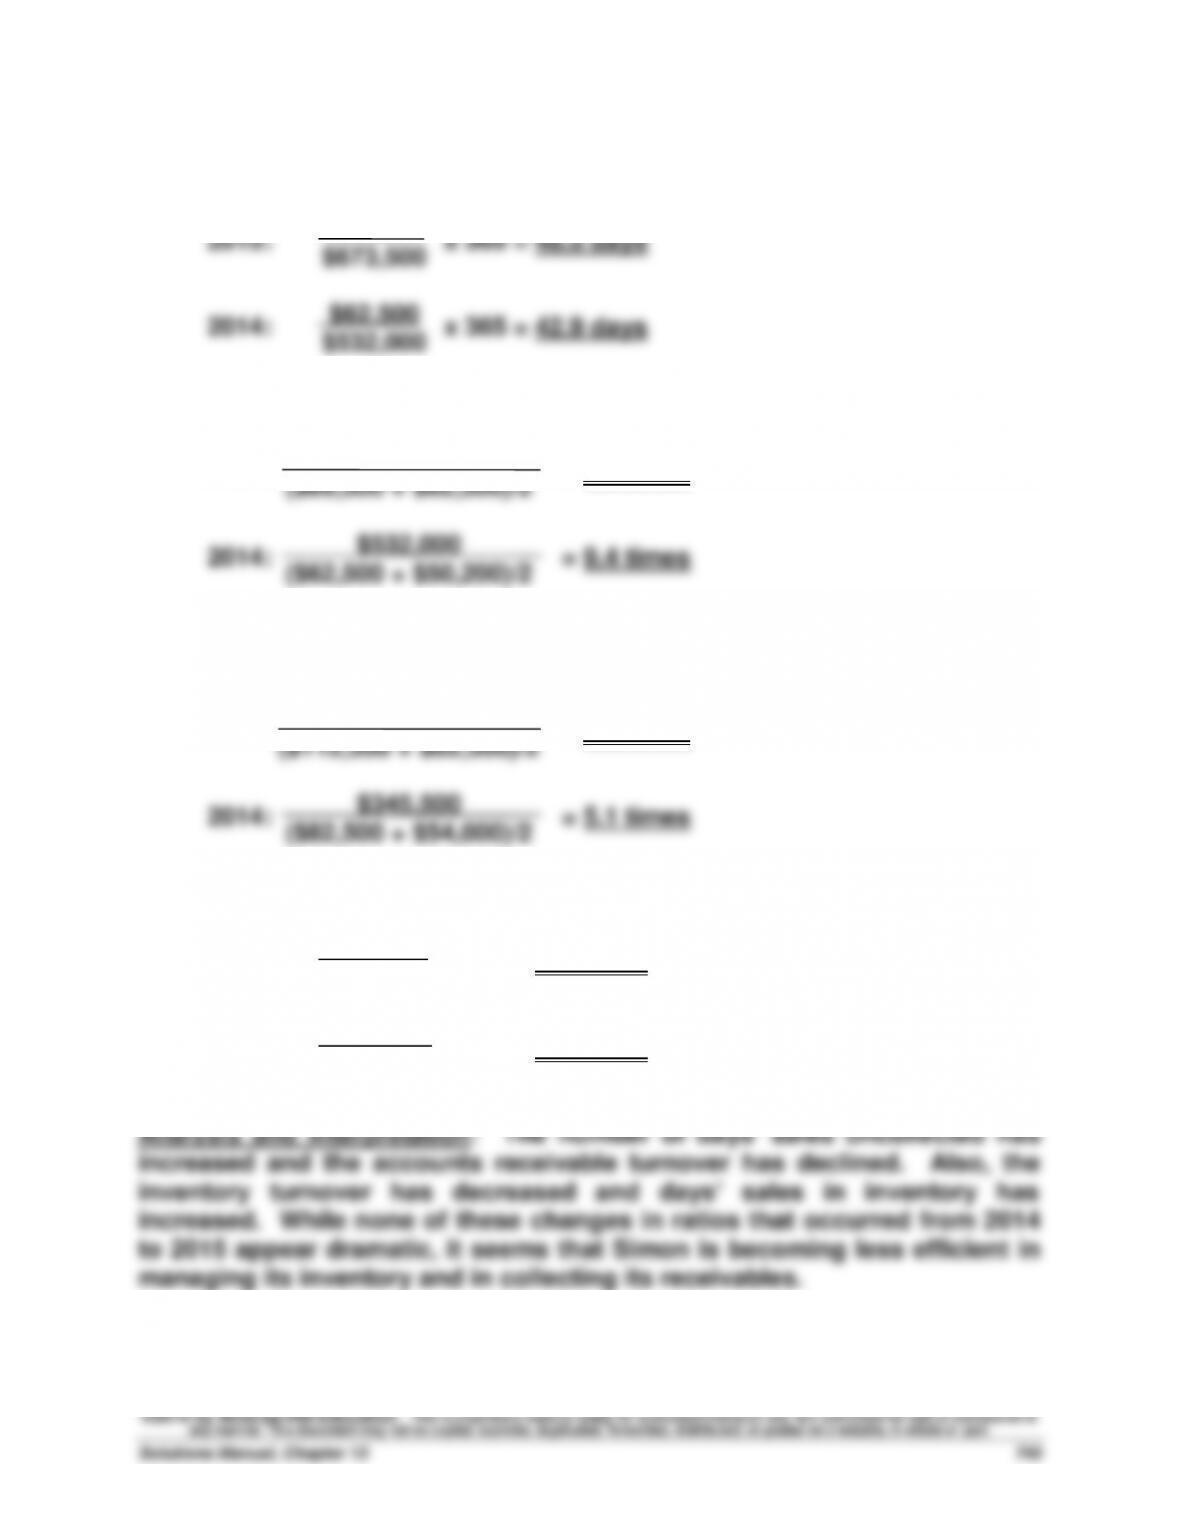
1. Days' sales uncollected
2. Accounts receivable turnover
2015: = 8.9 times
3. Inventory turnover
2015: = 4.2 times
4. Days’ sales in inventory
2015: x 365 = 99.9 days
2014: x 365 = 87.2 days
$89,500
$532,000
$673,500
($89,500 + $62,500)/2
($62,500 + $50,200)/2
$411,225
($112,500 + $82,500)/2
($82,500 + $54,000)/2
$112,500
$411,225
$82,500
$345,500
Exercise 13-9 (25 minutes)
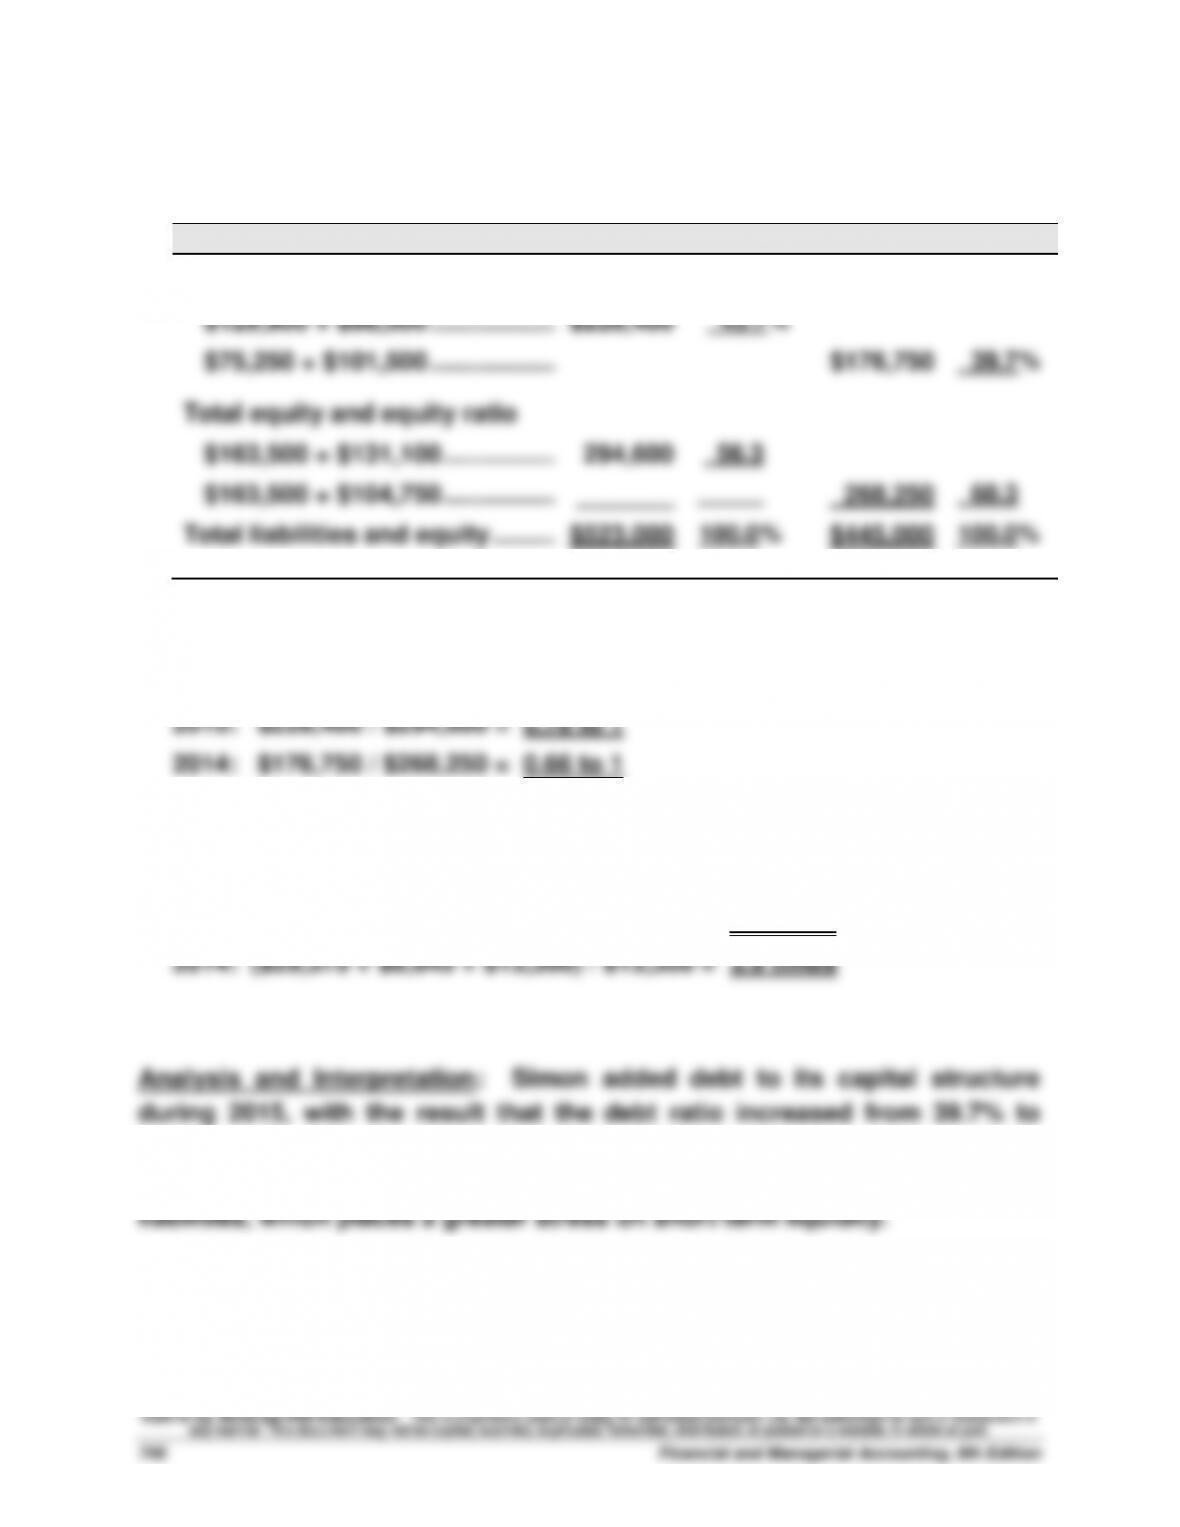
1. Debt and equity ratios
2015
2014
Total liabilities and debt ratio
$129,900 + $98,500 .......................
$228,400
43.7%
$75,250 + $101,500 .......................
$176,750
39.7%
Total equity and equity ratio
$163,500 + $131,100 .....................
294,600
56.3
$163,500 + $104,750 .....................
_______
_____
268,250
60.3
Total liabilities and equity ...............
$523,000
100.0%
$445,000
100.0%
2. Debt-to-equity ratio
3. Times interest earned
2015: ($31,100 + $9,525 + $12,100) / $12,100 = 4.4 times
43.7%. In addition, the debt-to-equity ratio also increased from 0.66 to 1 to
0.78 to 1. We should note that the debt increase is mostly in current
Exercise 13-10 (30 minutes)
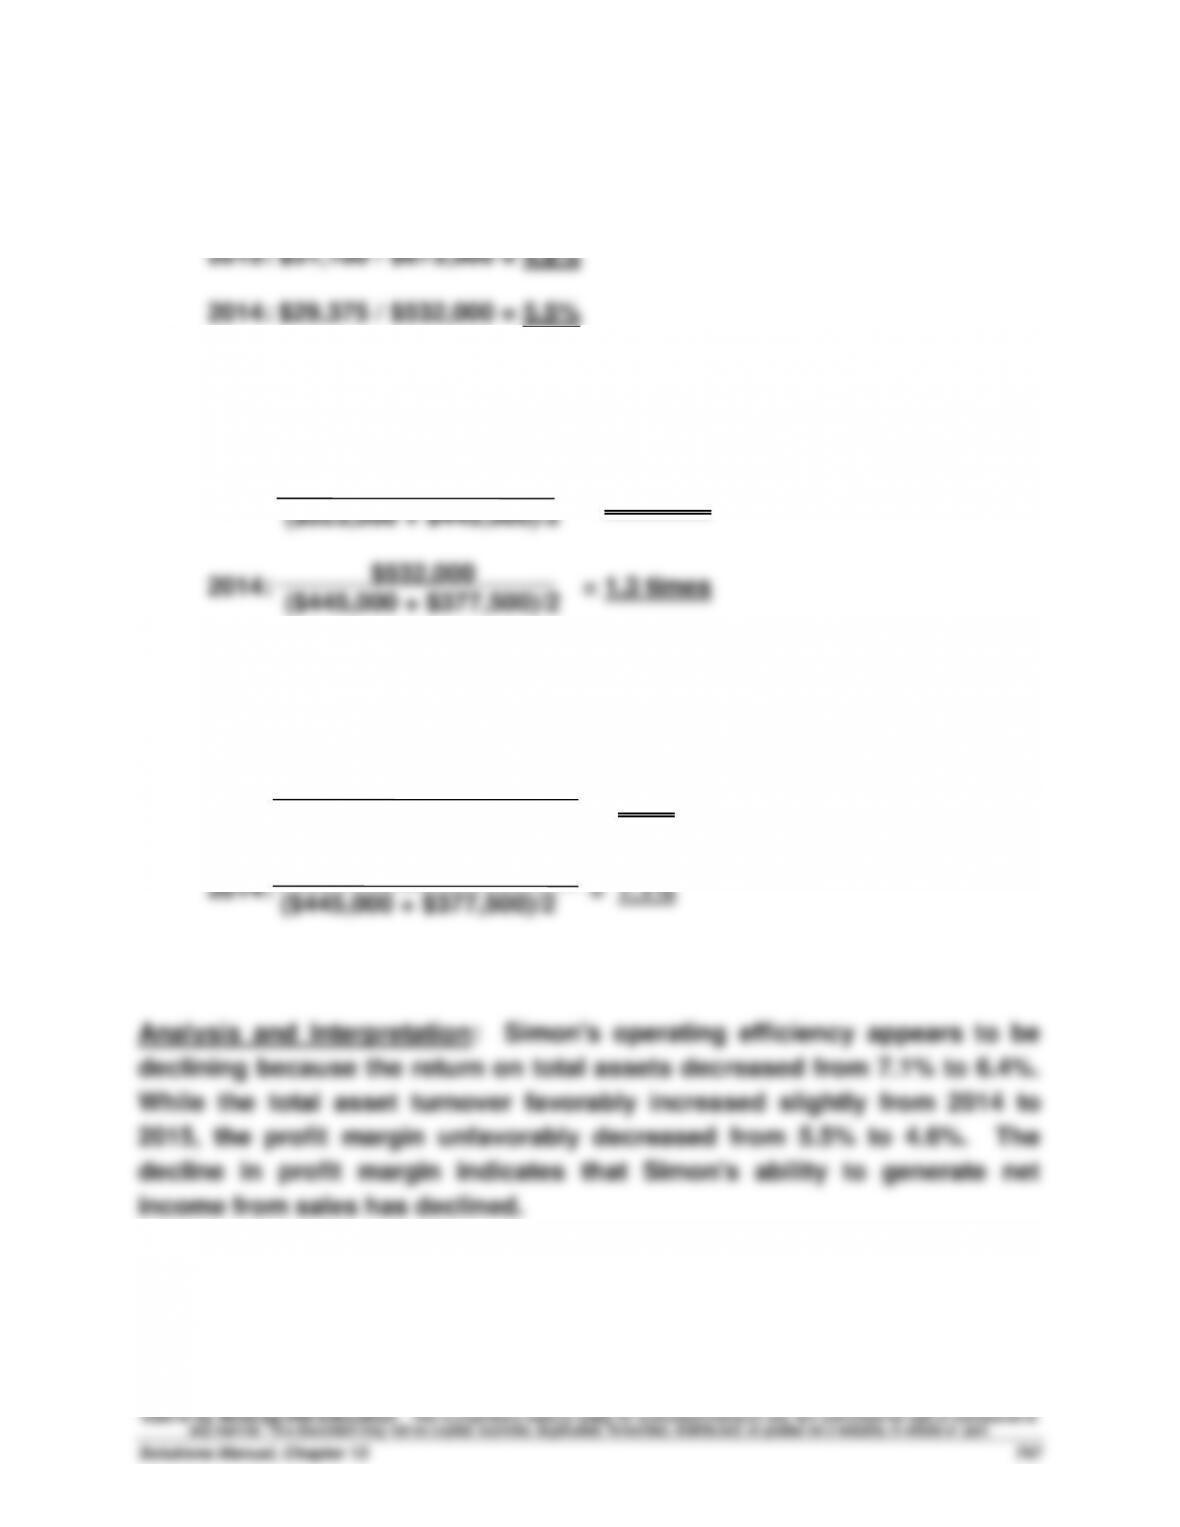
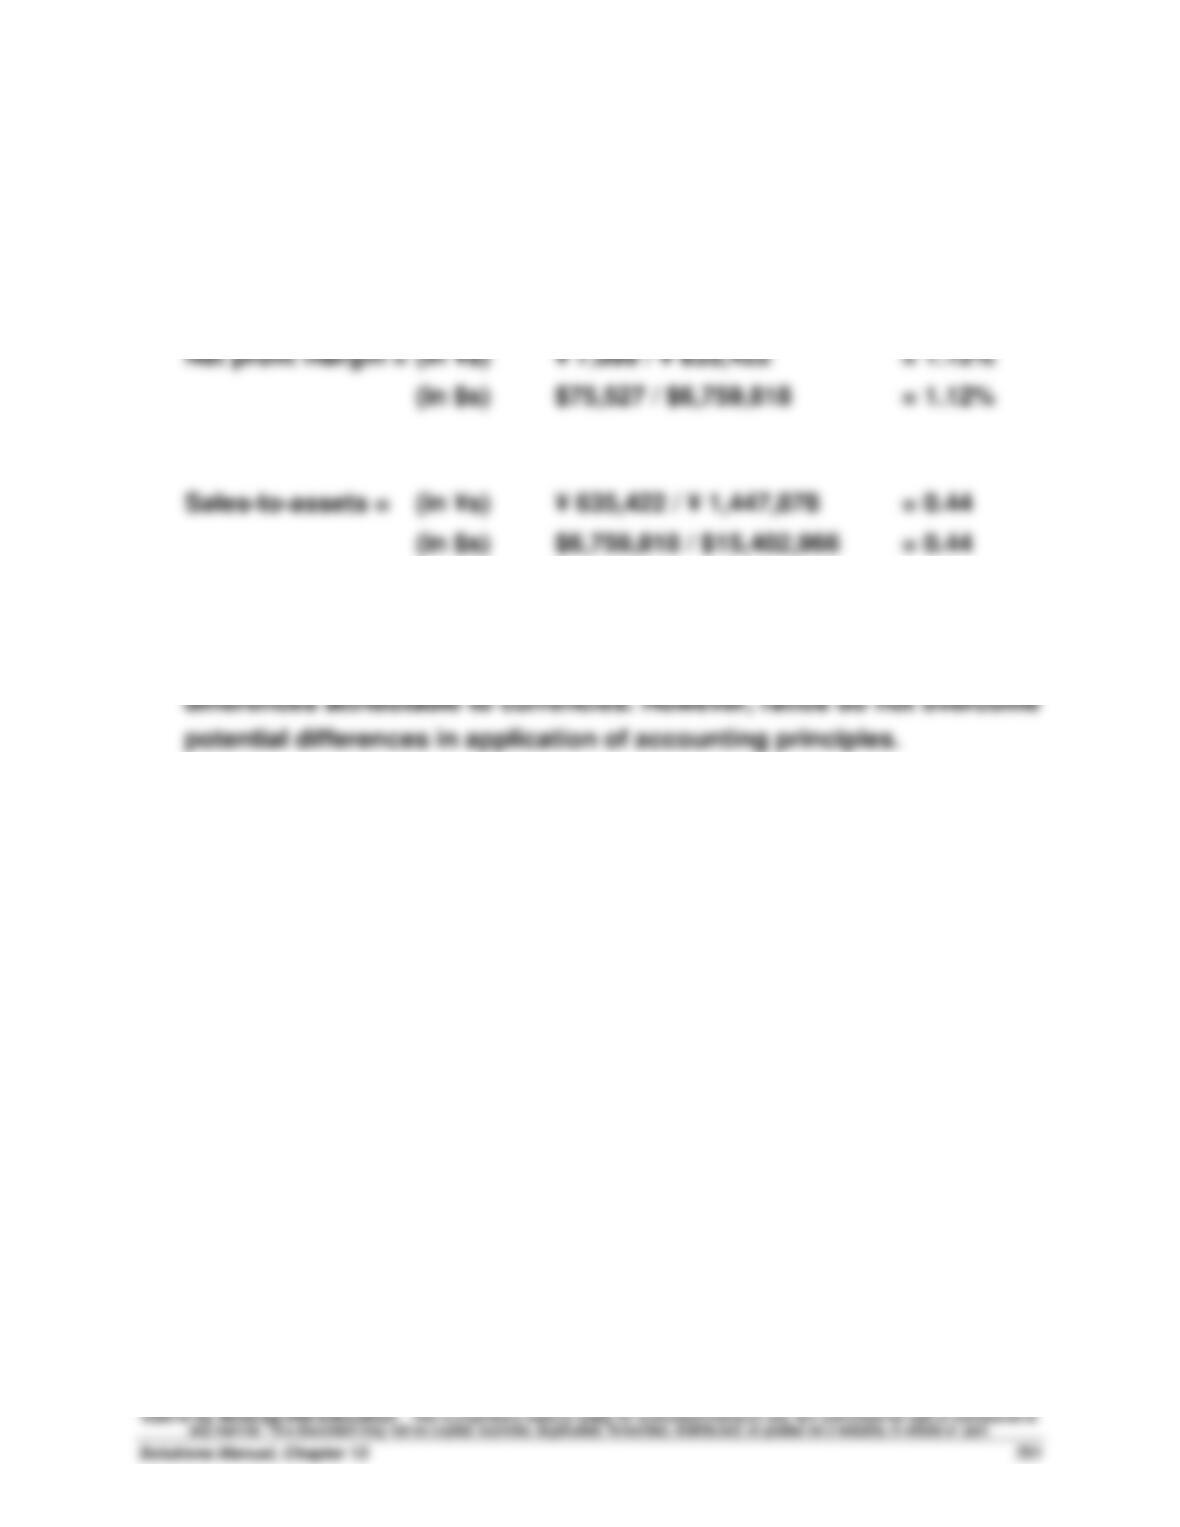
1. Profit margin
2. Total asset turnover
2015: = 1.4 times
3. Return on total assets
2015: = 6.4%
$673,500
($523,000 + $445,000)/2
($445,000 + $377,500)/2
$31,100
($523,000 + $445,000)/2
$29,375
Exercise 13-11 (20 minutes)
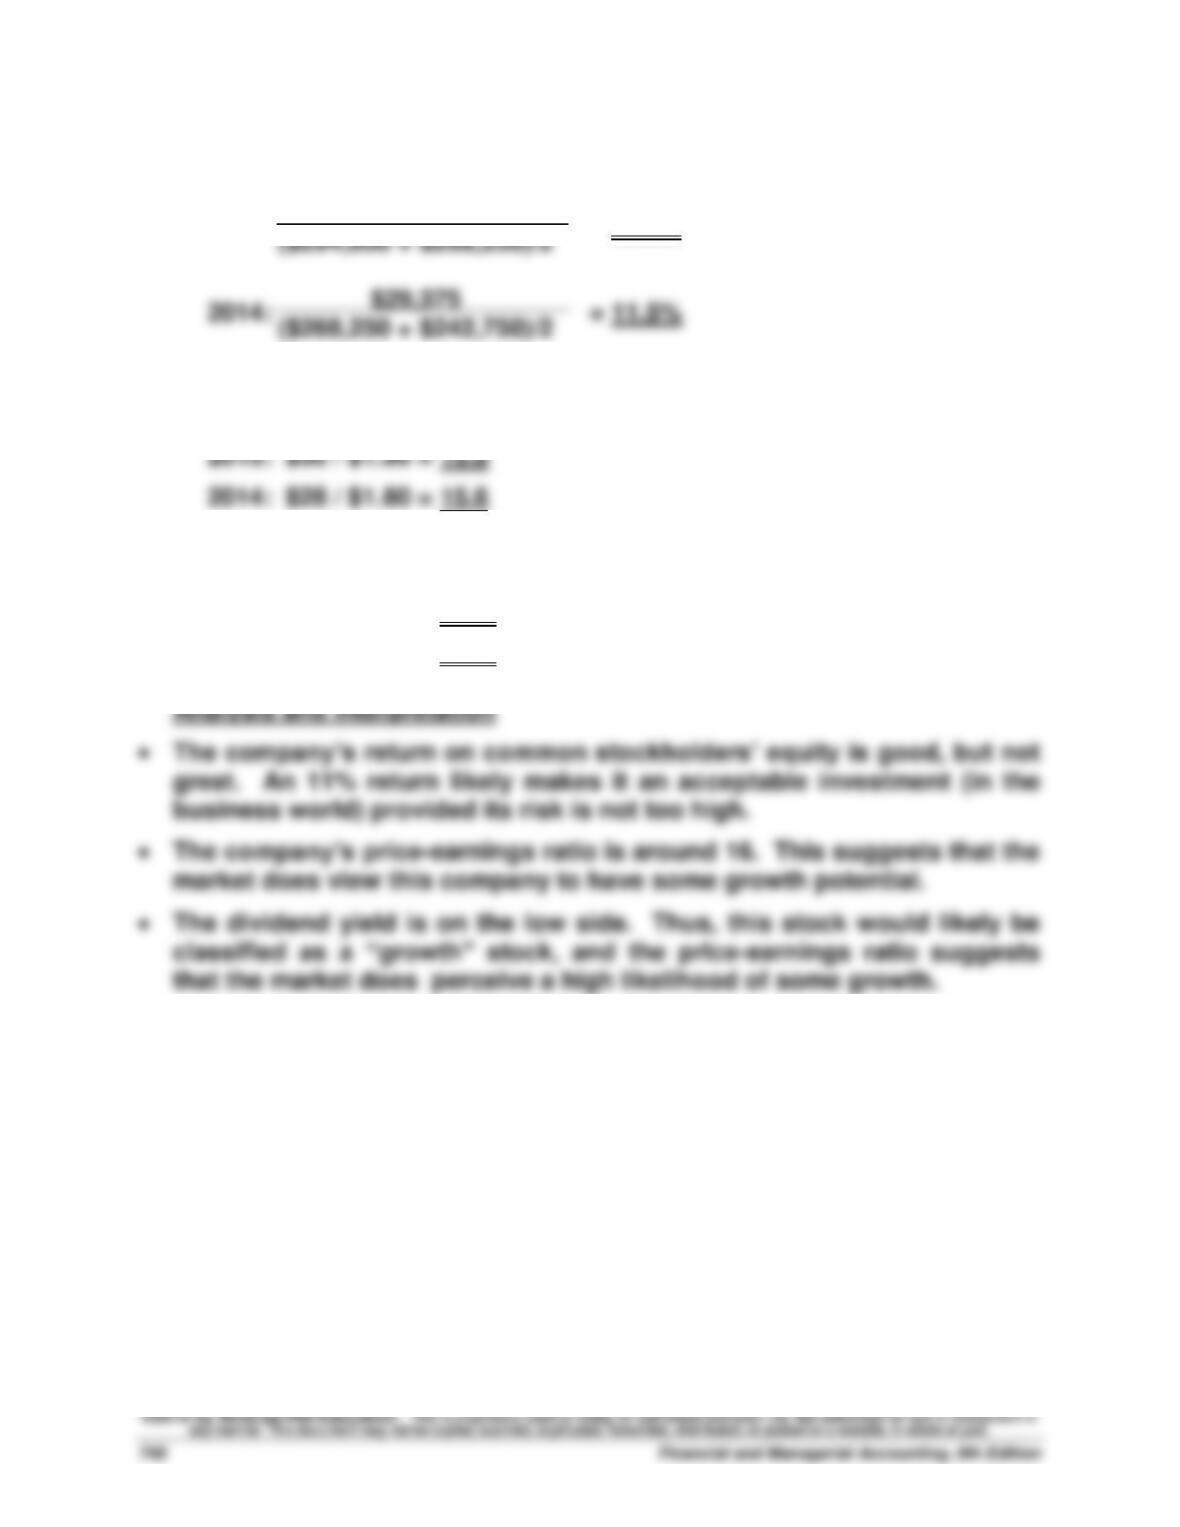
1. Return on common stockholders' equity
2015: = 11.1%
2. Price-earnings ratio, December 31
3. Dividend yield
2015: $0.29 / $30 = 0.1%
2014: $0.24 / $28 = 0.9%
$31,100
($294,600 + $268,250)/2
($268,250 + $242,750)/2
Exercise 13-12 (30 minutes)
COMPARATIVE ANALYSIS REPORT
Clay's profit margins are higher than Roak's. However, Roak has
significantly higher total asset turnover ratios. As a result, Roak generates
a substantially higher return on total assets.
Exercise 13-13A (10 minutes)
1. A Income (loss) from continuing operations
2. C Extraordinary gain (loss)
3. A Income (loss) from continuing operations
4. A Income (loss) from continuing operations
5. A Income (loss) from continuing operations
6. B Gain (loss) from disposing of a discontinued segment
7. B Income (loss) from operating a discontinued segment
Exercise 13-14 (15 minutes)
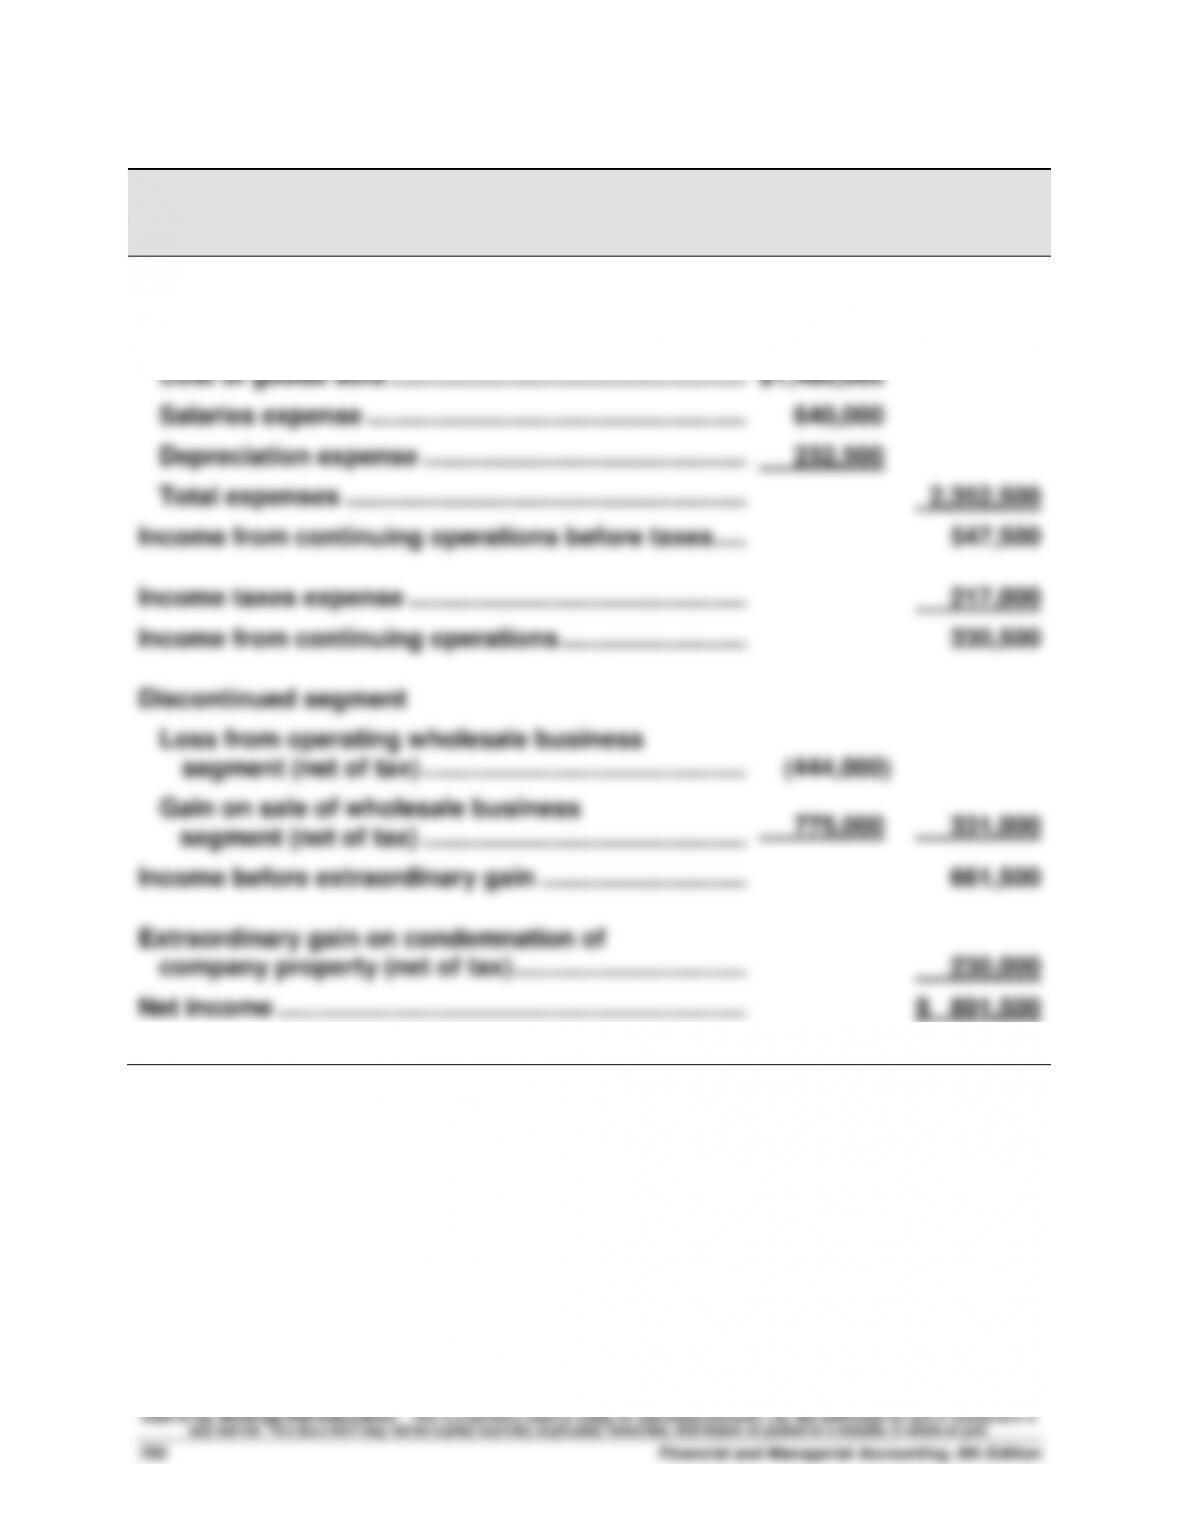
RANDA MERCHANDISING, INC.
Income Statement
For Year Ended December 31, 2015
Net sales ..........................................................................
$2,900,000
Expenses
Cost of goods sold ......................................................
$1,480,000
Salaries expense .........................................................
640,000
Depreciation expense .................................................
232,500
Total expenses ............................................................
2,352,500
Income from continuing operations before taxes .......
547,500
Income taxes expense ...................................................
217,000
Income from continuing operations .............................
330,500
Discontinued segment
Loss from operating wholesale business
segment (net of tax) .................................................
(444,000)
Gain on sale of wholesale business
segment (net of tax) .................................................
775,000
331,000
Income before extraordinary gain ................................
661,500
Extraordinary gain on condemnation of
company property (net of tax) ....................................
230,000
Net income ......................................................................
$ 891,500
Exercise 13-15 (15 minutes)
1. Current ratio = (in ¥s) ¥ 1,192,250 / ¥ 194,475 = 6.13
(in $s) $12,683,516 / $2,068,887 = 6.13
2. The results in part 1 reveal that ratios can help us overcome
©2016 by McGraw-Hill Education. This is proprietary material solely for authorized instructor use. Not authorized for sale or distribution in
any manner. This document may not be copied, scanned, duplicated, forwarded, distributed, or posted on a website, in whole or part.
Financial and Managerial Accounting, 6th Edition
752
PROBLEM SET A
Problem 13-1A (120 minutes)
Part 1
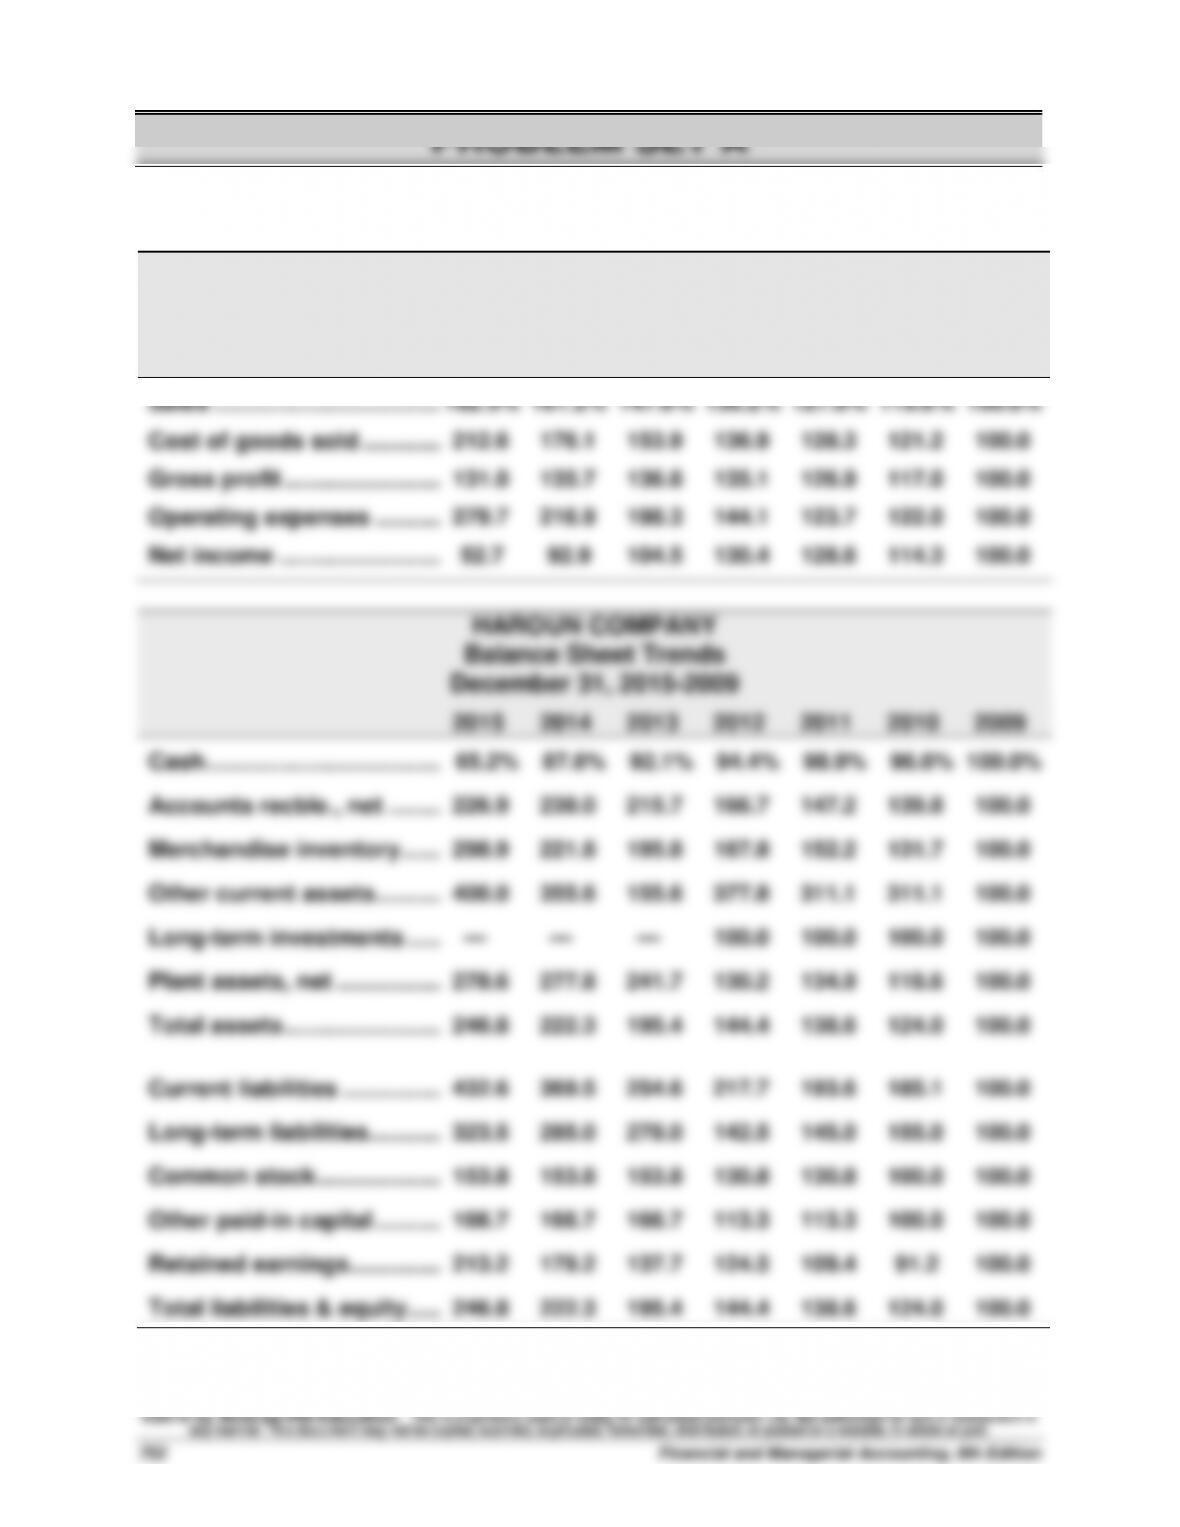
HAROUN COMPANY
Income Statement Trends
For Years Ended December 31, 2015-2009
2015
2014
2013
2012
2011
2010
2009
Sales .....................................
182.5%
161.2%
147.6%
136.2%
127.8%
119.6%
100.0%
Cost of goods sold ..............
212.6
176.1
153.9
136.9
128.3
121.2
100.0
Gross profit ..........................
131.0
135.7
136.8
135.1
126.9
117.0
100.0
Operating expenses ............
279.7
216.9
198.3
144.1
123.7
122.0
100.0
Net income ...........................
52.7
92.9
104.5
130.4
128.6
114.3
100.0
HAROUN COMPANY
Balance Sheet Trends
December 31, 2015-2009
2015
2014
2013
2012
2011
2010
2009
Cash ......................................
65.2%
87.6%
92.1%
94.4%
98.9%
96.6%
100.0%
Accounts recble., net ..........
226.9
238.0
215.7
166.7
147.2
139.8
100.0
Merchandise inventory ........
298.9
221.8
195.8
167.8
152.2
131.7
100.0
Other current assets ............
400.0
355.6
155.6
377.8
311.1
311.1
100.0
Long-term investments .......
—
—
—
100.0
100.0
100.0
100.0
Plant assets, net ..................
278.6
277.8
241.7
130.2
134.9
118.6
100.0
Total assets ..........................
246.8
222.3
195.4
144.4
138.6
124.0
100.0
Current liabilities .................
432.6
369.5
254.6
217.7
193.6
185.1
100.0
Long-term liabilities .............
323.5
285.0
278.0
142.5
145.0
155.0
100.0
Common stock .....................
153.8
153.8
153.8
130.8
130.8
100.0
100.0
Other paid-in capital ............
166.7
166.7
166.7
113.3
113.3
100.0
100.0
Retained earnings ................
213.2
179.2
137.7
124.5
109.4
91.2
100.0
Total liabilities & equity .......
246.8
222.3
195.4
144.4
138.6
124.0
100.0
Problem 13-1A (concluded)
Part 2
Analysis and Interpretation
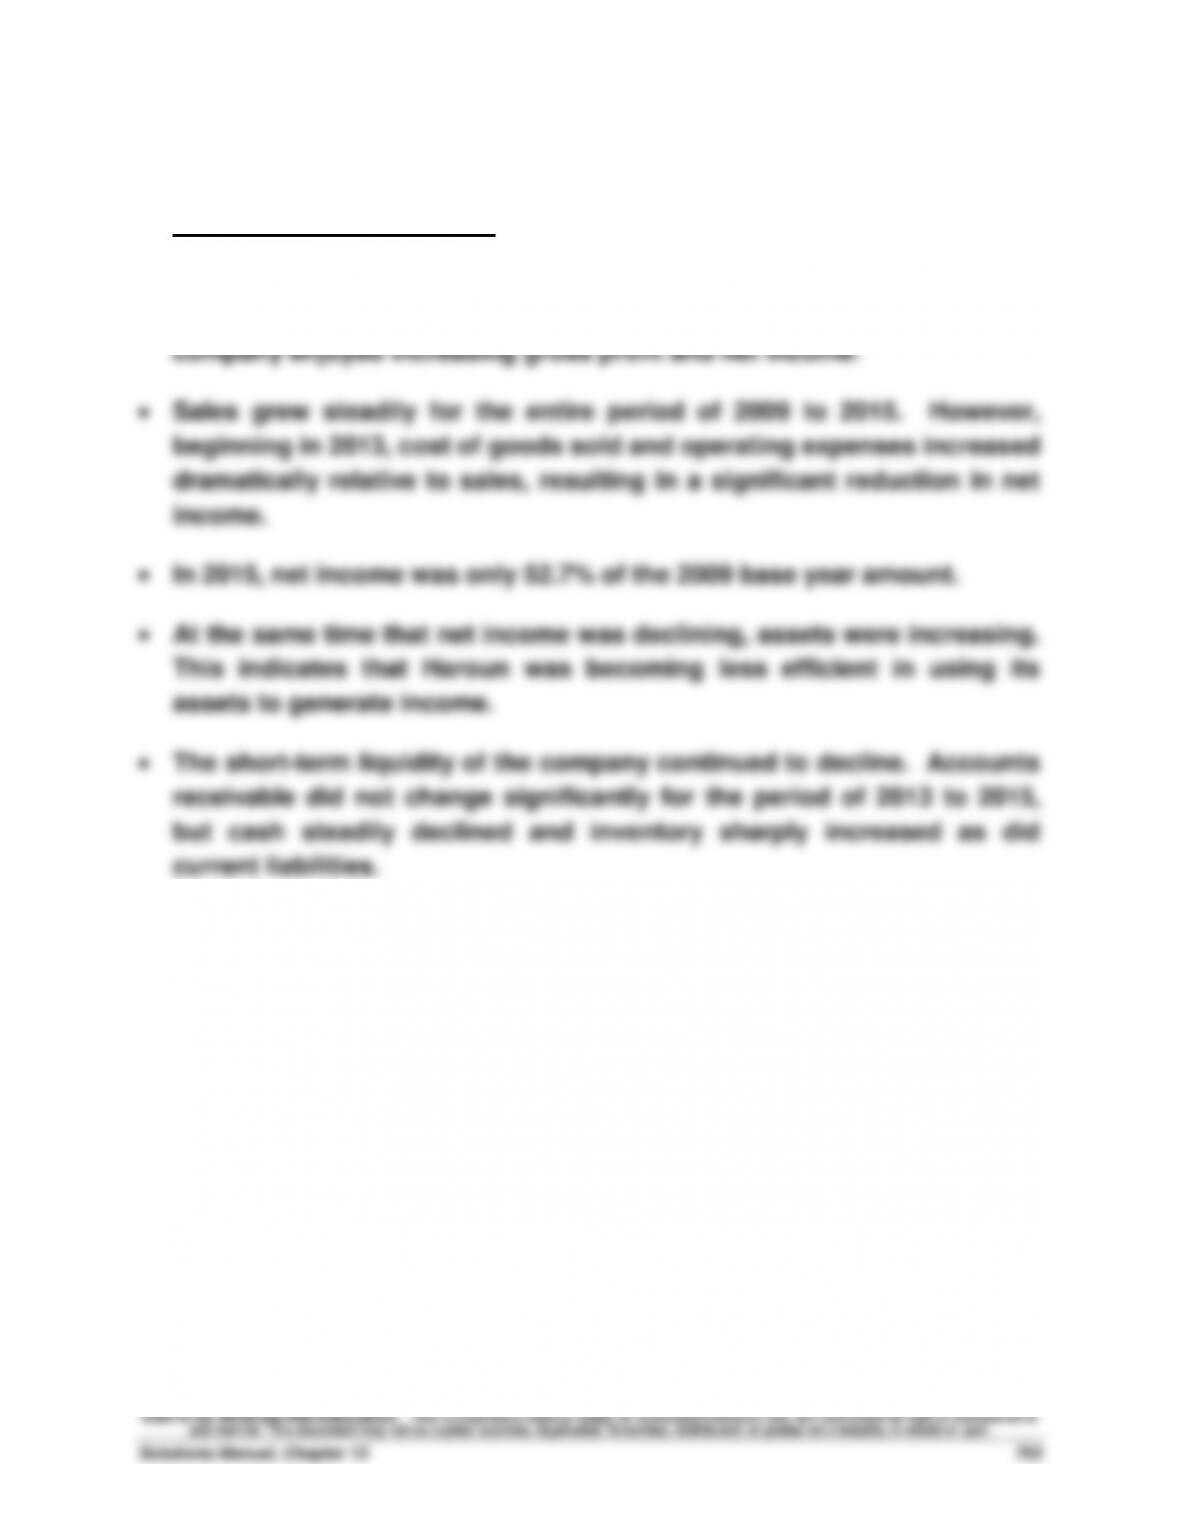
The statements and the trend percent data indicate that the company
significantly expanded its plant assets in 2013. Prior to that time, the
Problem 13-2A (60 minutes)
Part 1
Current ratio: December 31, 2015: $52,390 / $22,800 = 2.3 to 1
December 31, 2014: $37,924 / $19,960 = 1.9 to 1
December 31, 2013: $51,748 / $20,300 = 2.5 to 1
Part 2
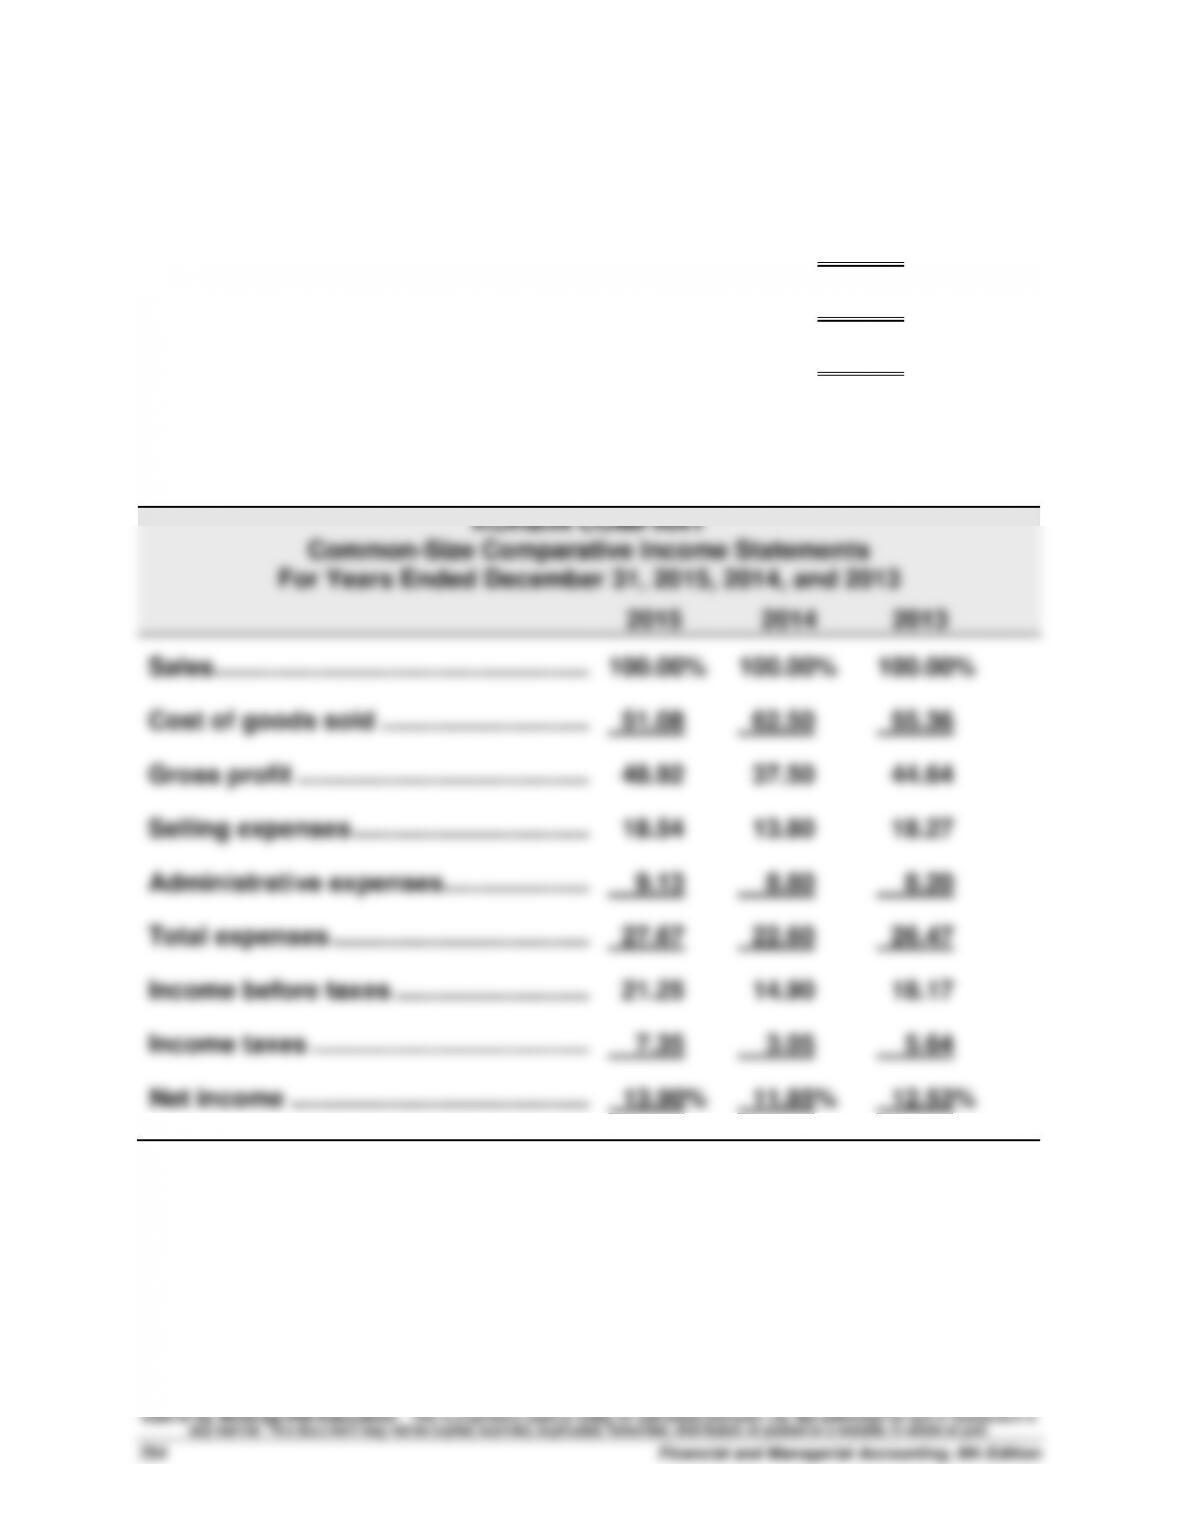
KORBIN COMPANY
Common-Size Comparative Income Statements
For Years Ended December 31, 2015, 2014, and 2013
2015
2014
2013
Sales ............................................................
100.00%
100.00%
100.00%
Cost of goods sold ................................
51.08
62.50
55.36
Gross profit ................................................
48.92
37.50
44.64
Selling expenses ........................................
18.54
13.80
18.27
Administrative expenses...........................
9.13
8.80
8.20
Total expenses ...........................................
27.67
22.60
26.47
Income before taxes ................................
21.25
14.90
18.17
Income taxes ..............................................
7.35
3.05
5.64
Net income .................................................
13.90%
11.85%
12.53%


