Problem 5-3A (Continued)
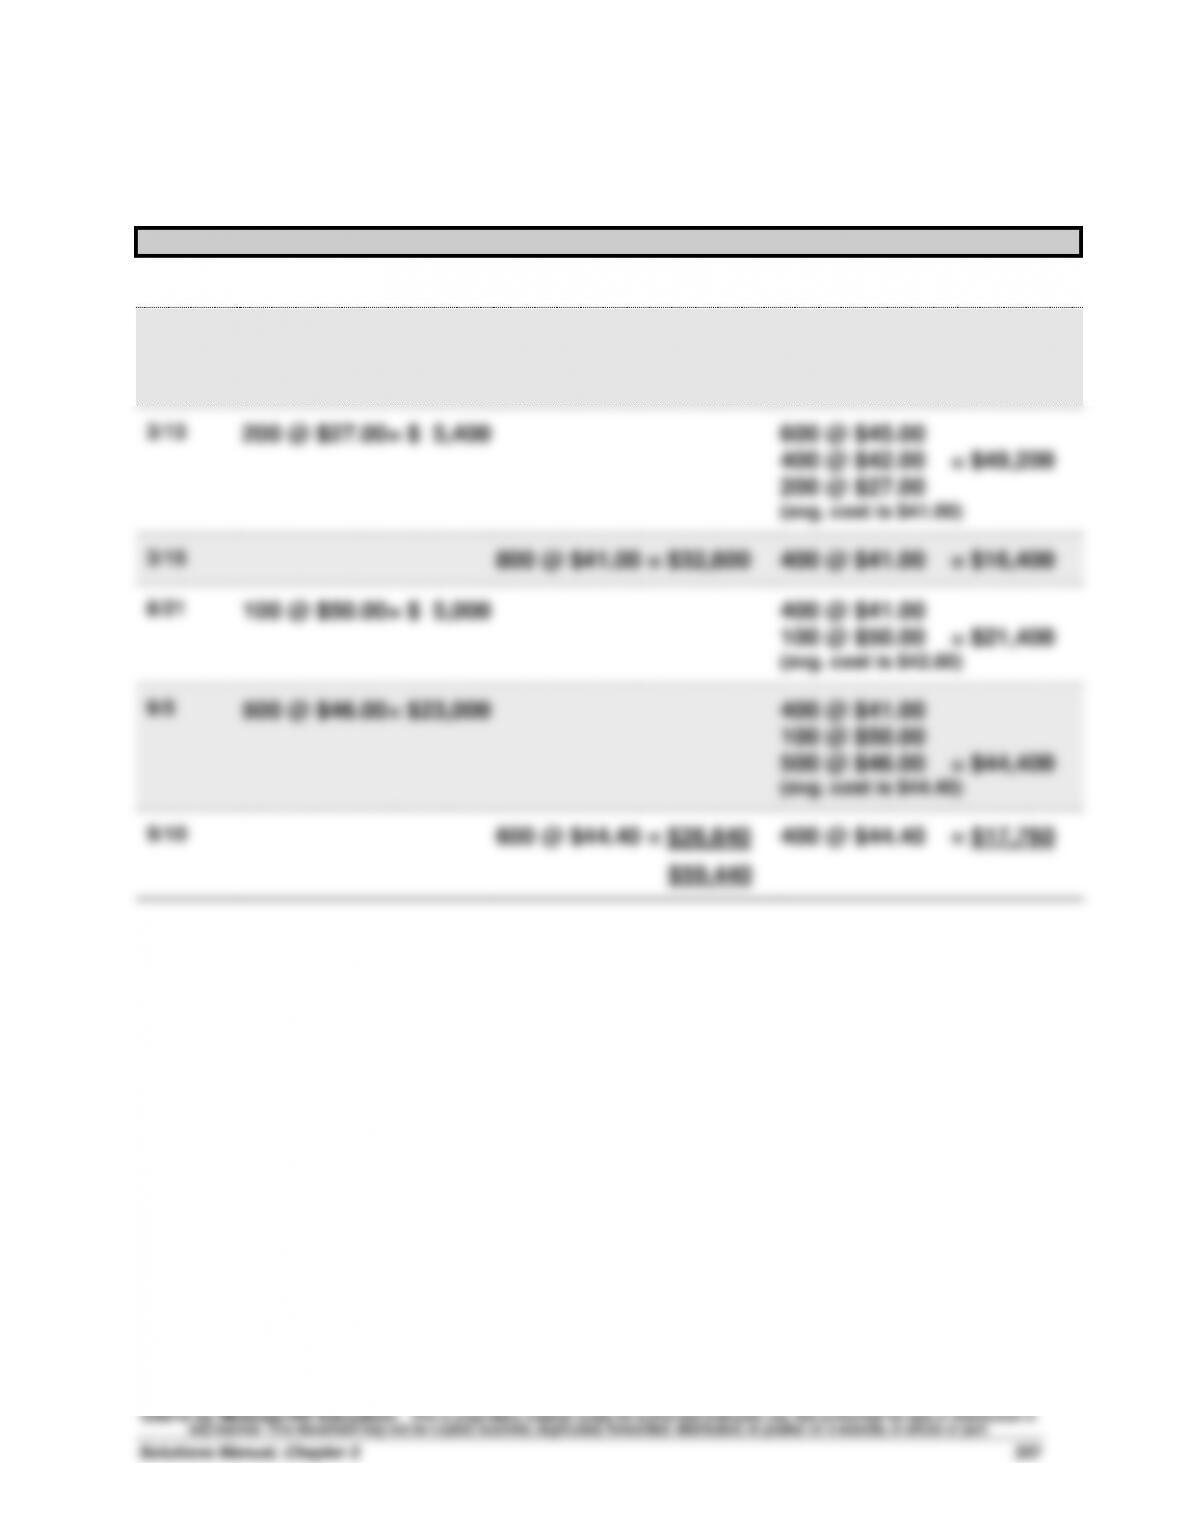
3c. Weighted Average
Date
Goods Purchased
Cost of Goods Sold
Inventory Balance
1/1
600 @ $45.00 = $27,000
2/10
400 @ $42.00= $16,800
600 @ $45.00
400 @ $42.00 = $43,800
(avg. cost is $43.80)
3/13
200 @ $27.00= $ 5,400
600 @ $45.00
400 @ $42.00 = $49,200
200 @ $27.00
(avg. cost is $41.00)
3/15
800 @ $41.00 = $32,800
400 @ $41.00 = $16,400
8/21
100 @ $50.00= $ 5,000
400 @ $41.00
100 @ $50.00 = $21,400
(avg. cost is $42.80)
9/5
500 @ $46.00= $23,000
400 @ $41.00
100 @ $50.00
500 @ $46.00 = $44,400
(avg. cost is $44.40)
9/10
600 @ $44.40 = $26,640
400 @ $44.40 = $17,760
$59,440
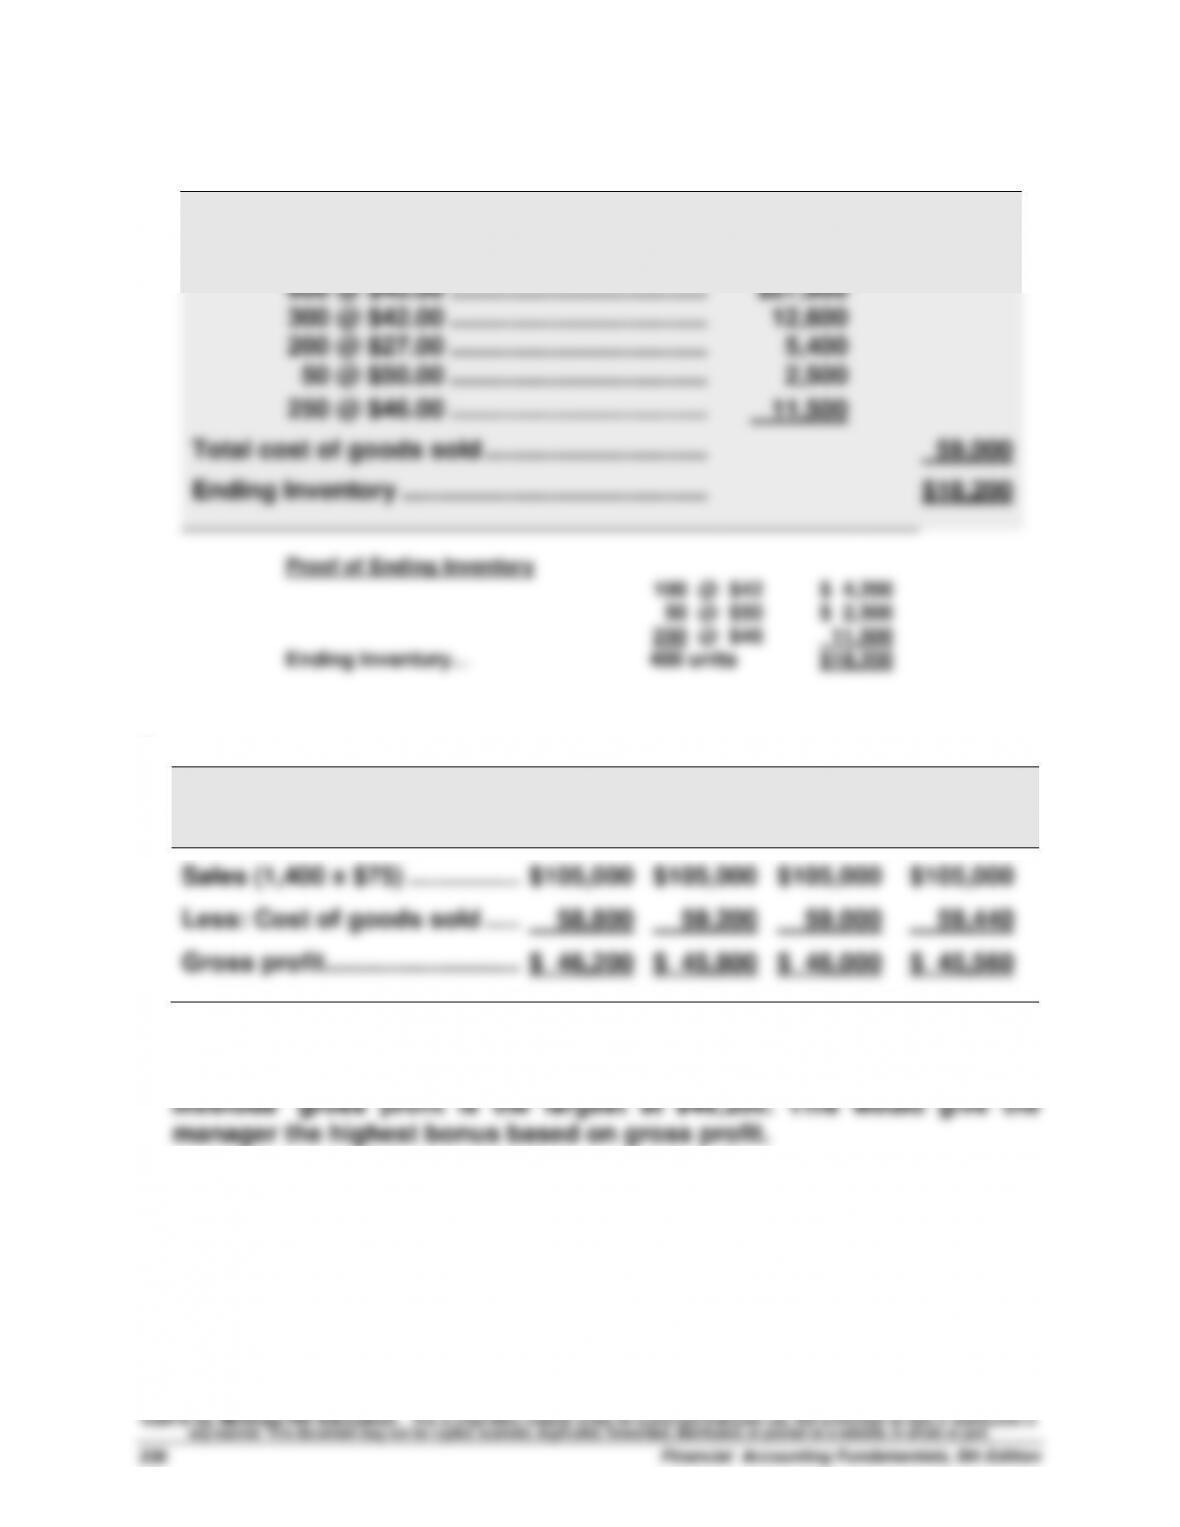
Problem 5-3A (Continued)
3d. Specific Identification
Cost of goods available for sale ……………….
$77,200
Less: Cost of Goods Sold
600 @ $45.00 ……………………………….
$27,000
300 @ $42.00 ……………………………….
12,600
200 @ $27.00 ……………………………….
5,400
50 @ $50.00 ……………………………….
2,500
250 @ $46.00 ……………………………….
11,500
Total cost of goods sold …………………………..
59,000
Ending Inventory ……………………………………..
$18,200
Proof of Ending Inventory
100 @ $42
$ 4,200
50 @ $50
$ 2,500
250 @ $46
11,500
Ending Inventory….
400 units
$18,200
4.
FIFO
LIFO
Specific
Identifi-
cation
Weighted
Average
Sales (1,400 x $75) ……………..
$105,000
$105,000
$105,000
$105,000
Less: Cost of goods sold …...
58,800
59,200
59,000
59,440
Gross profit ………………………..
$ 46,200
$ 45,800
$ 46,000
$ 45,560
5. Montoure’s manager would likely prefer the FIFO method since this
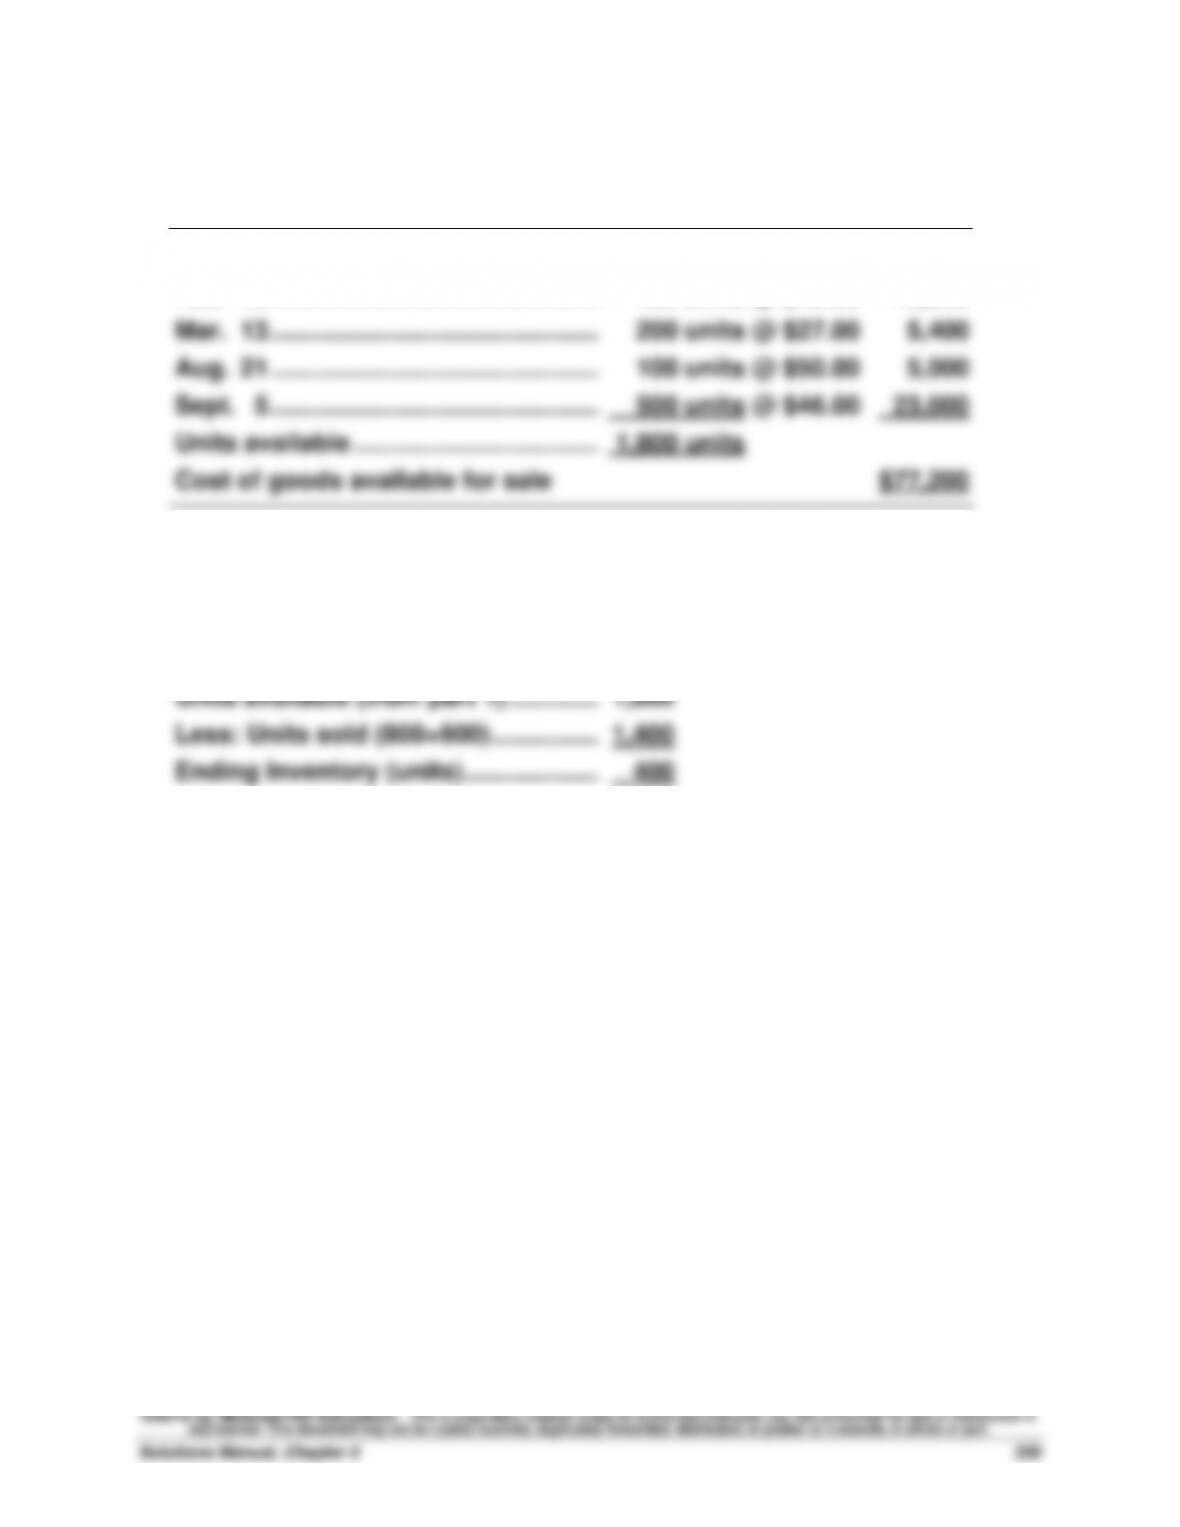
Problem 5-4A (40 minutes)
1. Calculate cost of goods available for sale and units available for sale
Beginning inventory ……………………...
600 units @ $45.00
$27,000
Feb. 10 ………………………………………….
400 units @ $42.00
16,800
Mar. 13 ………………………………………….
200 units @ $27.00
5,400
Aug. 21 ………………………………………….
100 units @ $50.00
5,000
Sept. 5 ………………………………………….
500 units @ $46.00
23,000
Units available ……………………………….
1,800 units
Cost of goods available for sale
$77,200
2. Units in ending inventory
Units available (from part 1) …………..…………..
1,800
Less: Units sold (800+600) …………….…………..
1,400
Ending Inventory (units) ………………..…………
400
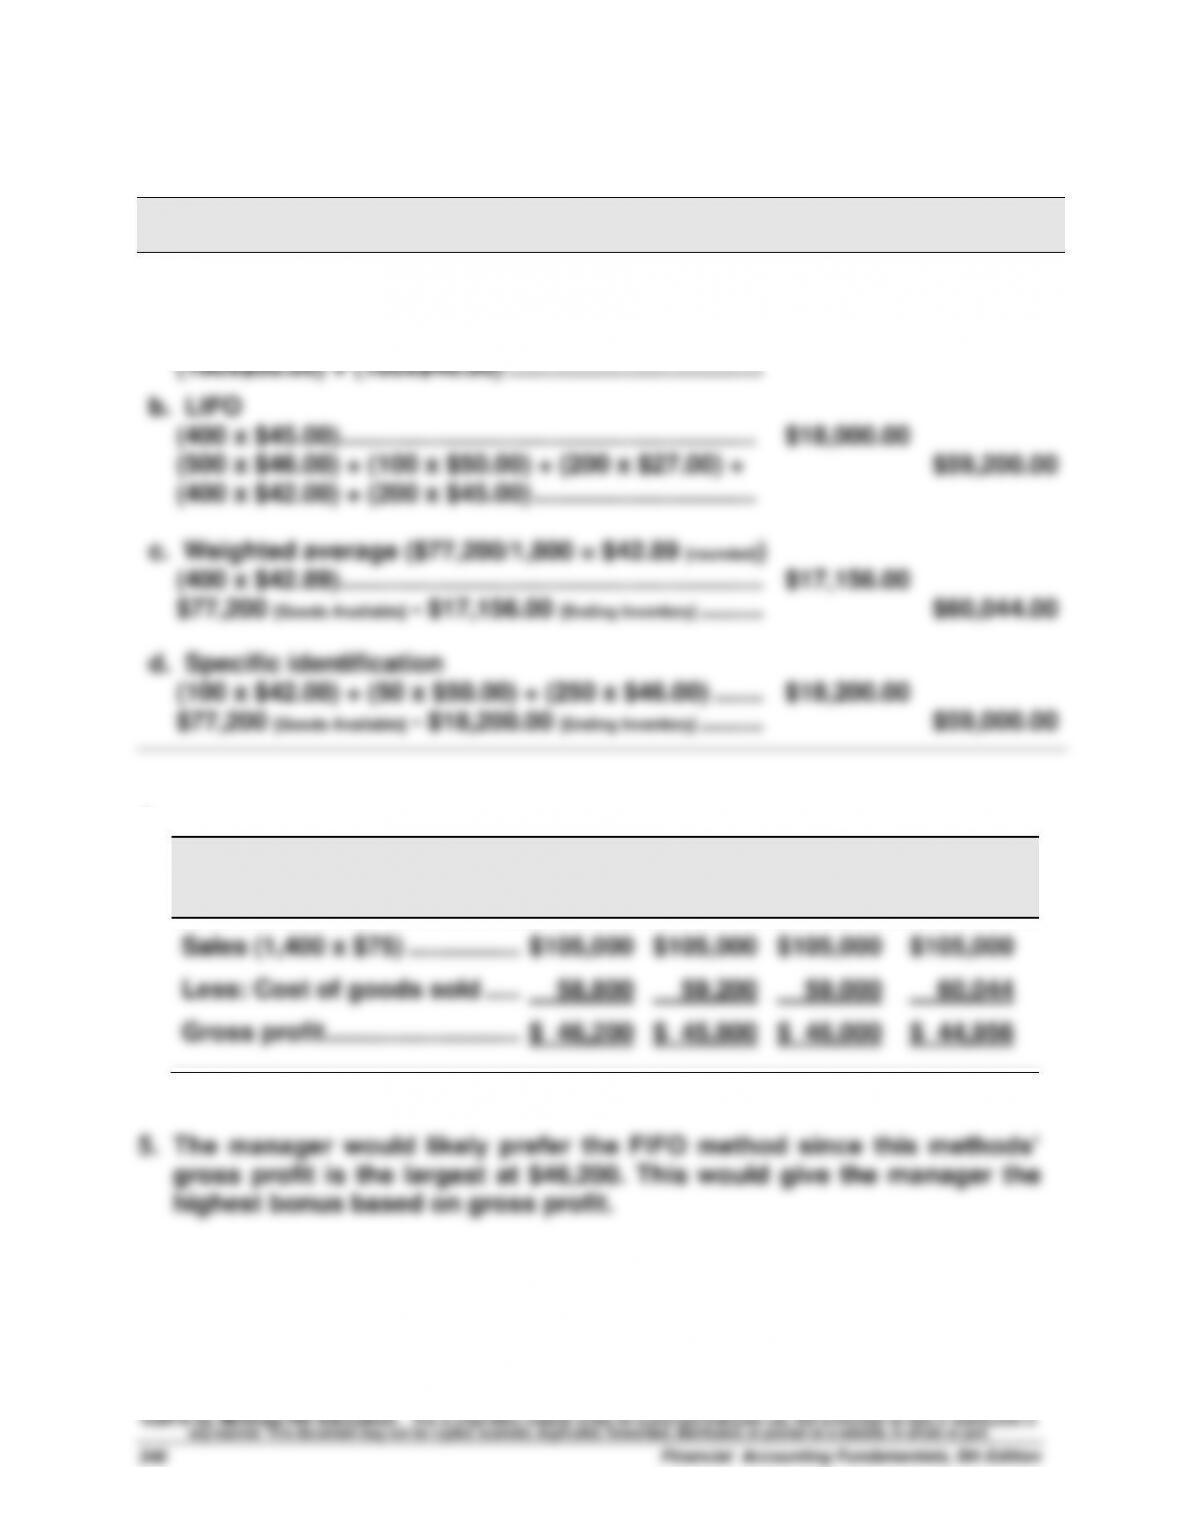
Problem 5-4A (Concluded)
3.
Periodic Inventory
Ending
Inventory
Cost of
Goods Sold
a. FIFO
(400 x $46.00)…………………………………………………….
$18,400.00
(600x$45.00) + (400x$42.00) + (200x$27.00) +
(100x$50.00) + (100x$46.00) …………………………..…..
$58,800.00
b. LIFO
(400 x $45.00)……………………………………………………
$18,000.00
(500 x $46.00) + (100 x $50.00) + (200 x $27.00) +
(400 x $42.00) + (200 x $45.00) …………………………..
$59,200.00
c. Weighted average ($77,200/1,800 = $42.89 [rounded])
(400 x $42.89)…………………………………………………….
$17,156.00
$77,200 [Goods Available] – $17,156.00 [Ending Inventory] ………
$60,044.00
d. Specific identification
(100 x $42.00) + (50 x $50.00) + (250 x $46.00) …….
$18,200.00
$77,200 [Goods Available] – $18,200.00 [Ending Inventory] ………
$59,000.00
4.
FIFO
LIFO
Specific
Identifi-
cation
Weighted
Average
Sales (1,400 x $75) ……………..
$105,000
$105,000
$105,000
$105,000
Less: Cost of goods sold …...
58,800
59,200
59,000
60,044
Gross profit ………………………..
$ 46,200
$ 45,800
$ 46,000
$ 44,956
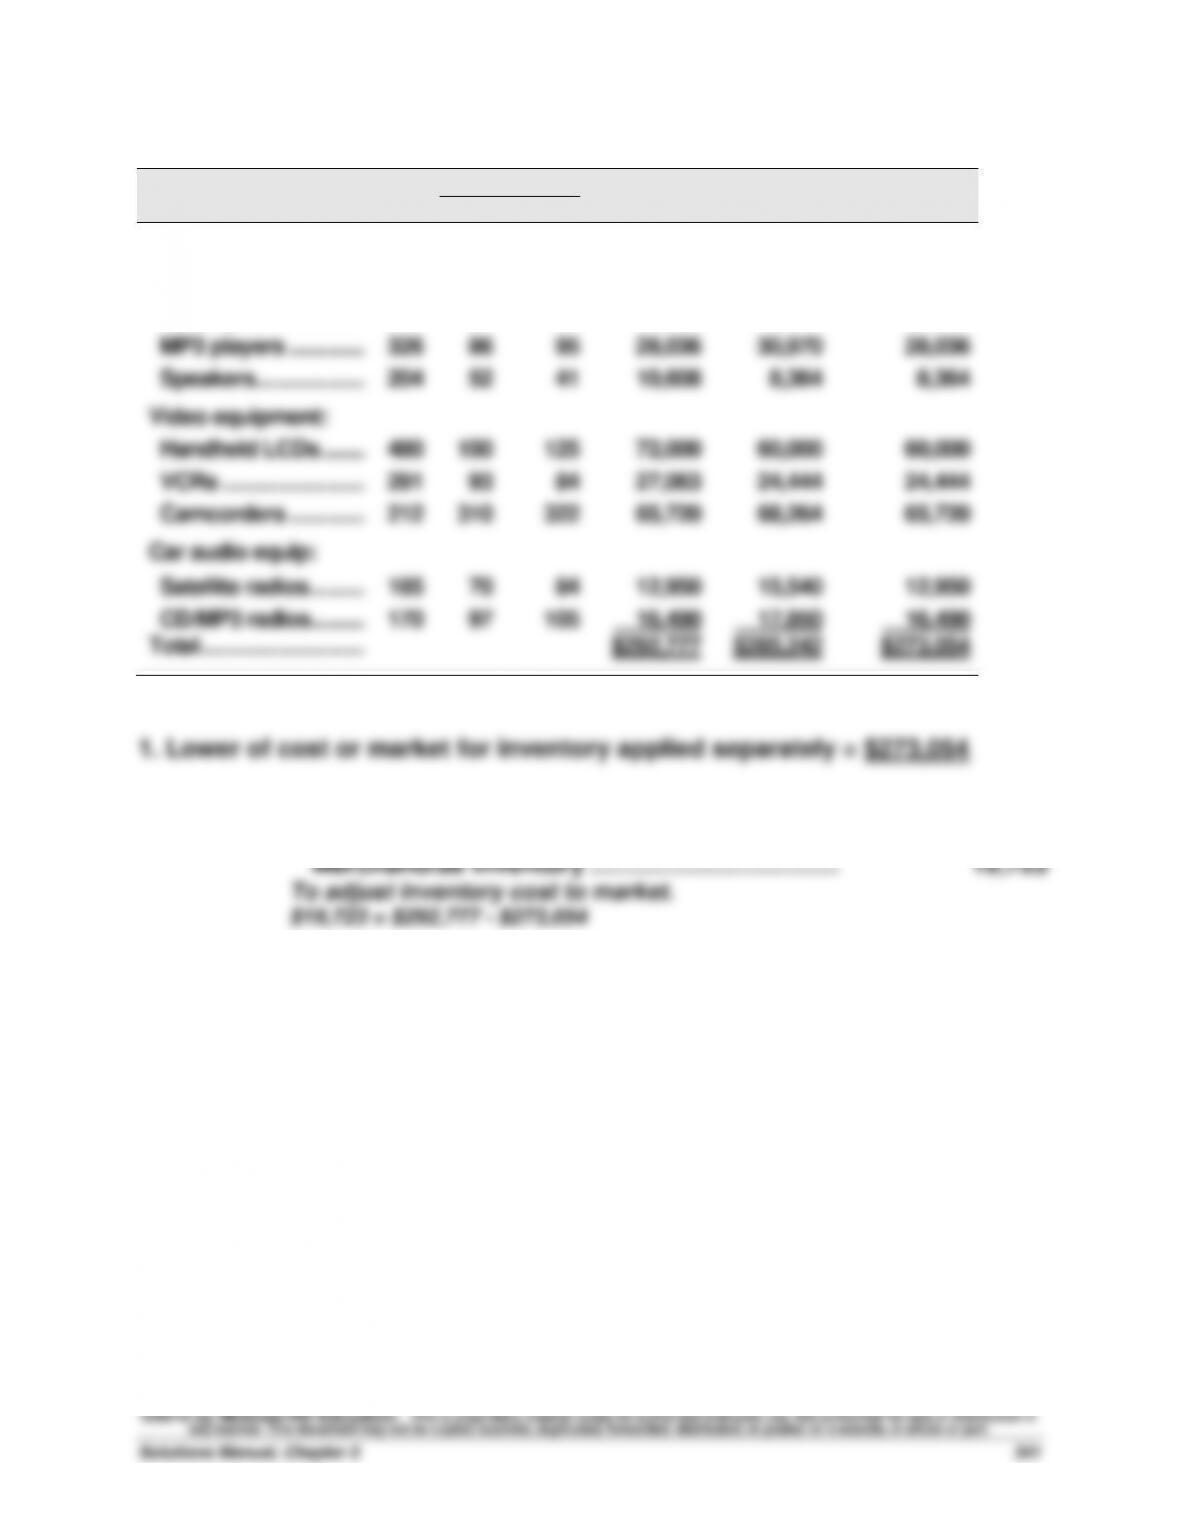
Problem 5-5A (50 minutes)
Per Unit
Total
Total
LCM Applied
to Items
Inventory Items
Units
Cost
Market
Cost
Market
Audio equipment:
Receivers ………………..
345
$ 90
$ 98
$ 31,050
$ 33,810
$ 31,050
CD players ……………...
260
111
100
28,860
26,000
26,000
MP3 players …………...
326
86
95
28,036
30,970
28,036
Speakers………………...
204
52
41
10,608
8,364
8,364
Video equipment:
Handheld LCDs ……...
480
150
125
72,000
60,000
60,000
VCRs ……………………...
291
93
84
27,063
24,444
24,444
Camcorders …………...
212
310
322
65,720
68,264
65,720
Car audio equip:
Satellite radios ………..
185
70
84
12,950
15,540
12,950
CD/MP3 radios………..
170
97
105
16,490
17,850
16,490
Total ………………………….
$292,777
$285,242
$273,054
2.
Dec 31
Cost of Goods Sold ………………………………………….….
19,723
Merchandise Inventory ……………………………….….
19,723
To adjust inventory cost to market.
$19,723 = $292,777 – $273,054
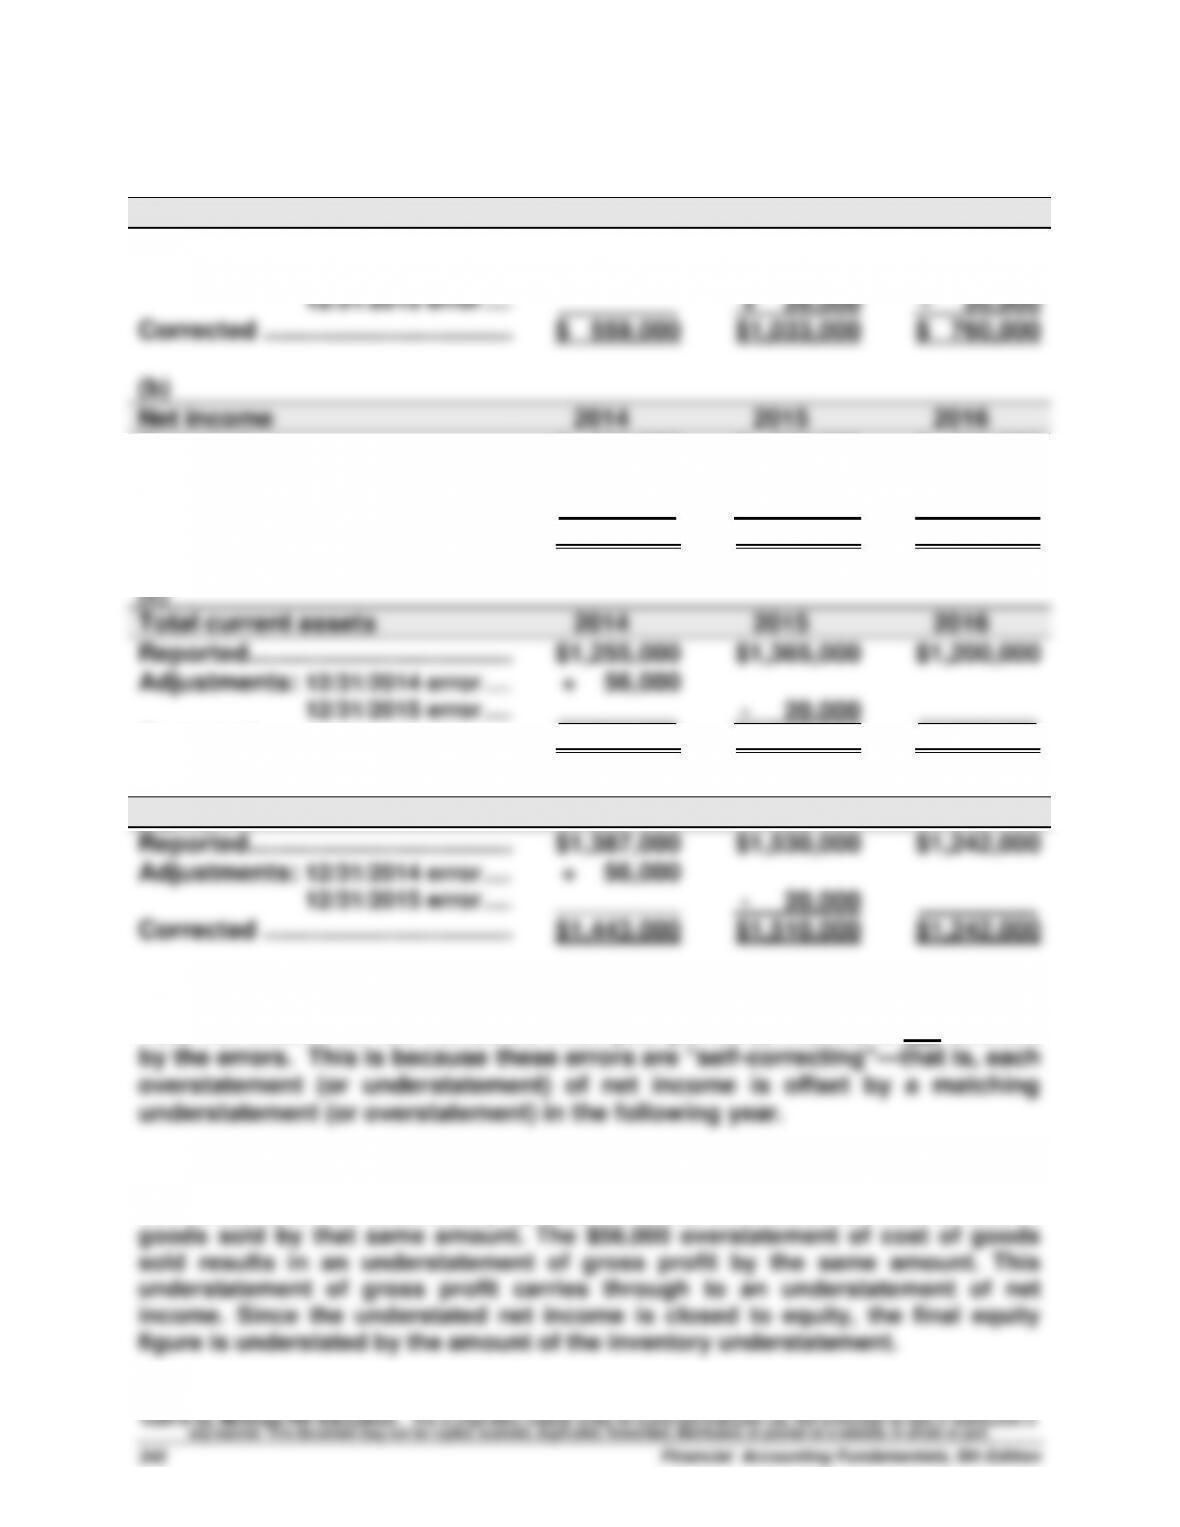
Problem 5-6A (35 minutes)
Part 1
(a)
Cost of goods sold
2014
2015
2016
Reported ………………………………...
$ 615,000
$ 957,000
$ 780,000
Adjustments: 12/31/2014 error ……
– 56,000
+ 56,000
12/31/2015 error ……
.
+ 20,000
– 20,000
Corrected ……………………………….
$ 559,000
$1,033,000
$ 760,000
(b)
Net income
2014
2015
2016
Reported ………………………………...
$ 230,000
$ 285,000
$ 241,000
Adjustments: 12/31/2014 error ……
+ 56,000
– 56,000
12/31/2015 error ……
.
– 20,000
+ 20,000
Corrected ……………………………….
$ 286,000
$ 209,000
$ 261,000
(c)
Total current assets
2014
2015
2016
Reported ………………………………...
$1,255,000
$1,365,000
$1,200,000
Adjustments: 12/31/2014 error ……
+ 56,000
12/31/2015 error ……
.
– 20,000
.
Corrected ……………………………….
$1,311,000
$1,345,000
$1,200,000
(d)
Equity
2014
2015
2016
Reported ………………………………...
$1,387,000
$1,530,000
$1,242,000
Adjustments: 12/31/2014 error ……
+ 56,000
12/31/2015 error ……
_________
– 20,000
.
Corrected ……………………………….
$1,443,000
$1,510,000
$1,242,000
Part 2
Total net income for the combined three-year period ($756,000) is not affected
Part 3
The understatement of inventory by $56,000 results in an overstatement of cost of
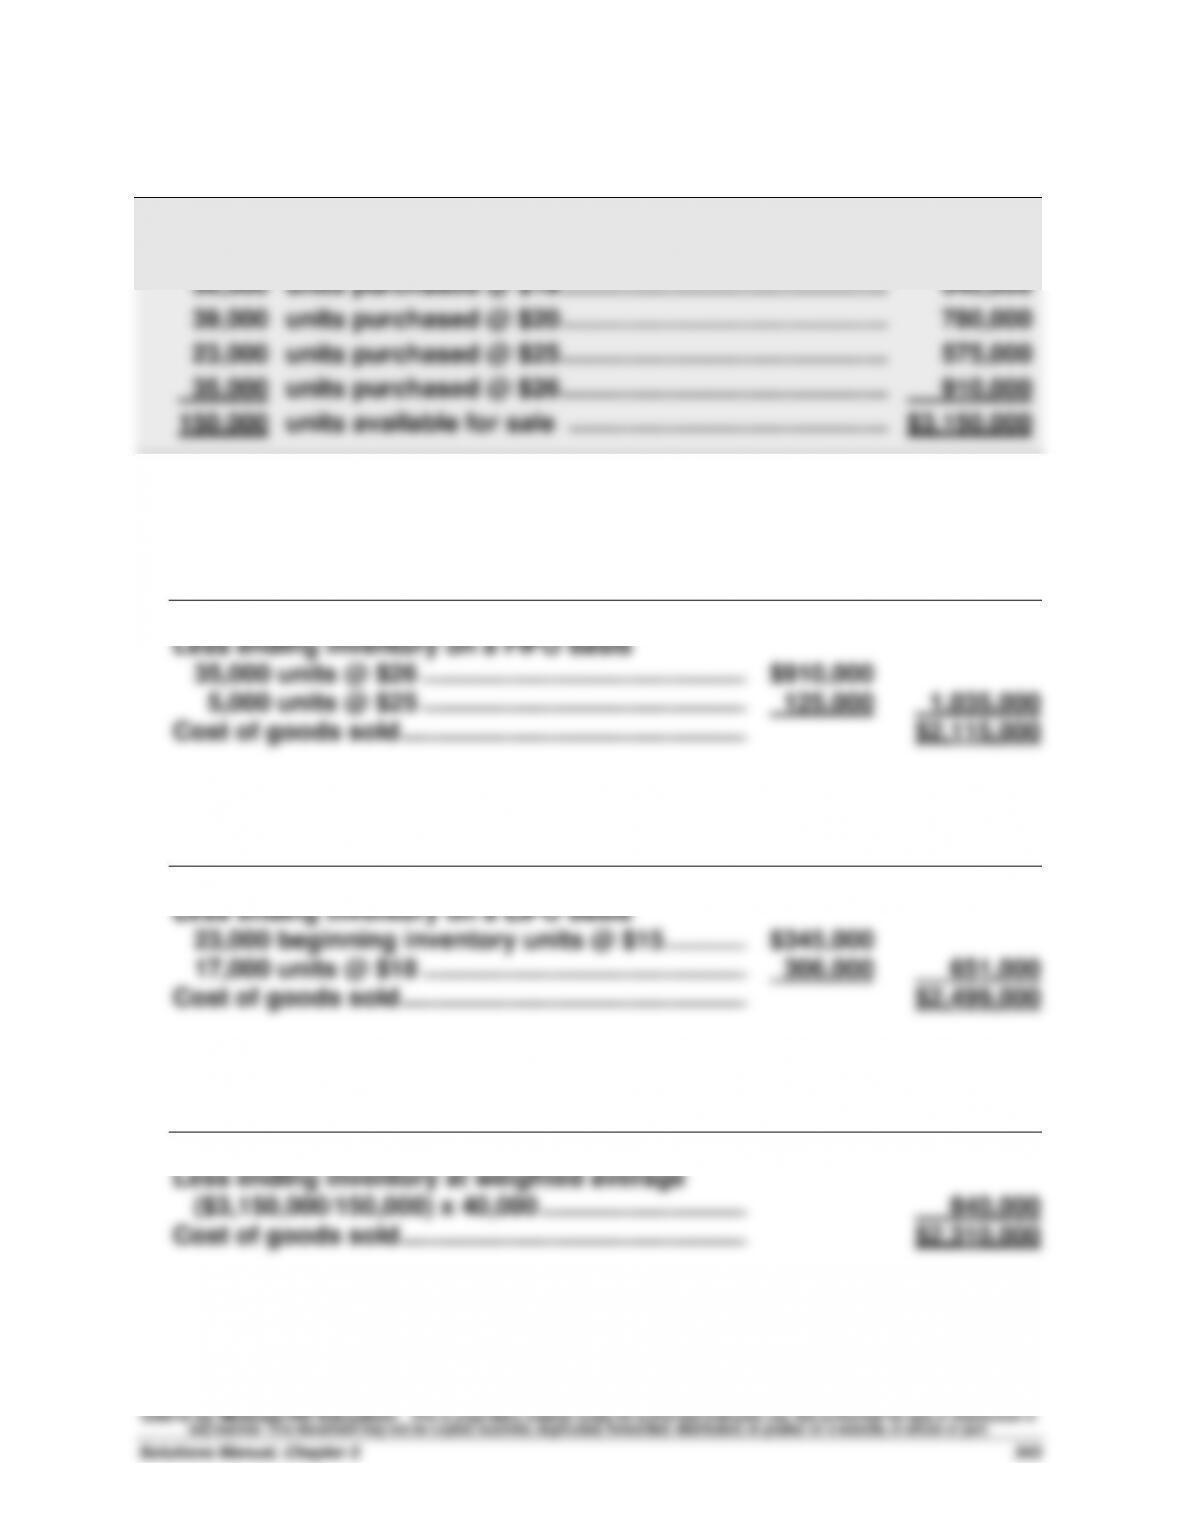
Problem 5-7AA (25 minutes)
Part 1
Number and total cost of units available for sale
23,000 units in beginning inventory @ $15 …………………….. $ 345,000
Part 2
a. FIFO periodic
Total cost of 150,000 units available for sale …….…………
$3,150,000
Less ending inventory on a FIFO basis
35,000 units @ $26 ………………………………………..…………
$910,000
5,000 units @ $25 ………………………………………..…………
125,000
1,035,000
Cost of goods sold …………………………………………..…………
$2,115,000
b. LIFO periodic
Total cost of 150,000 units available for sale …….…………
$3,150,000
Less ending inventory on a LIFO basis
23,000 beginning inventory units @ $15 ……………………
$345,000
17,000 units @ $18 ………………………………………..…………
306,000
651,000
Cost of goods sold …………………………………………..…………
$2,499,000
c. Weighted average periodic
Total cost of 150,000 units available for sale …….…………
$3,150,000
Less ending inventory at weighted average
($3,150,000/150,000) x 40,000 …………………………..
840,000
Cost of goods sold …………………………………………..…………
$2,310,000
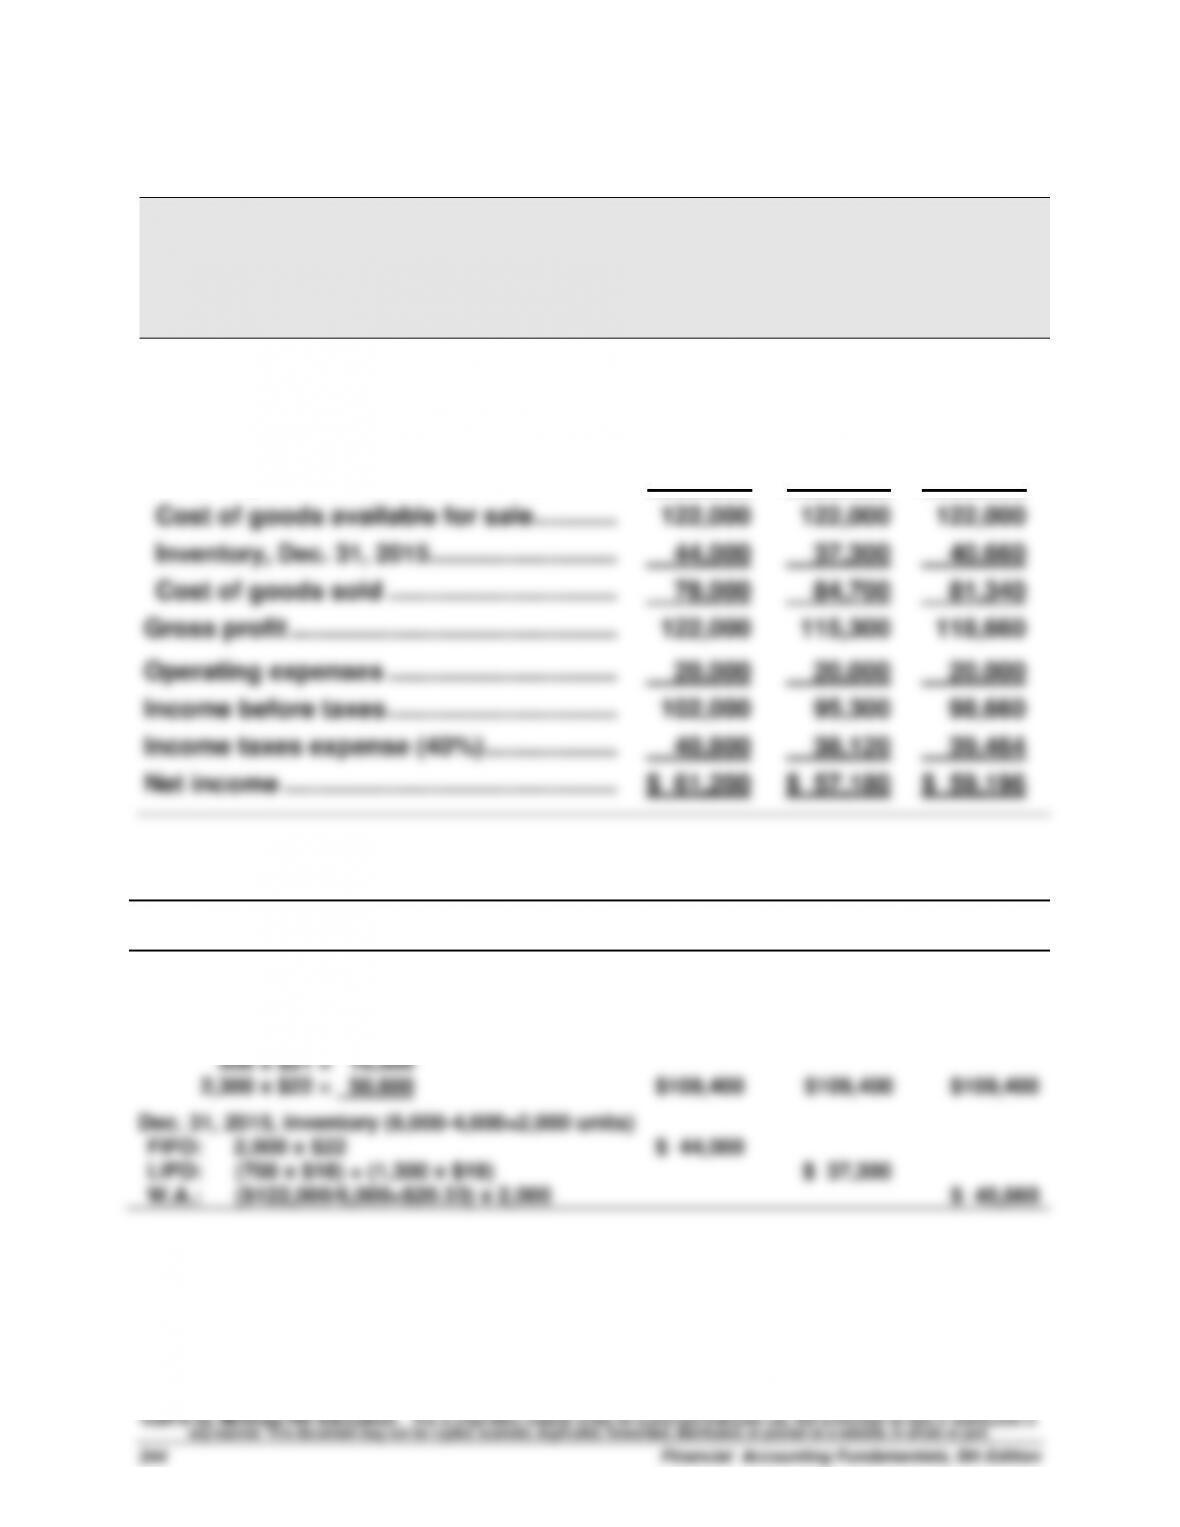
Problem 5-8AA (50 minutes)
Part 1
QP CORP.
Income Statements Comparing FIFO, LIFO, and Weighted Average
For Year Ended December 31, 2015
FIFO
LIFO
Weighted
Average
Sales ………………………………………………….….
$200,000
$200,000
$200,000
Cost of goods sold
Inventory, Dec. 31, 2014 …………………….….
12,600
12,600
12,600
Cost of purchases……………………………..….
109,400
109,400
109,400
Cost of goods available for sale …………….
122,000
122,000
122,000
Inventory, Dec. 31, 2015 ………………………….
44,000
37,300
40,660
Cost of goods sold ……………………………….
78,000
84,700
81,340
Gross profit ………………………………………..….
122,000
115,300
118,660
Operating expenses ……………………………….
20,000
20,000
20,000
Income before taxes ……………………………….
102,000
95,300
98,660
Income taxes expense (40%) ……………….….
40,800
38,120
39,464
Net income …………………………………………….
$ 61,200
$ 57,180
$ 59,196
Supporting calculations
FIFO
LIFO
Weighted
Average
Dec. 31, 2014, inventory (700 x $18). …………….
$ 12,600
$ 12,600
$ 12,600
Purchases
1,700 x $19 = $32,300
800 x $20 = 16,000
500 x $21 = 10,500
2,300 x $22 = 50,600
$109,400
$109,400
$109,400
Dec. 31, 2015, inventory (6,000-4,000=2,000 units)
FIFO:
2,000 x $22
$ 44,000
LIFO:
(700 x $18) + (1,300 x $19)
$ 37,300
W.A.:
($122,000/6,000=$20.33) x 2,000
$ 40,660
Problem 5-8AA (Concluded)
Part 2
If QP Corp. had been experiencing declining costs in the acquisition of
inventory, we would observe the opposite results in our comparisons.
Part 3
Advantages
LIFO: Given the cost trends in the problem, the advantage of using LIFO is
Disadvantages
LIFO: Given the cost trends in the problem, the disadvantage of using LIFO
Problem 5-9AB (25 minutes)
Part 1
ALASKA COMPANY
Estimated Inventory
December 31
At Cost
At Retail
Goods available for sale
Beginning inventory……………………………………..
$ 469,010
$ 928,950
Cost of goods purchased …………………………..…
3,376,050
6,381,050
Goods available for sale ……………………………….
$3,845,060
$7,310,000
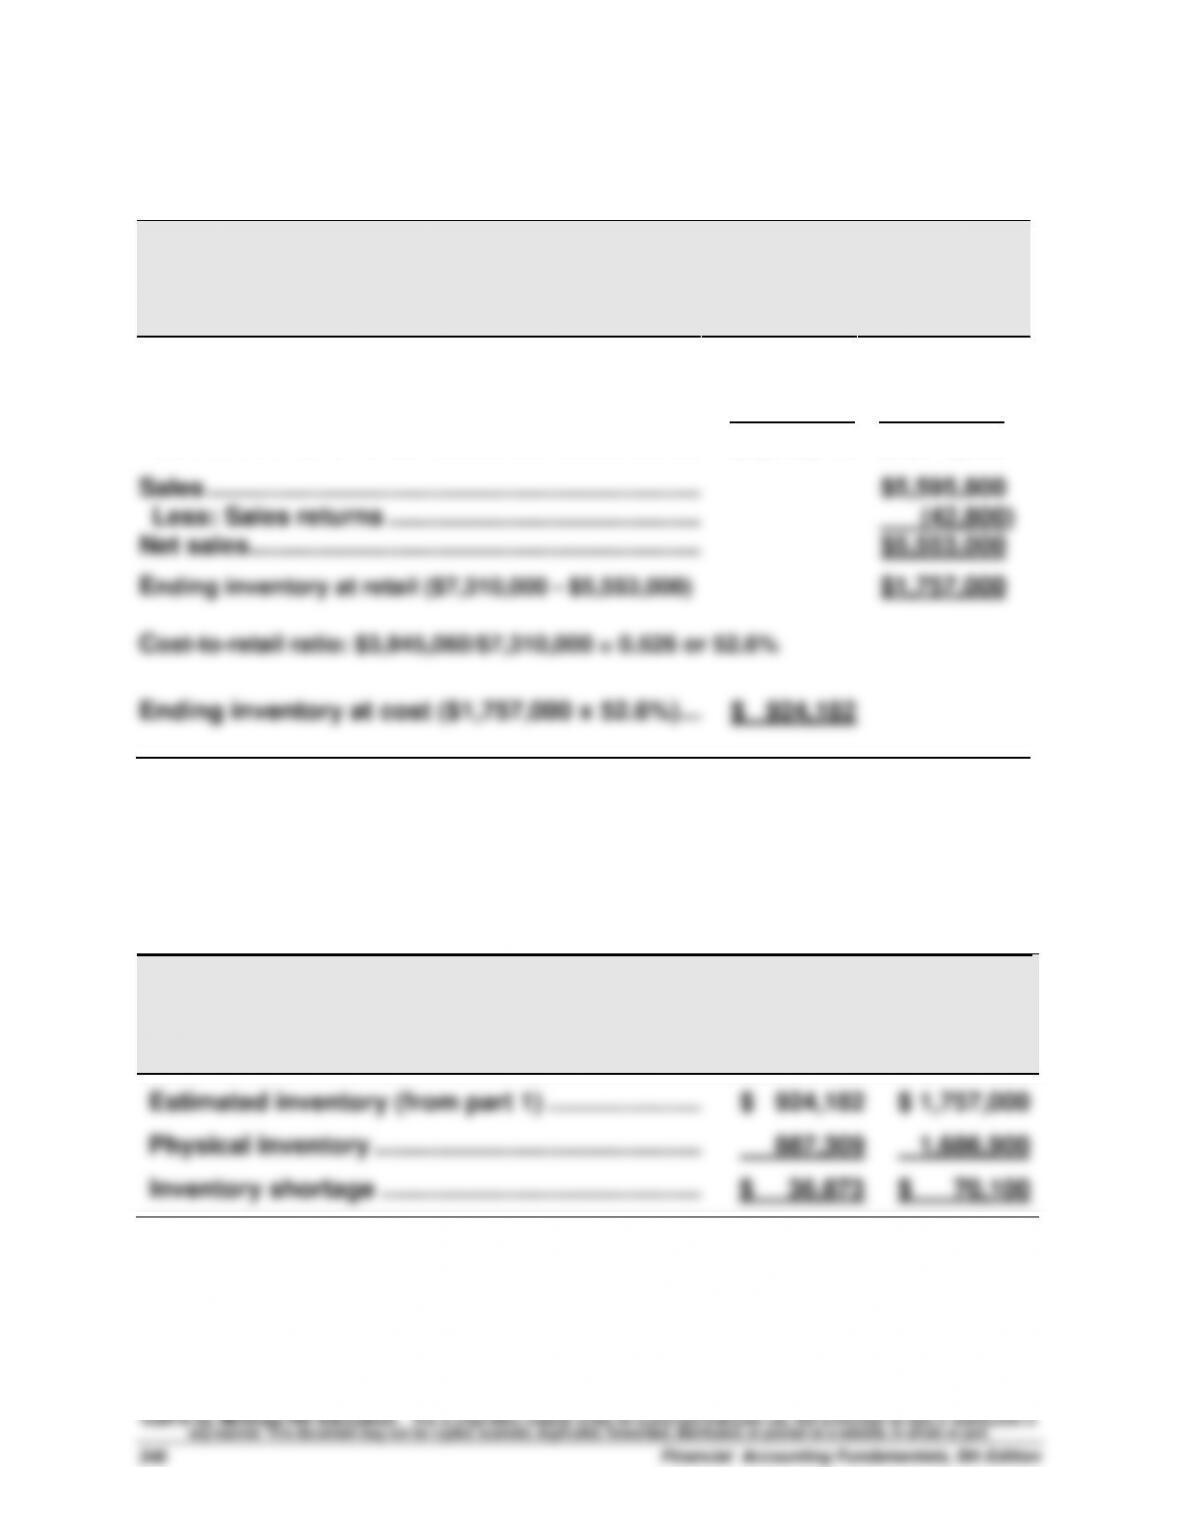
Sales ……………………………………………………………..
$5,595,800
Less: Sales returns ………………………………………
(42,800)
Net sales ………………………………………………………..
$5,553,000
Ending inventory at retail ($7,310,000 – $5,553,000)
$1,757,000
Cost-to-retail ratio: $3,845,060/$7,310,000 = 0.526 or 52.6%
Ending inventory at cost ($1,757,000 x 52.6%) ….……….
$ 924,182
Part 2
Estimated physical inventory at cost: $1,686,900 x 52.6% = $887,309
ALASKA COMPANY
Inventory Shortage
December 31
At Cost
At Retail
Estimated inventory (from part 1) …………………..…..
$ 924,182
$ 1,757,000
Physical inventory ……………………………………………..
887,309
1,686,900
Inventory shortage ………………………………………..…..
$ 36,873
$ 70,100
Problem 5-10AB (25 minutes)
WAYWARD COMPANY
Estimated Inventory at March 31
Goods available for sale
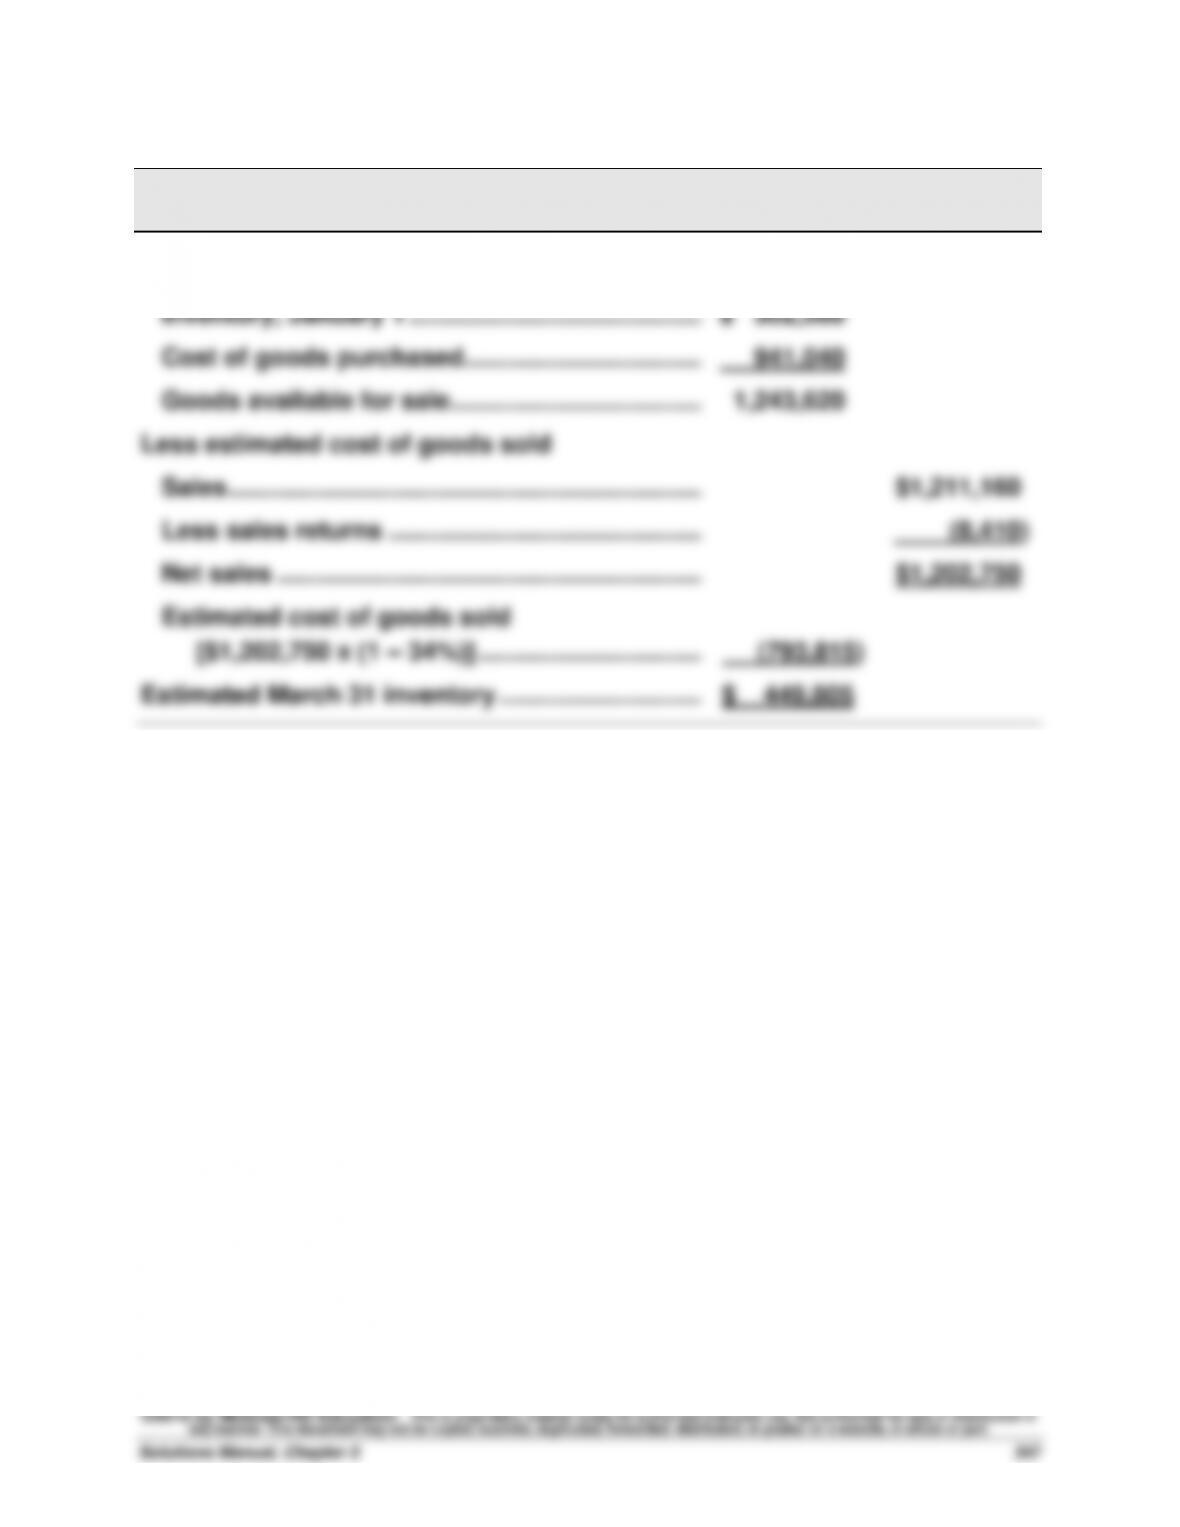
Inventory, January 1 …………………………………….…
$ 302,580
Cost of goods purchased ……………………………..…
941,040
Goods available for sale ……………………………….…
1,243,620
Less estimated cost of goods sold
Sales ………………………………………………………………
$1,211,160
Less sales returns ……………………………………….…
(8,410)
Net sales ……………………………………………………....
$1,202,750
Estimated cost of goods sold
[$1,202,750 x (1 – 34%)] ………………………………
(793,815)
Estimated March 31 inventory …………………………..
$ 449,805
©2016 by McGraw-Hill Education. This is proprietary material solely for authorized instructor use. Not authorized for sale or distribution in
any manner. This document may not be copied, scanned, duplicated, forwarded, distributed, or posted on a website, in whole or part.
Financial Accounting Fundamentals, 5th Edition
348
PROBLEM SET B
Problem 5-1B (40 minutes)
1. Compute cost of goods available for sale and units available for sale
Beginning inventory ……………………...
20 units @ $3,000
$ 60,000
April 6 …………………………………………..
30 units @ $3,500
105,000
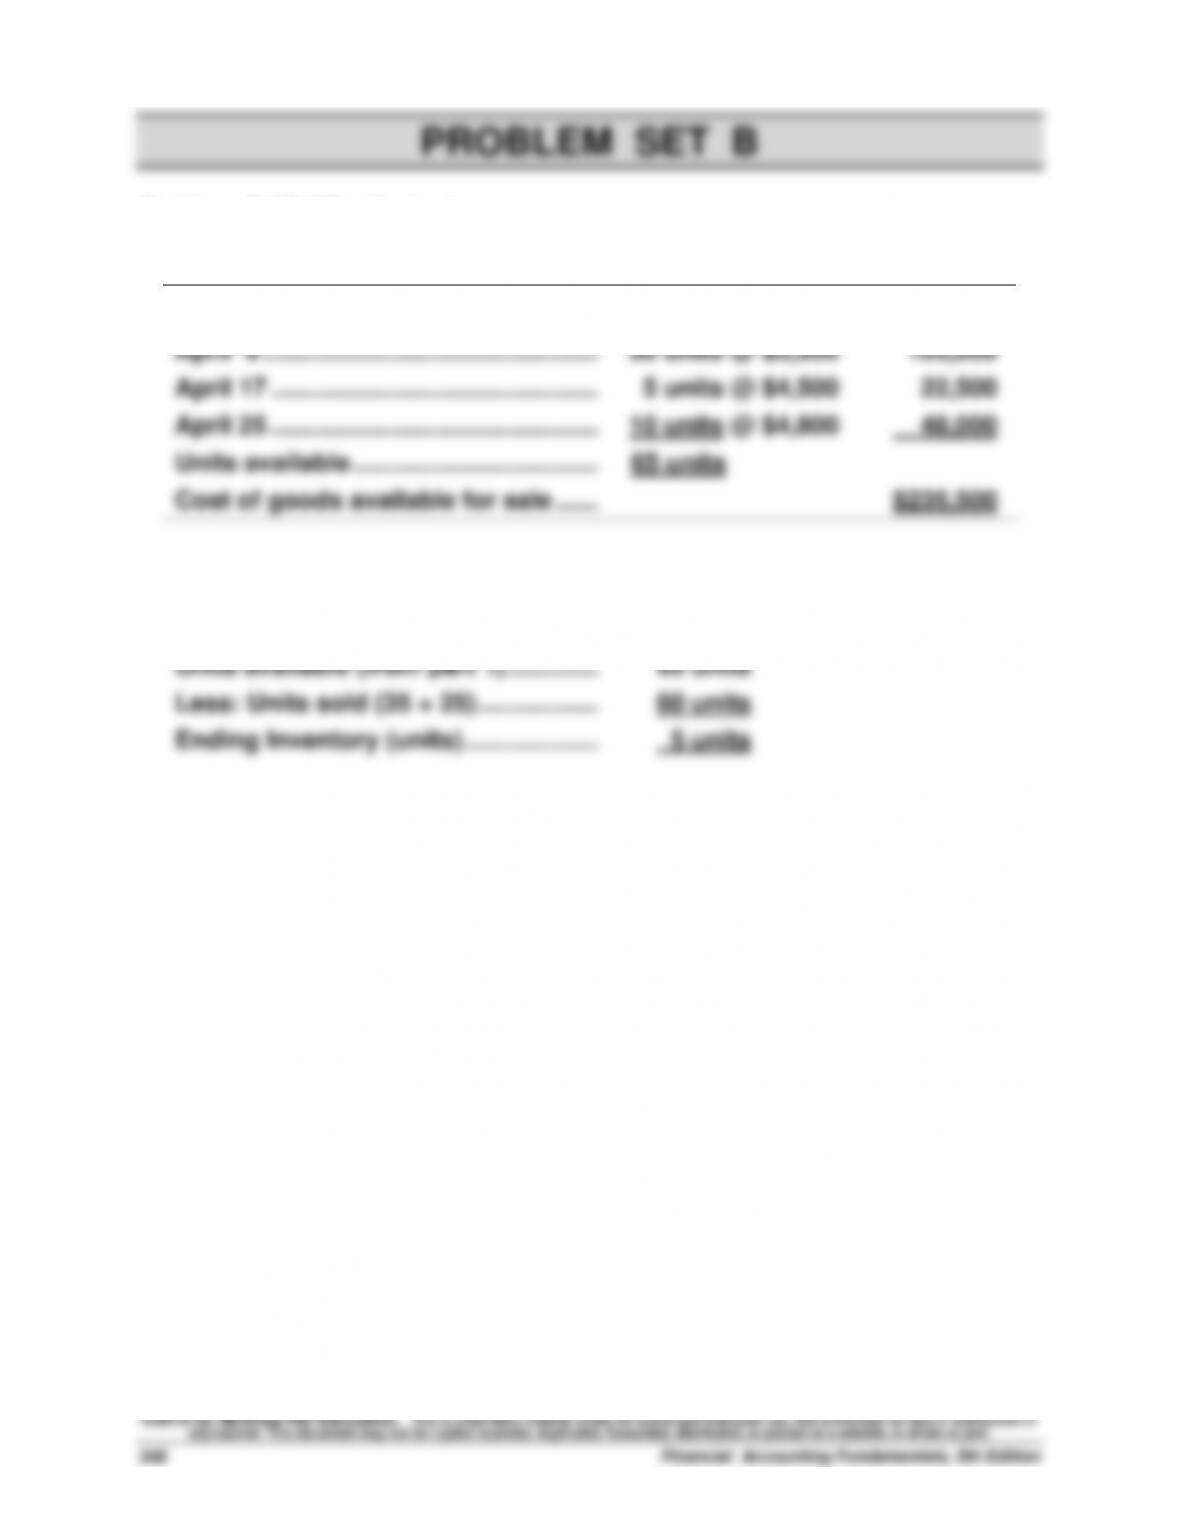
April 17 ………………………………………….
5 units @ $4,500
22,500
April 25 ………………………………………….
10 units @ $4,800
48,000
Units available ……………………………….
65 units
Cost of goods available for sale ……..
$235,500
2. Units in ending inventory
Units available (from part 1) …………..…………..
65 units
Less: Units sold (35 + 25) …………………………..
60 units
Ending Inventory (units) ………………..…………
5 units
Problem 5-1B (Continued)
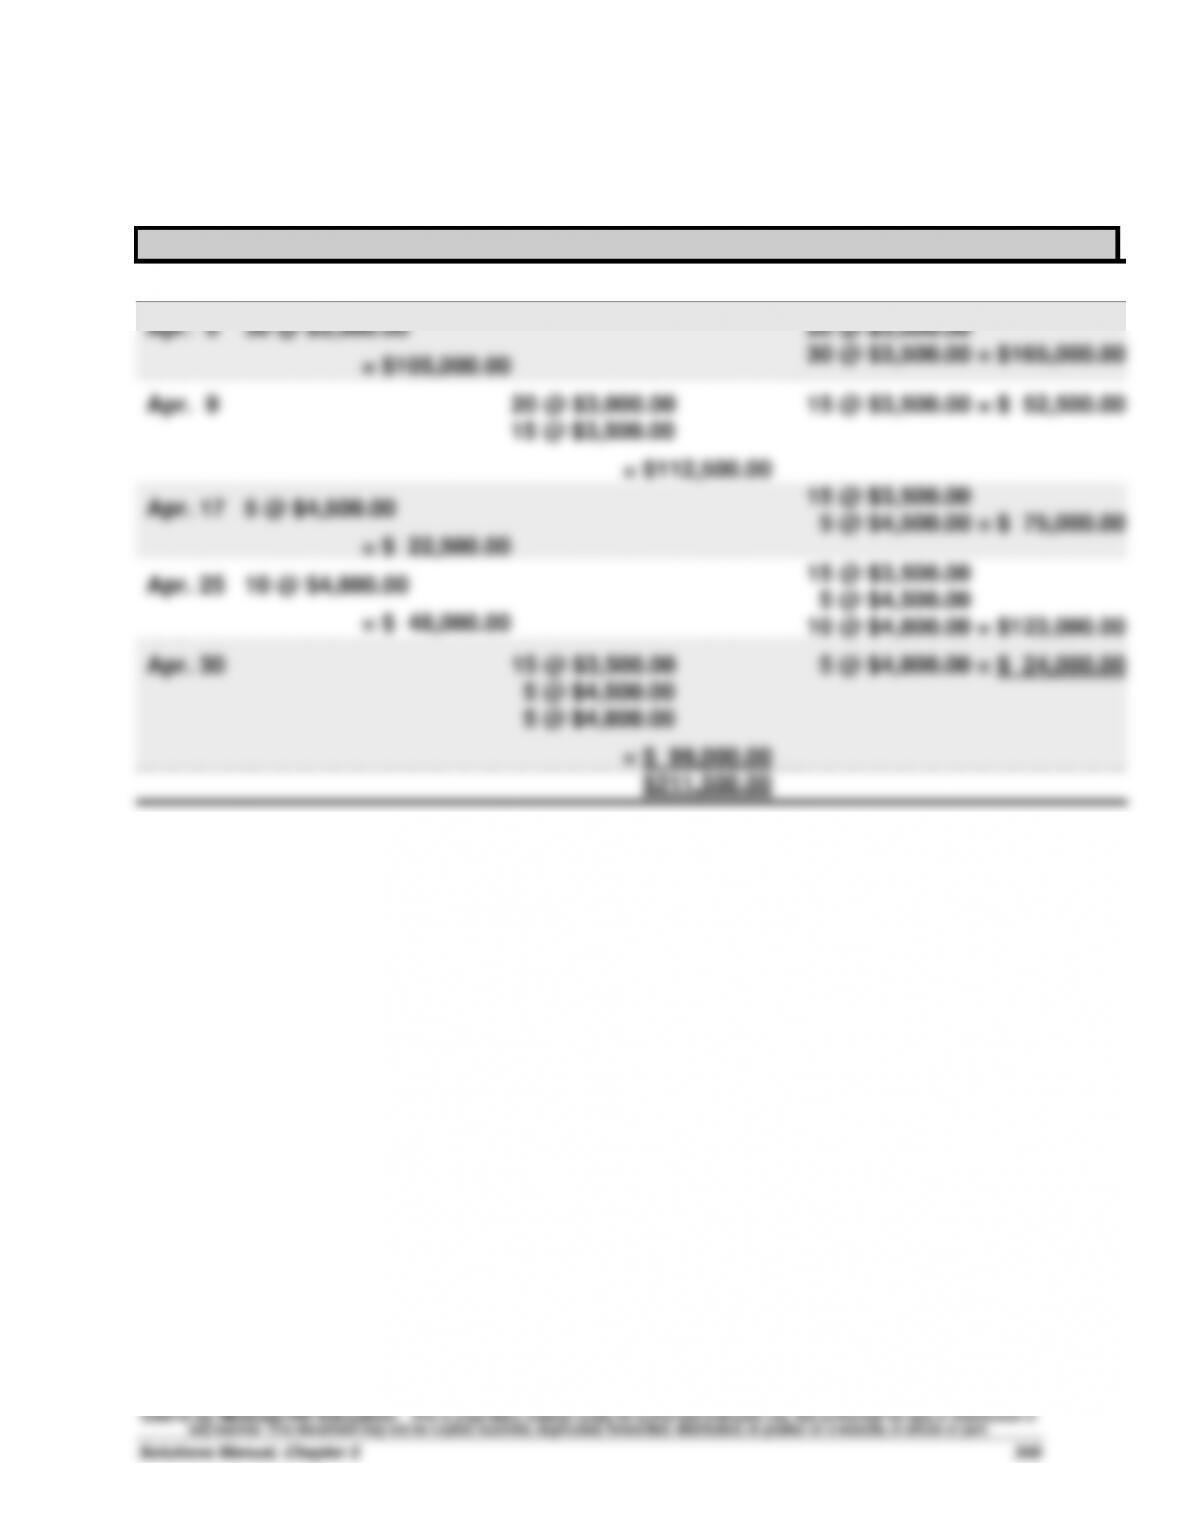
3a. FIFO perpetual
Date
Goods Purchased
Cost of Goods Sold
Inventory Balance
Apr. 1
20 @ $3,000.00 = $ 60,000.00
Apr. 6
30 @ $3,500.00
= $105,000.00
20 @ $3,000.00
30 @ $3,500.00 = $165,000.00
Apr. 9
20 @ $3,000.00
15 @ $3,500.00
= $112,500.00
15 @ $3,500.00 = $ 52,500.00
Apr. 17
5 @ $4,500.00
= $ 22,500.00
15 @ $3,500.00
5 @ $4,500.00 = $ 75,000.00
Apr. 25
10 @ $4,800.00
= $ 48,000.00
15 @ $3,500.00
5 @ $4,500.00
10 @ $4,800.00 = $123,000.00
Apr. 30
15 @ $3,500.00
5 @ $4,500.00
5 @ $4,800.00
= $ 99,000.00
5 @ $4,800.00 = $ 24,000.00
$211,500.00
Problem 5-1B (Continued)
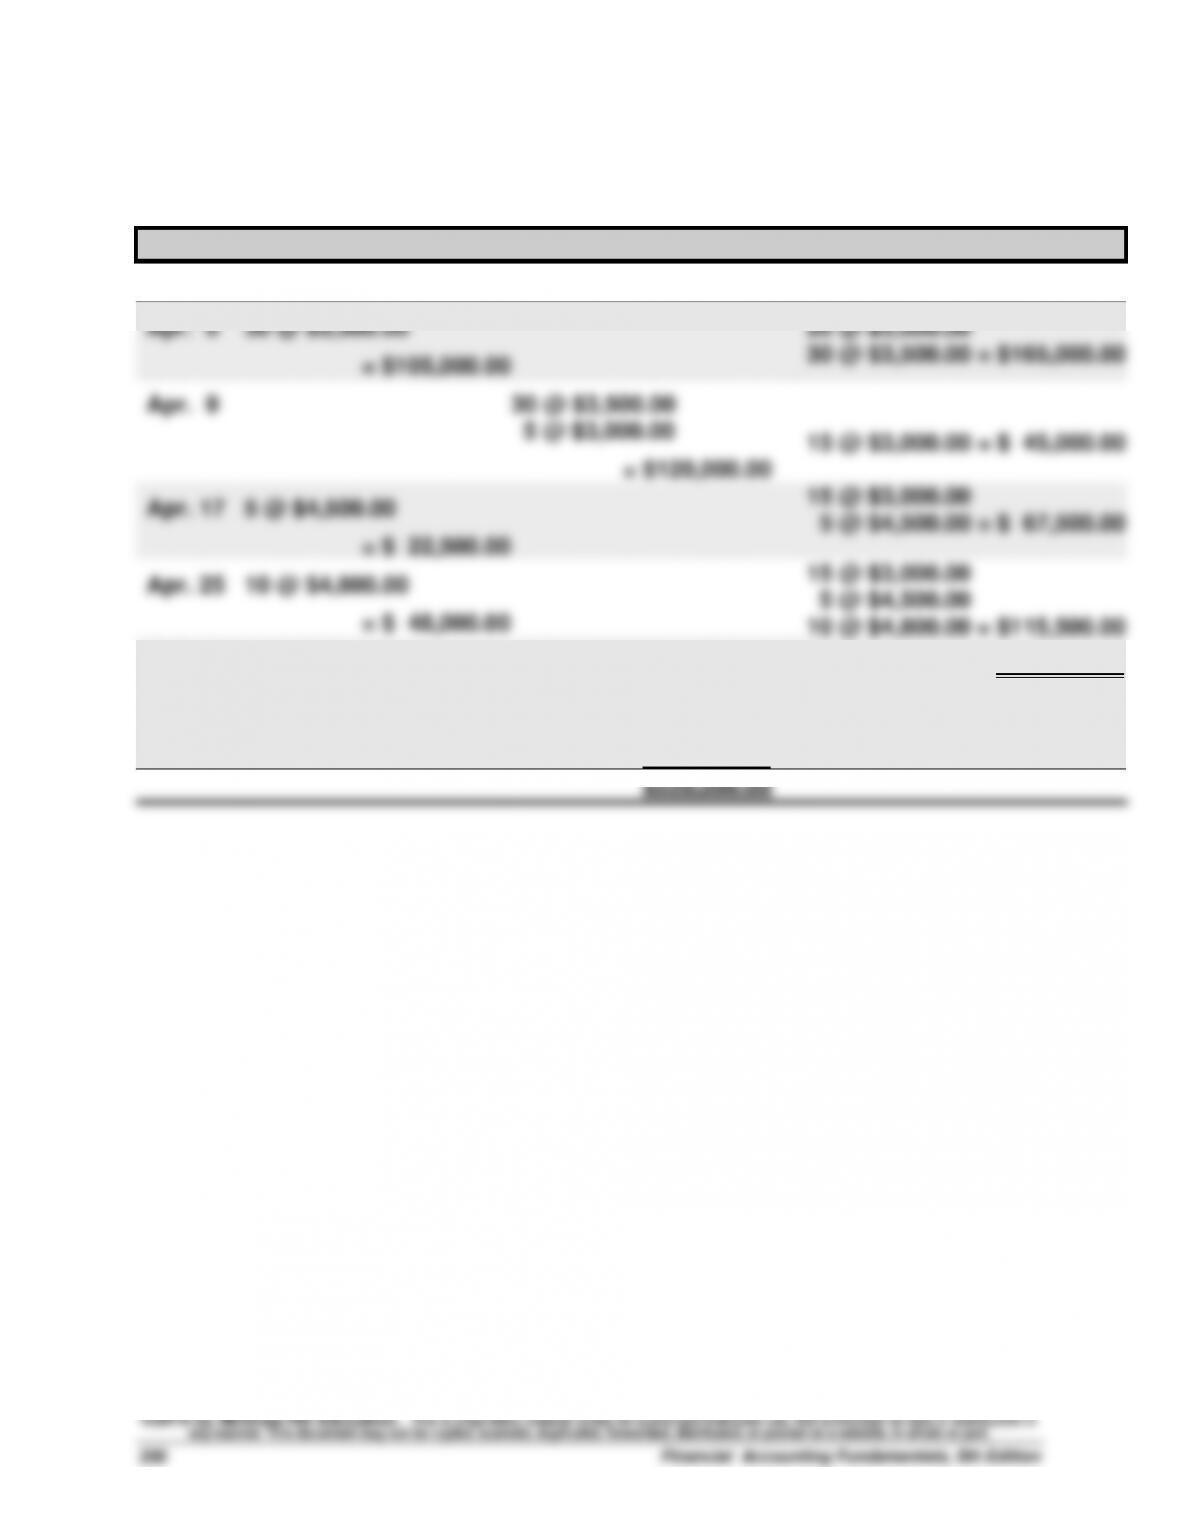
3b. LIFO perpetual
Date
Goods Purchased
Cost of Goods Sold
Inventory Balance
Apr. 1
20 @ $3,000.00 = $ 60,000.00
Apr. 6
30 @ $3,500.00
= $105,000.00
20 @ $3,000.00
30 @ $3,500.00 = $165,000.00
Apr. 9
30 @ $3,500.00
5 @ $3,000.00
= $120,000.00
15 @ $3,000.00 = $ 45,000.00
Apr. 17
5 @ $4,500.00
= $ 22,500.00
15 @ $3,000.00
5 @ $4,500.00 = $ 67,500.00
Apr. 25
10 @ $4,800.00
= $ 48,000.00
15 @ $3,000.00
5 @ $4,500.00
10 @ $4,800.00 = $115,500.00
Apr. 30
10 @ $4,800.00
5 @ $4,500.00
10 @ $3,000.00
= $100,500.00
5 @ $3,000.00 = $ 15,000.00
$220,500.00
Problem 5-1B (Continued)
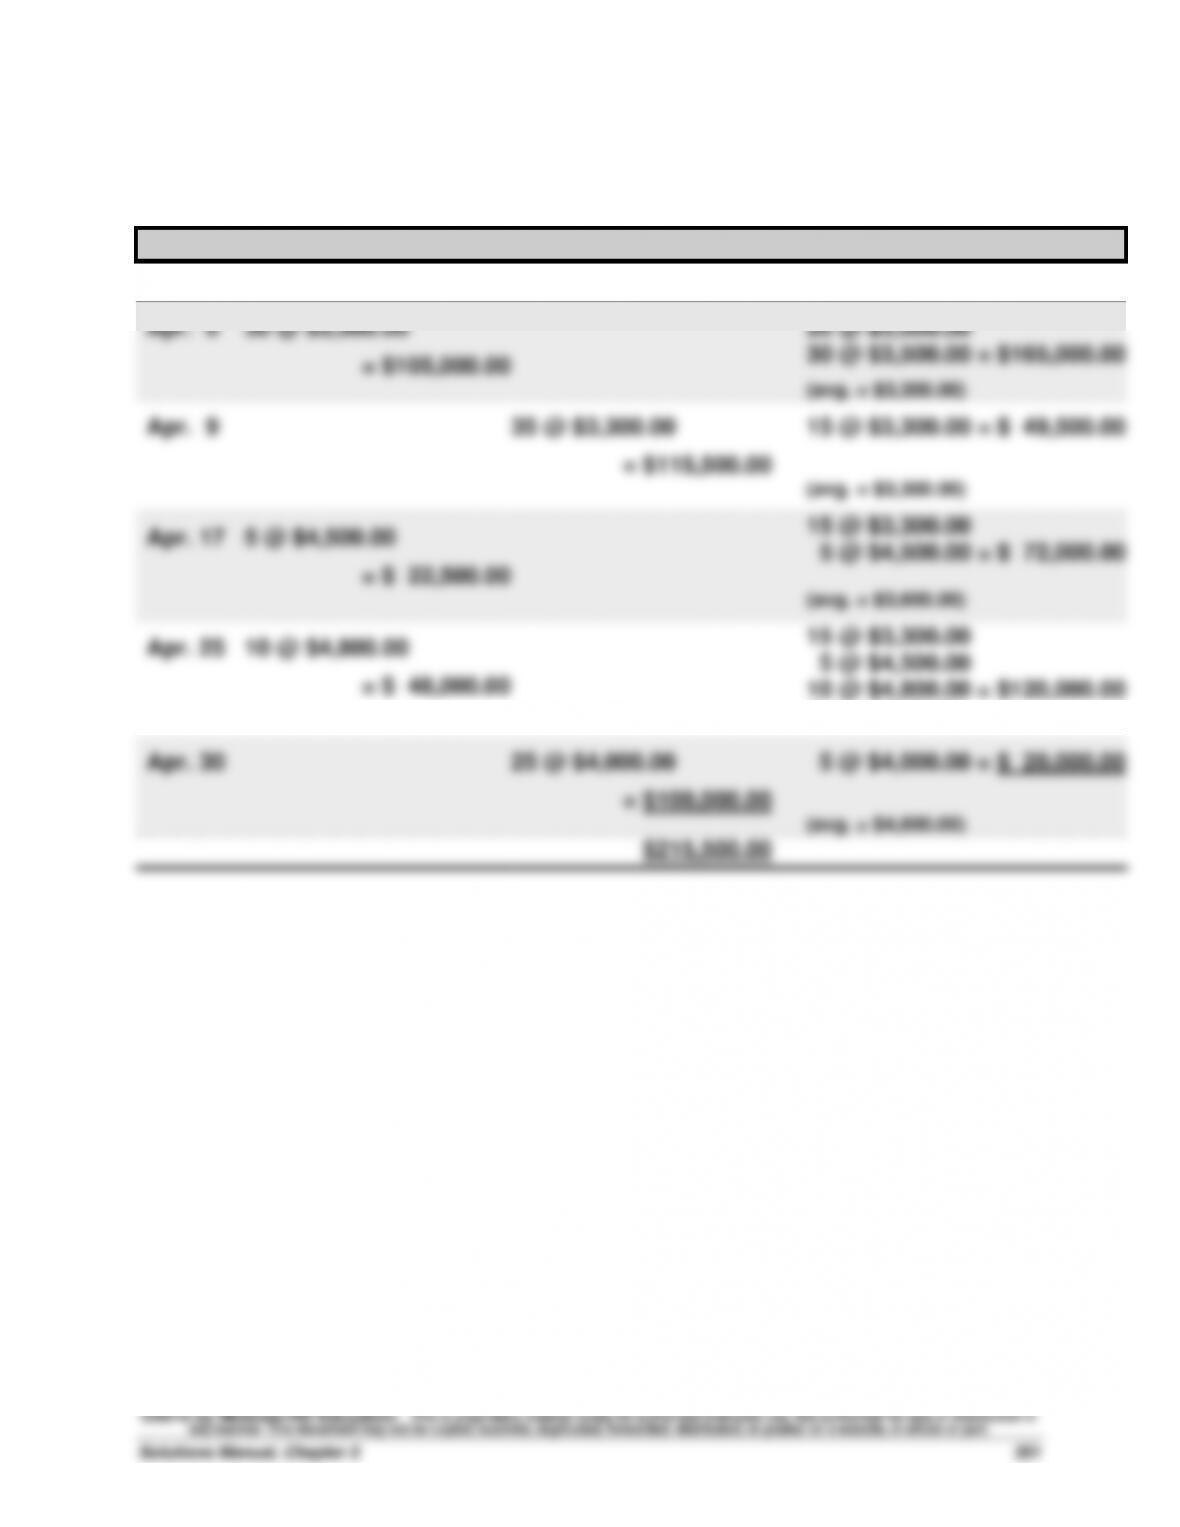
3c. Weighted Average perpetual
Date
Goods Purchased
Cost of Goods Sold
Inventory Balance
Apr. 1
20 @ $3,000.00 = $ 60,000.00
Apr. 6
30 @ $3,500.00
= $105,000.00
20 @ $3,000.00
30 @ $3,500.00 = $165,000.00
(avg. = $3,300.00)
Apr. 9
35 @ $3,300.00
= $115,500.00
15 @ $3,300.00 = $ 49,500.00
(avg. = $3,300.00)
Apr. 17
5 @ $4,500.00
= $ 22,500.00
15 @ $3,300.00
5 @ $4,500.00 = $ 72,000.00
(avg. = $3,600.00)
Apr. 25
10 @ $4,800.00
= $ 48,000.00
15 @ $3,300.00
5 @ $4,500.00
10 @ $4,800.00 = $120,000.00
(avg. = $4,000.00)
Apr. 30
25 @ $4,000.00
= $100,000.00
5 @ $4,000.00 = $ 20,000.00
(avg. = $4,000.00)
$215,500.00