Exercise 5-7 (20 minutes)
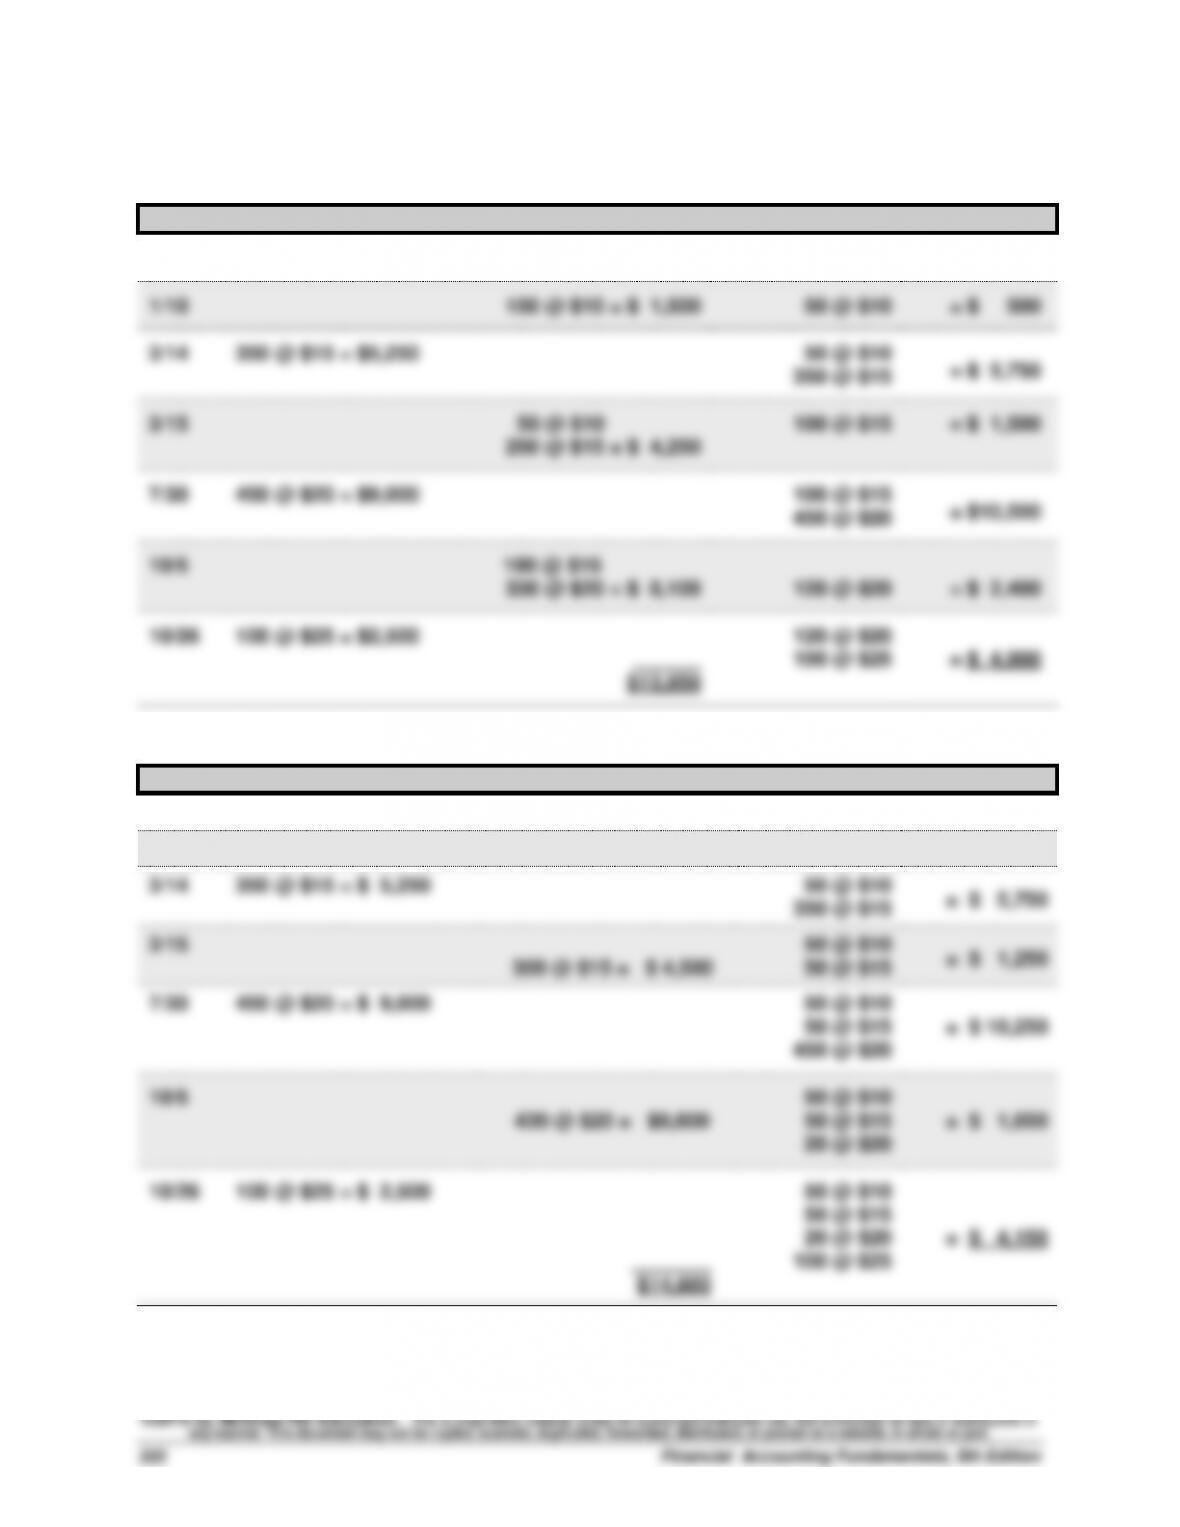
a. FIFO—Perpetual
Date
Goods Purchased
Cost of Goods Sold
Inventory Balance
1/1
200 @ $10
= $ 2,000
1/10
150 @ $10 = $ 1,500
50 @ $10
= $ 500
3/14
350 @ $15 = $5,250
50 @ $10
= $ 5,750
350 @ $15
3/15
50 @ $10
100 @ $15
= $ 1,500
250 @ $15 = $ 4,250
7/30
450 @ $20 = $9,000
100 @ $15
= $10,500
450 @ $20
10/5
100 @ $15
330 @ $20 = $ 8,100
120 @ $20
= $ 2,400
10/26
100 @ $25 = $2,500
120 @ $20
______
100 @ $25
= $ 4,900
$13,850
b. LIFO—Perpetual
Date
Goods Purchased
Cost of Goods Sold
Inventory Balance
1/1
200 @ $10
= $ 2,000
1/10
150 @ $10 = $ 1,500
50 @ $10
= $ 500
3/14
350 @ $15 = $ 5,250
50 @ $10
= $ 5,750
350 @ $15
3/15
50 @ $10
= $ 1,250
300 @ $15 = $ 4,500
50 @ $15
7/30
450 @ $20 = $ 9,000
50 @ $10
50 @ $15
= $ 10,250
450 @ $20
10/5
50 @ $10
430 @ $20 = $8,600
50 @ $15
= $ 1,650
20 @ $20
10/26
100 @ $25 = $ 2,500
50 @ $10
50 @ $15
20 @ $20
= $ 4,150
_______
100 @ $25
$14,600
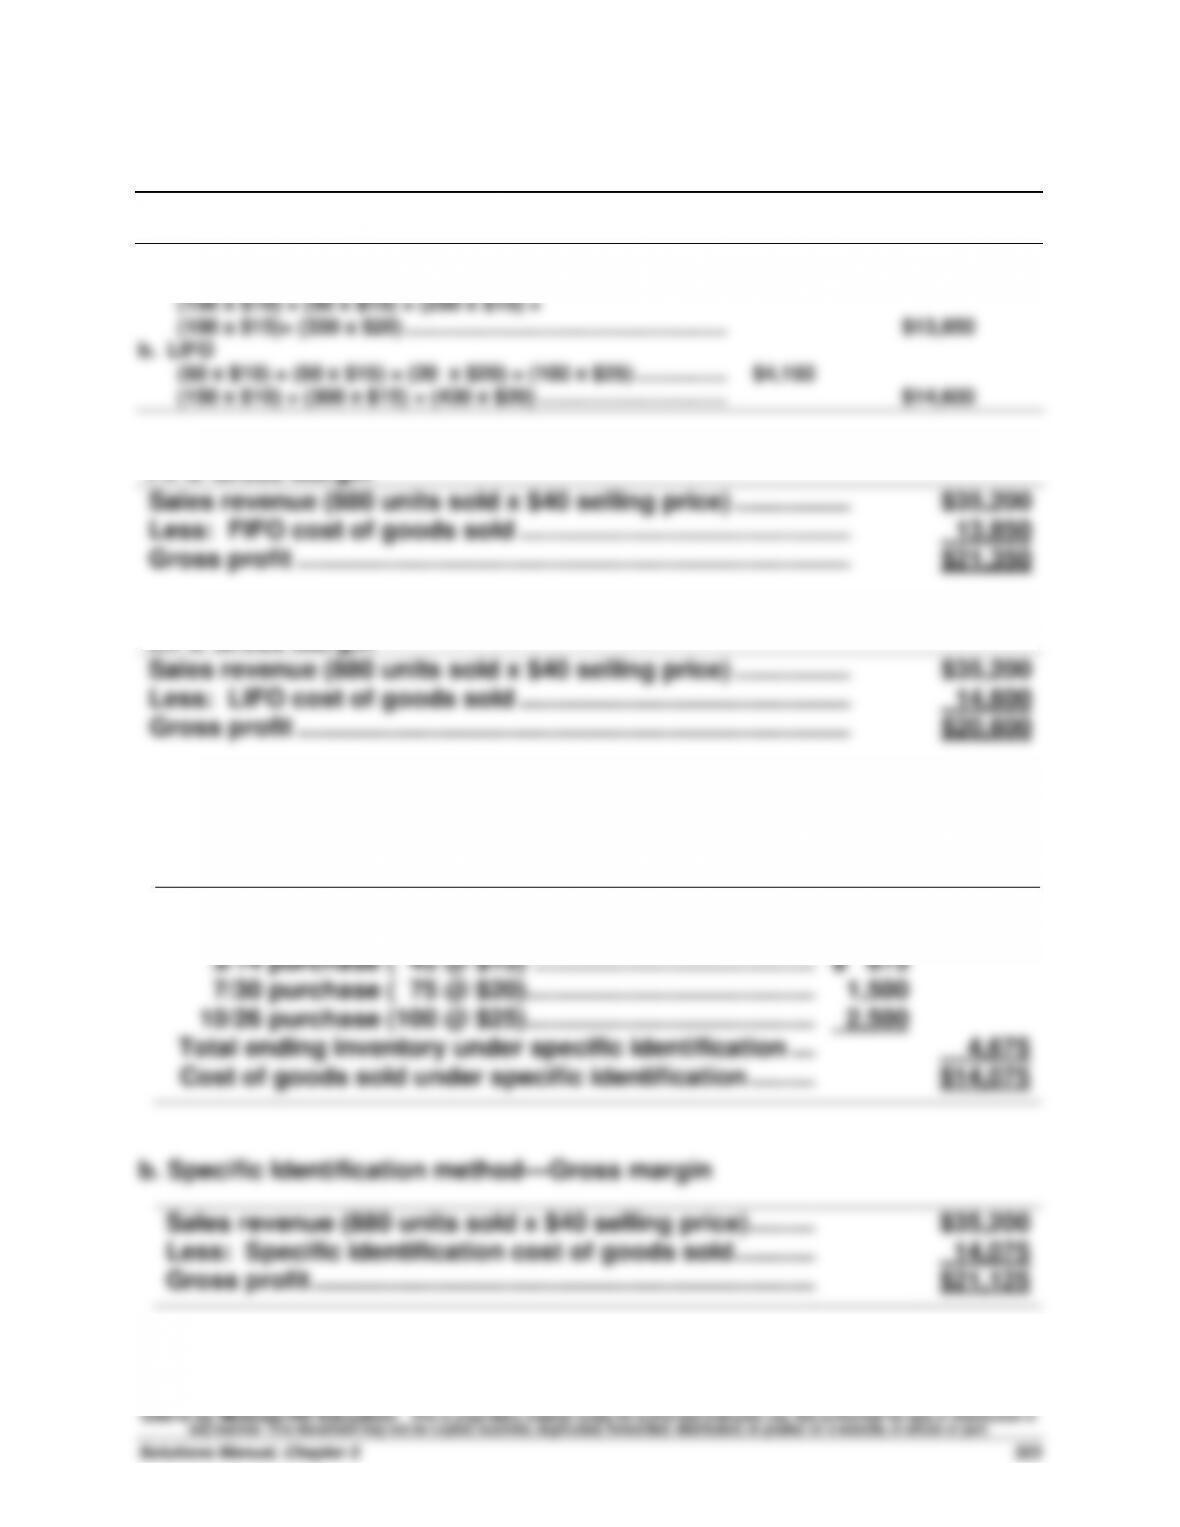
Exercise 5-7 (Concluded)
Alternate Solution Format
Ending Cost of
Inventory Goods Sold
a. FIFO
(100 x $25) + (120 x $20) ………………………………………………… $4,900
FIFO Gross Margin
Sales revenue (880 units sold x $40 selling price) ……………..……..
$35,200
Less: FIFO cost of goods sold ………………………………………………..
13,850
Gross profit ……………………………………………………………………..……..
$21,350
LIFO Gross Margin
Sales revenue (880 units sold x $40 selling price) ……………..……..
$35,200
Less: LIFO cost of goods sold ………………………………………………..
14,600
Gross profit ……………………………………………………………………..……..
$20,600
Exercise 5-8 (15 minutes)
a. Specific Identification method—Cost of goods sold
Cost of goods available for sale ………………………………………
$18,750
Ending inventory under specific identification
3/14 purchase ( 45 @ $15) …………………………………..……
$ 675
7/30 purchase ( 75 @ $20) …………………………………………
1,500
10/26 purchase (100 @ $25) …………………………………………
2,500
Total ending inventory under specific identification ….……
4,675
Cost of goods sold under specific identification ……….……
$14,075
b. Specific Identification method—Gross margin
Sales revenue (880 units sold x $40 selling price) ……….……
$35,200
Less: Specific identification cost of goods sold ………………
14,075
Gross profit ……………………………………………………………….……
$21,125
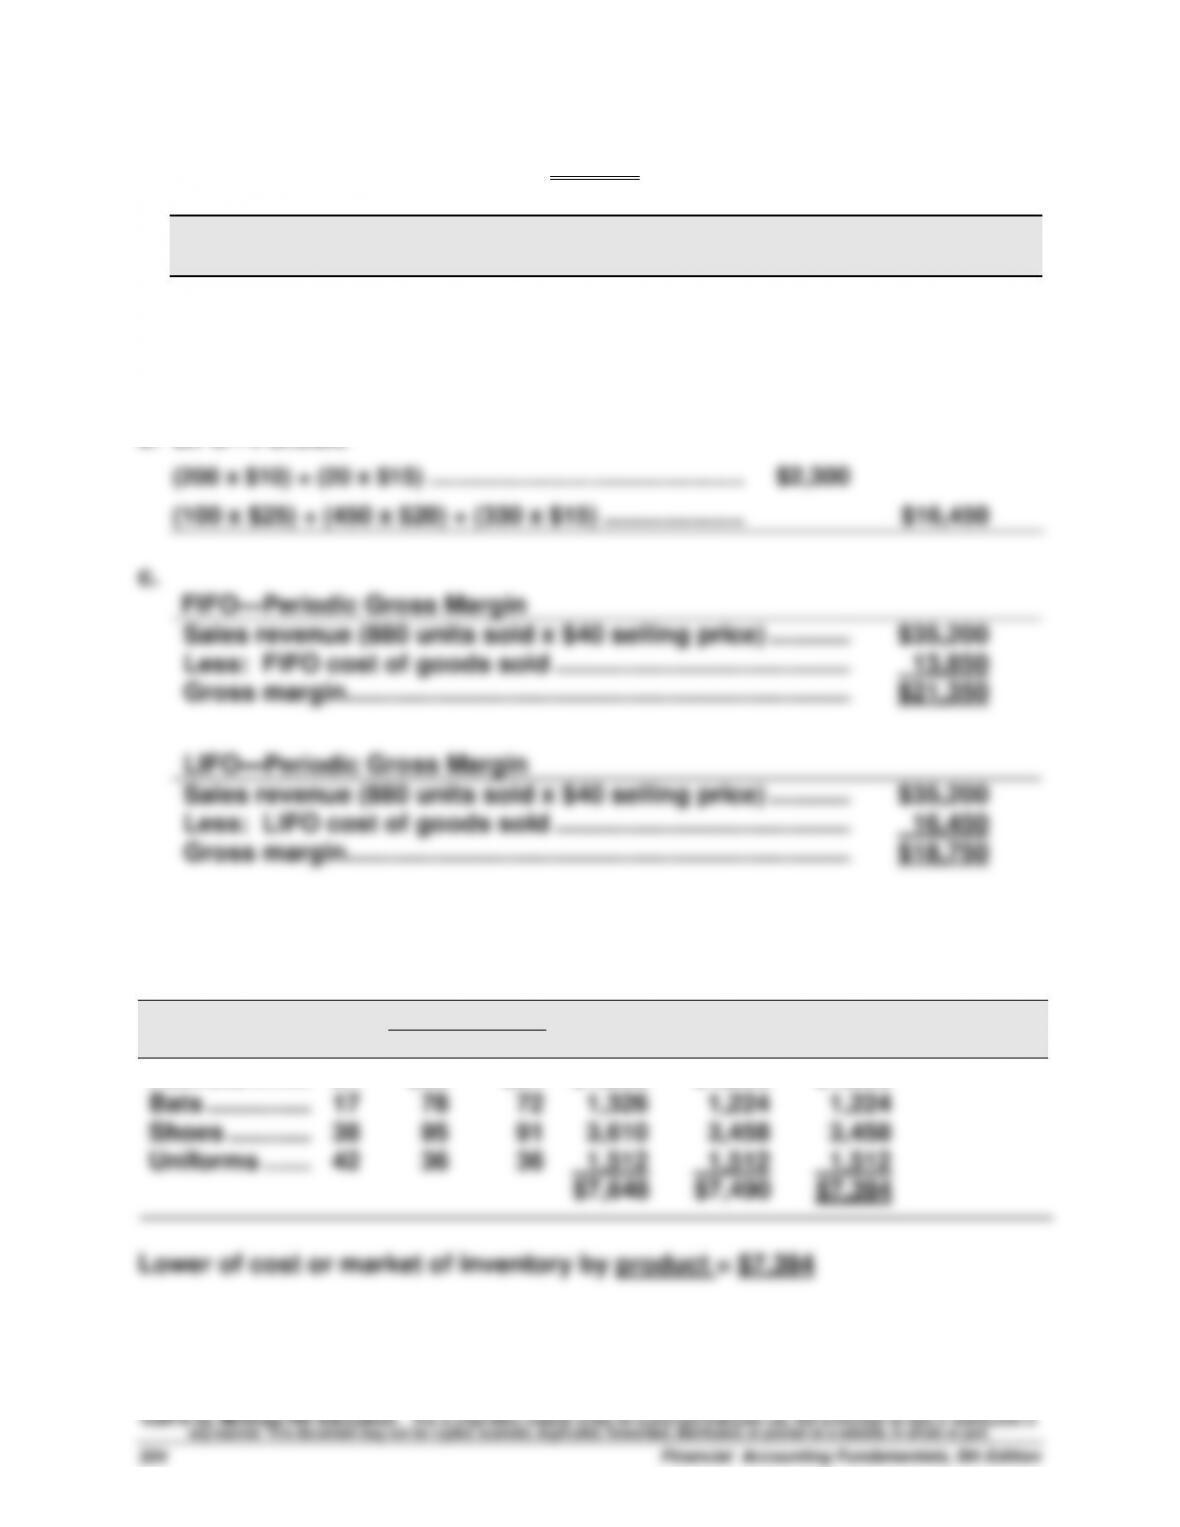
Exercise 5-9A (20 minutes)
Cost of goods available for sale = $18,750 (given in Exercise 5-7)
Ending Cost of
Periodic Inventory System Inventory Goods Sold
a. FIFO—Periodic
(100 x $25) + (120 x $20) …………………………………….. $4,900
(200 x $10) + (350 x $15) + (330 x $20) ………………… $13,850
b. LIFO—Periodic
Sales revenue (880 units sold x $40 selling price) …………….
$35,200
Less: FIFO cost of goods sold …………………………………….….
13,850
Gross margin ……………………………………………………………….….
$21,350
LIFO—Periodic Gross Margin
Sales revenue (880 units sold x $40 selling price) …………….
$35,200
Less: LIFO cost of goods sold …………………………………….….
16,450
Gross margin ……………………………………………………………….….
$18,750
Exercise 5-10 (15 minutes)
Per Unit
Total
Total
LCM Applied
to Items
Inventory Items
Units
Cost
Market
Cost
Market
Helmets ………..
24
$50
$54
$1,200
$1,296
$1,200
Bats ……………..
17
78
72
1,326
1,224
1,224
Shoes …………..
38
95
91
3,610
3,458
3,458
Uniforms ……...
42
36
36
1,512
1,512
1,512
$7,648
$7,490
$7,394
Lower of cost or market of inventory by product = $7,394
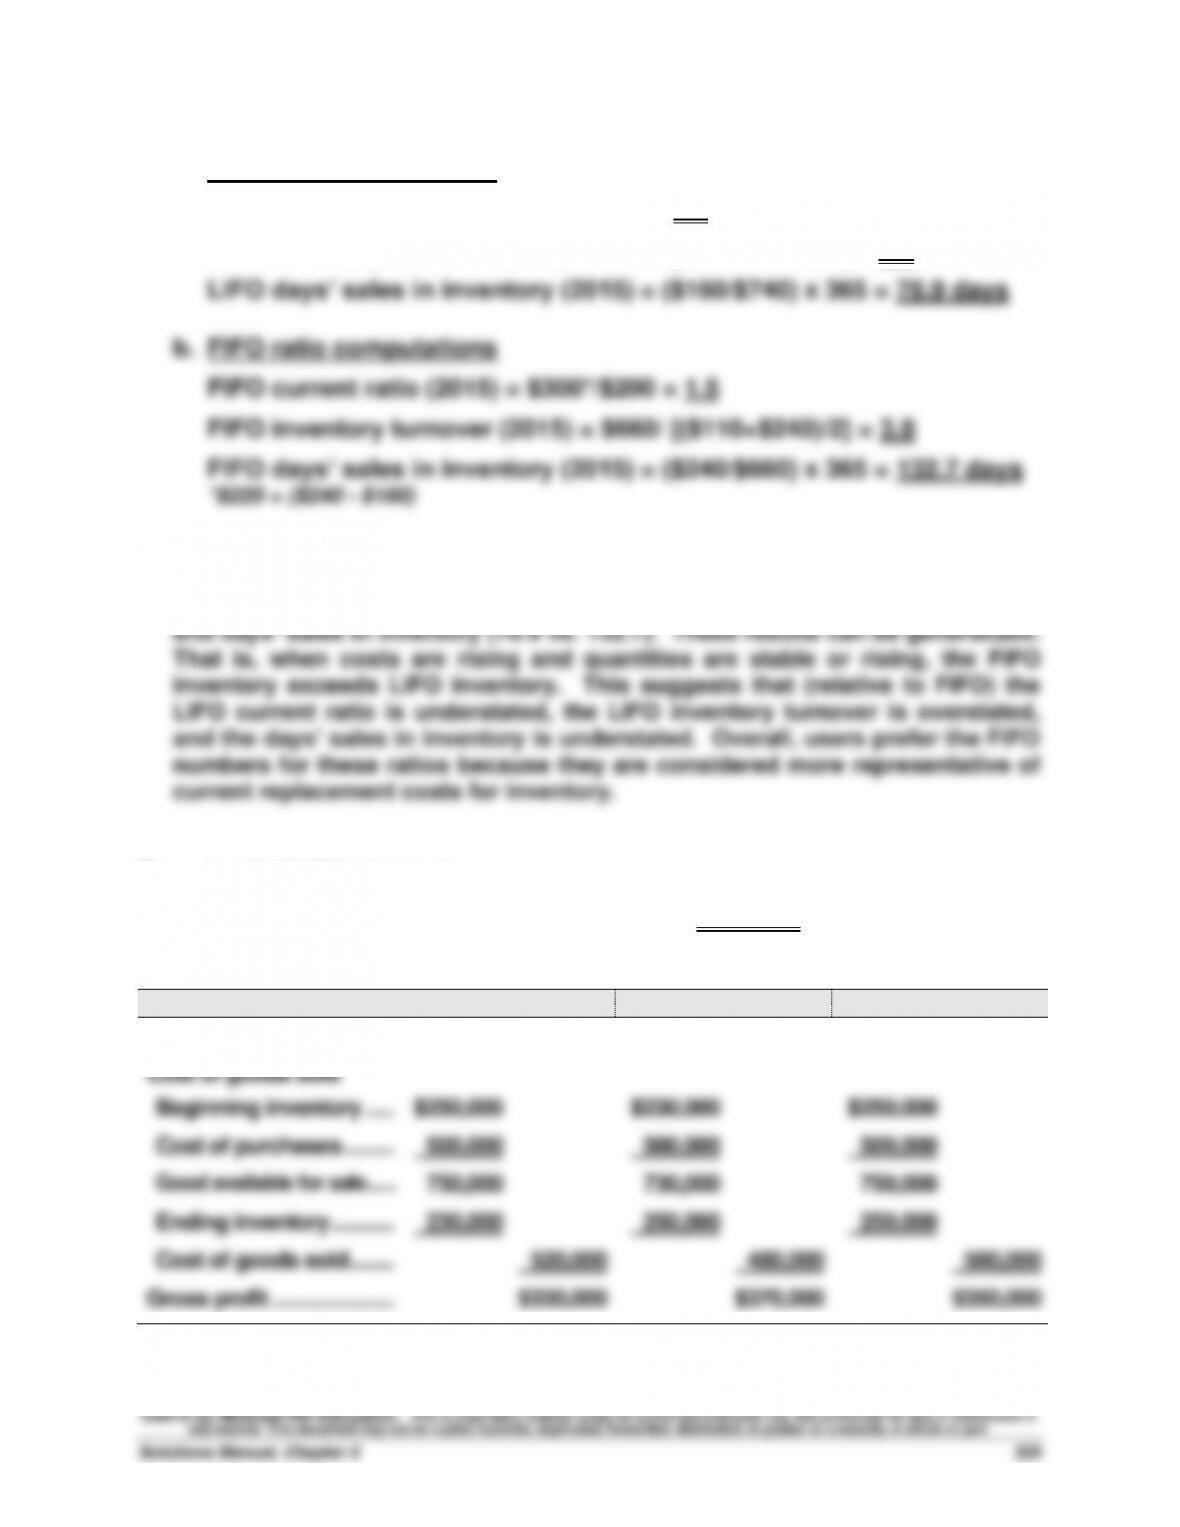
Exercise 5-11 (20 minutes)
1. a. LIFO ratio computations
LIFO current ratio (2015) = $220/$200 = 1.1
LIFO inventory turnover (2015) = $740/ [($110+$160)/2] = 5.5
2. The use of LIFO versus FIFO for Cruz markedly impacts the ratios computed.
Specifically, LIFO makes Cruz appear worse in comparison to FIFO numbers
on the current ratio (1.1 vs. 1.5) but better on inventory turnover (5.5 vs. 3.8)
Exercise 5-12 (25 minutes)
1. Correct gross profit = $850,000 – $500,000 = $350,000 (for each year)
2. Reported income figures
Year 2014
Year 2015
Year 2016
Sales …………………………….
$850,000
$850,000
$850,000
Cost of goods sold
Beginning inventory …..
$250,000
$230,000
$250,000
Cost of purchases ………
500,000
500,000
500,000
Good available for sale ……
750,000
730,000
750,000
Ending inventory ………..
230,000
250,000
250,000
Cost of goods sold ……..
520,000
480,000
500,000
Gross profit ………………….
$330,000
$370,000
$350,000
Exercise 5-13 (20 minutes)
2014 Inventory turnover 2014 Days’ Sales in Inventory
2015 Inventory turnover 2015 Days’ Sales in Inventory
Analysis comment: It appears that during a period of increasing sales, Palmer
Exercise 5-14A (20 minutes)
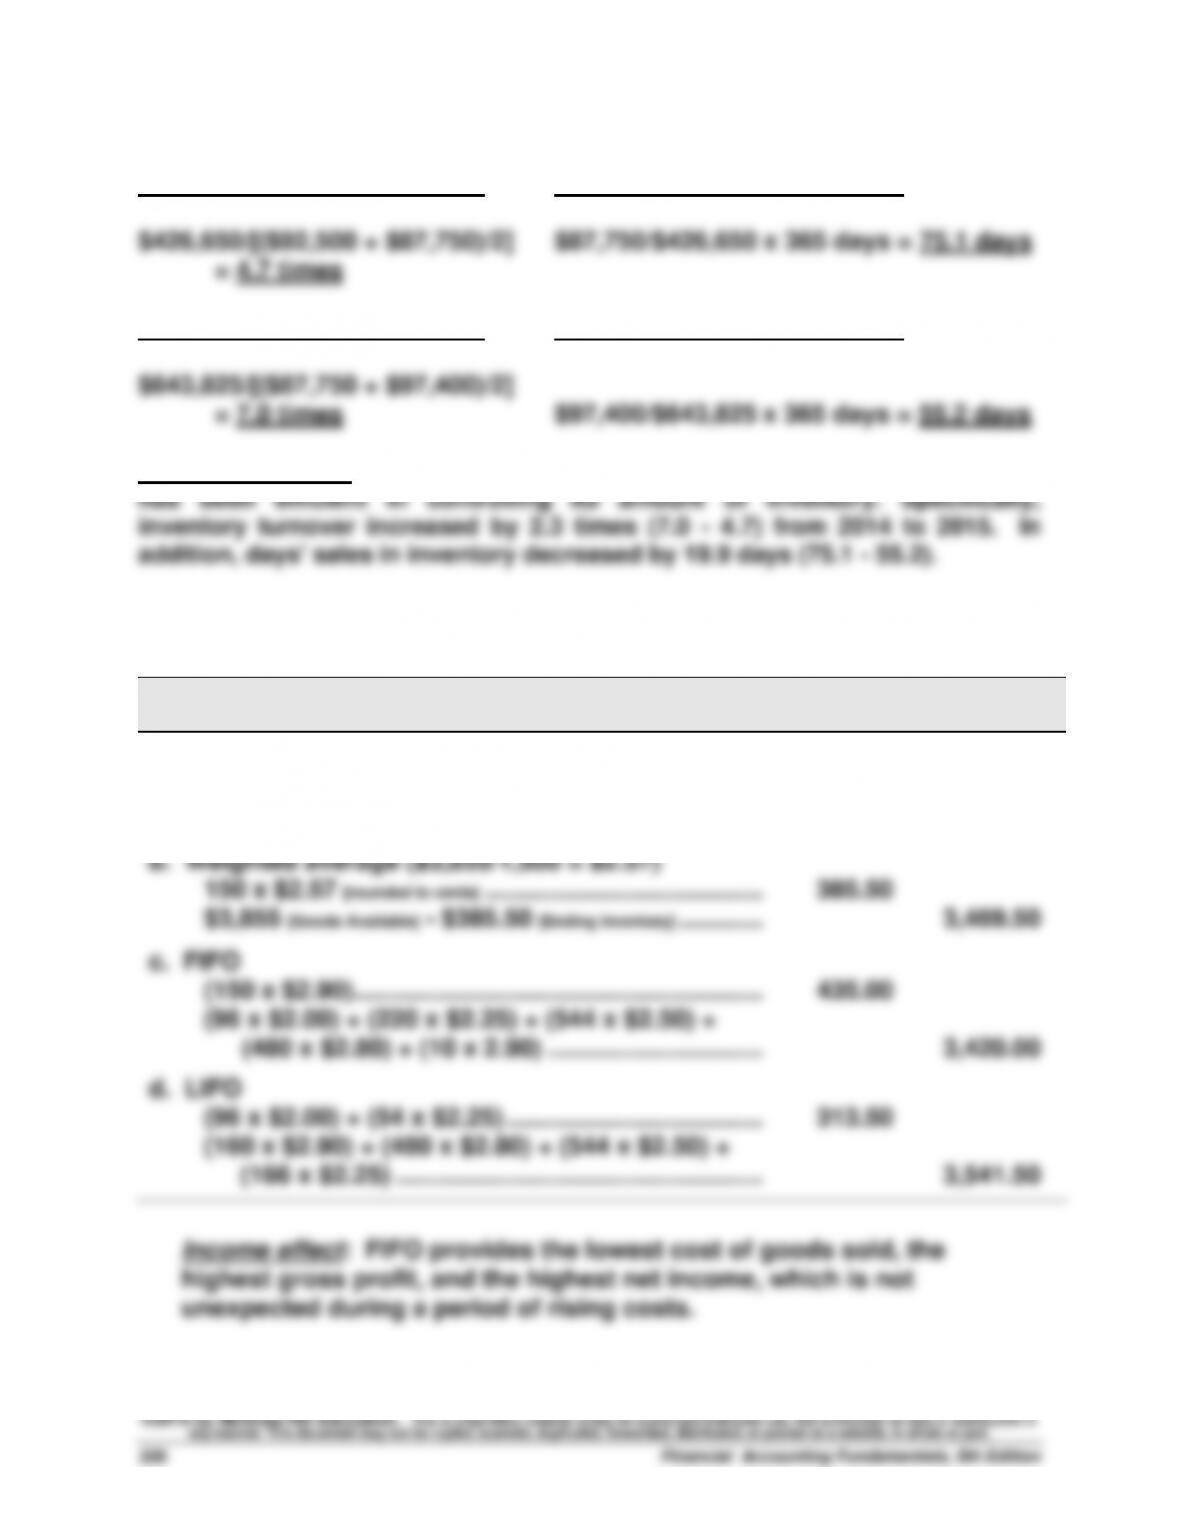
Ending
Inventory
Cost of
Goods Sold
a. Specific identification
(50 x $2.90) + (50 x $2.80) + (50 x $2.50) ………….
$410.00
$3,855 [Goods Available] – $410.00 [Ending Inventory] …………
$3,445.00
b. Weighted average ($3,855/1,500 = $2.57)
150 x $2.57 [rounded to cents] ………………………………….
385.50
$3,855 [Goods Available] – $385.50 [Ending Inventory] …………
3,469.50
c. FIFO
(150 x $2.90)…………………………………………………..
435.00
(96 x $2.00) + (220 x $2.25) + (544 x $2.50) +
(480 x $2.80) + (10 x 2.90) ………………………….
3,420.00
d. LIFO
(96 x $2.00) + (54 x $2.25) ……………………………….
313.50
(160 x $2.90) + (480 x $2.80) + (544 x $2.50) +
(166 x $2.25) ……………………………………………..
3,541.50
Income effect: FIFO provides the lowest cost of goods sold, the
highest gross profit, and the highest net income, which is not
unexpected during a period of rising costs.
Exercise 5-15A (20 minutes)
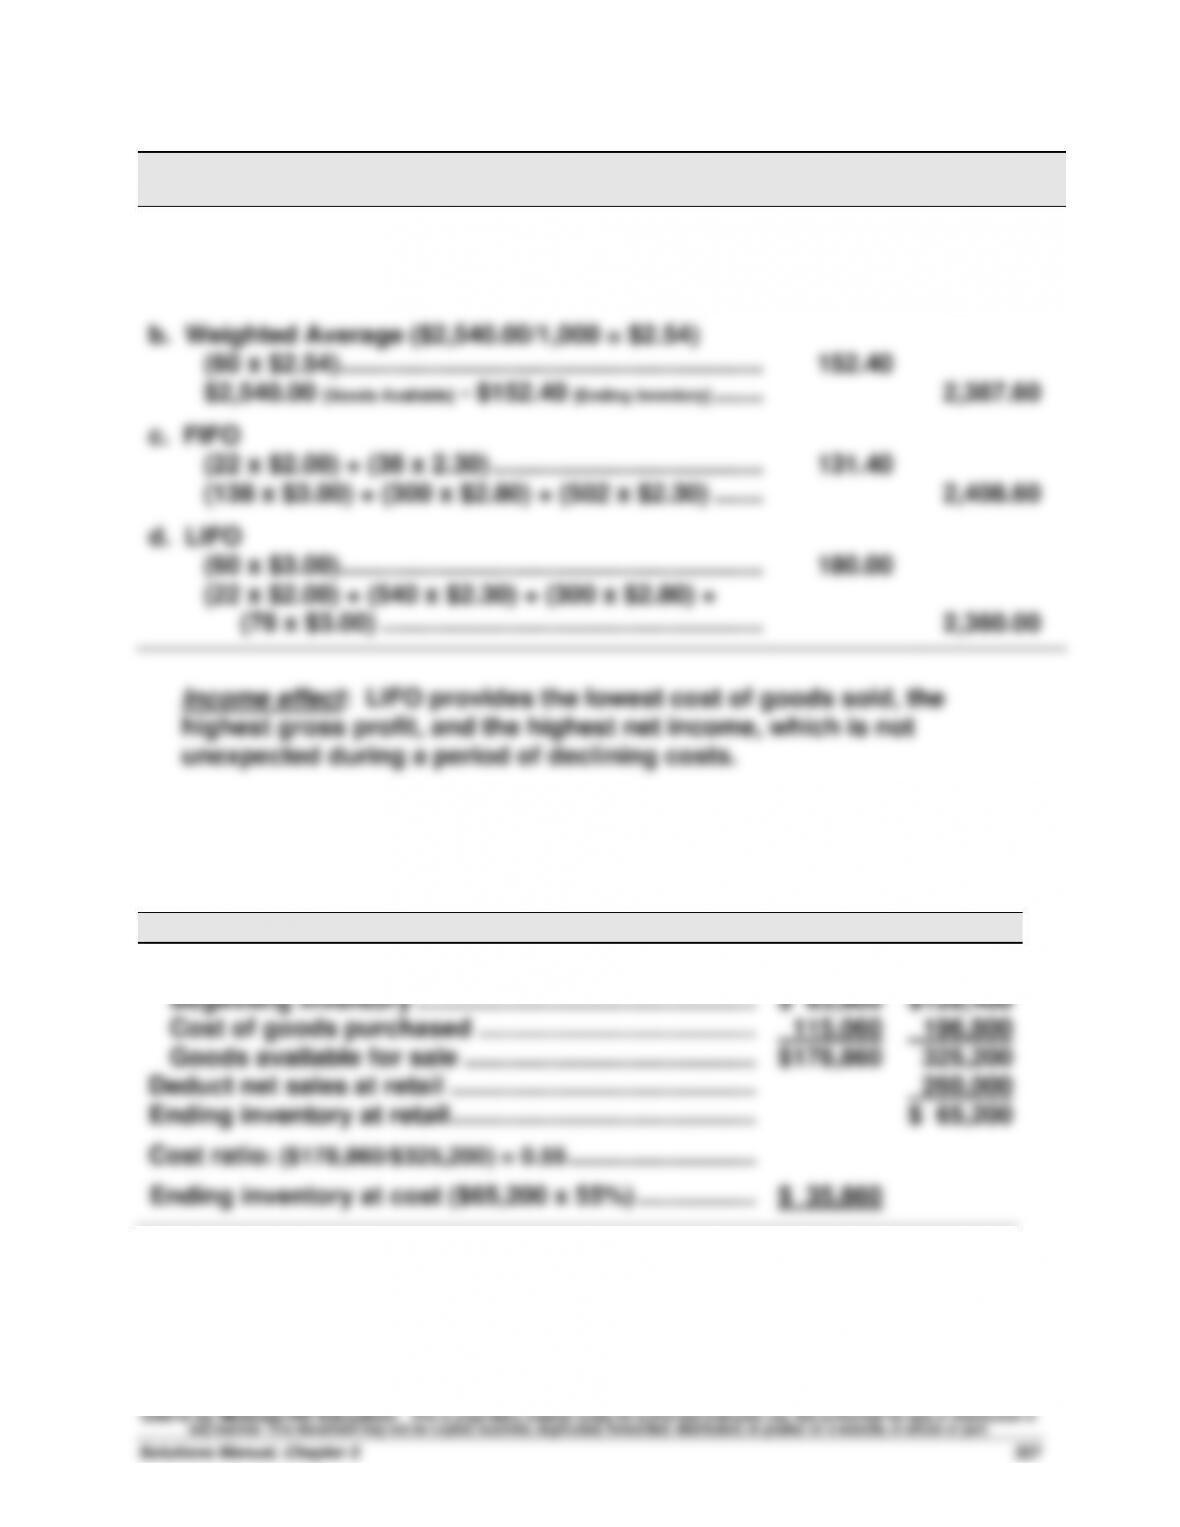
Periodic Inventory
Ending
Inventory
Cost of
Goods Sold
a. Specific Identification
(50 x $2.80) + (10 x $2.00) ……………………………….
$160.00
$2,540.00 [Goods Available] – $160.00 [Ending Inventory] …….
$2,380.00
b. Weighted Average ($2,540.00/1,000 = $2.54)
(60 x $2.54)…………………………………………………….
152.40
$2,540.00 [Goods Available] – $152.40 [Ending Inventory] …….
2,387.60
c. FIFO
(22 x $2.00) + (38 x 2.30) …………………………………
131.40
(138 x $3.00) + (300 x $2.80) + (502 x $2.30) …….
2,408.60
d. LIFO
(60 x $3.00)…………………………………………………….
180.00
(22 x $2.00) + (540 x $2.30) + (300 x $2.80) +
(78 x $3.00) ……………………………………………….
2,360.00
Income effect: LIFO provides the lowest cost of goods sold, the
highest gross profit, and the highest net income, which is not
unexpected during a period of declining costs.
Exercise 5-16B (20 minutes)
At Cost
At Retail
Goods available for sale
Beginning inventory …………………………………………...
$ 63,800
$128,400
Cost of goods purchased …………………………………...
115,060
196,800
Goods available for sale ……………………………………..
$178,860
325,200
Deduct net sales at retail ……………………………………....
260,000
Ending inventory at retail ……………………………………....
$ 65,200
Cost ratio: ($178,860/$325,200) = 0.55 ………………………..
Ending inventory at cost ($65,200 x 55%) ……………....
$ 35,860
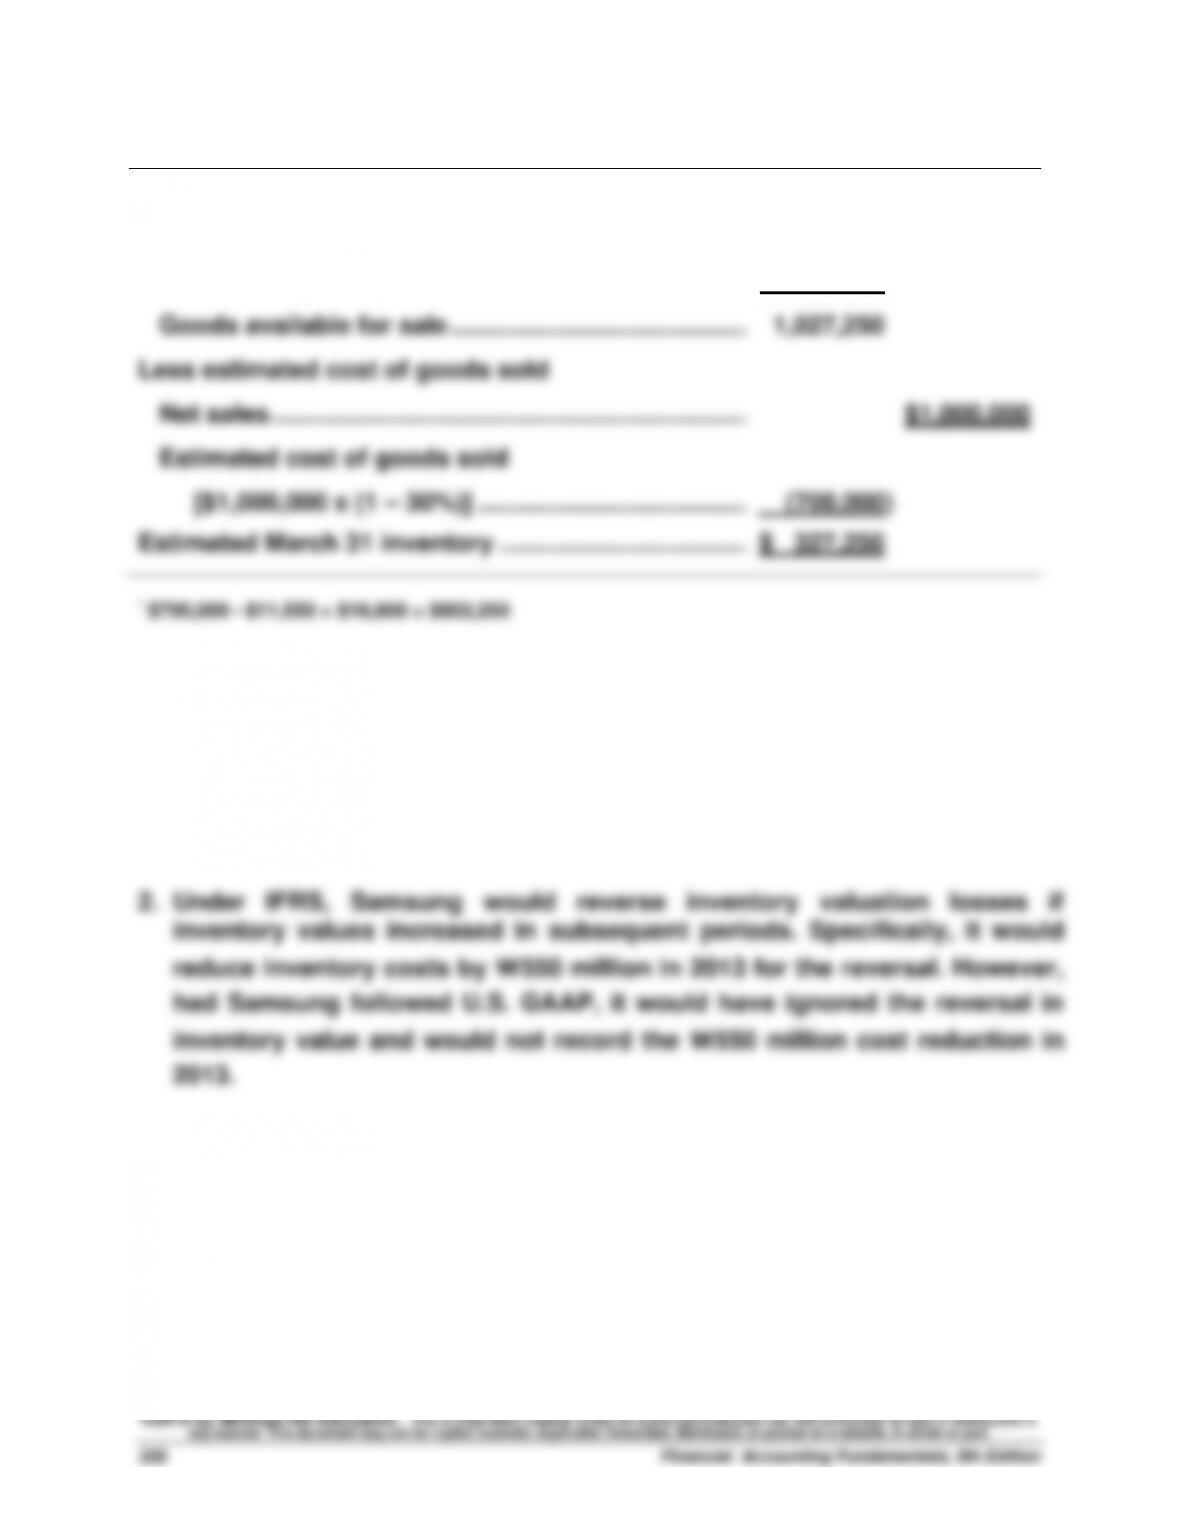
Exercise 5-17B (20 minutes)
Goods available for sale
Inventory, January 1 ………………………………………….….
$ 225,000
Net cost of goods purchased* …………………………….….
802,250
Goods available for sale …………………………………….….
1,027,250
Less estimated cost of goods sold
Net sales ……………………………………………………………….
$1,000,000
Estimated cost of goods sold
[$1,000,000 x (1 – 30%)] …………………………………….
(700,000)
Estimated March 31 inventory …………………………..….….
$ 327,250
* $795,000 – $11,550 + $18,800 = $802,250
Exercise 5-18 (15 minutes)
1. Samsung generally applies the (weighted) average cost assumption when
assigning costs to its inventories. An exception is for its materials–in–
transit.
PROBLEM SET A
Problem 5-1A (40 minutes)
1. Compute cost of goods available for sale and units available for sale
Beginning inventory ……………………...
100 units @ $50.00
$ 5,000
March 5 ………………………………………...
400 units @ $55.00
22,000
March 18 ………………………………………..
120 units @ $60.00
7,200
March 25 ………………………………………..
200 units @ $62.00
12,400
Units available ……………………………….
820 units
Cost of goods available for sale
$46,600
2. Units in ending inventory
Units available (from part 1) …………..…………..
820 units
Less: Units sold (420 + 160) …………..…………..
580 units
Ending Inventory (units) ………………..…………
240 units
3a. FIFO perpetual
Date
Goods Purchased
Cost of Goods Sold
Inventory Balance
Mar. 1
100 @ $50.00 = $5,000
Mar. 5
400 @ $55.00 = $22,000
100 @ $50.00
400 @ $55.00 = $27,000
Mar. 9
100 @ $50.00 = $ 5,000
320 @ $55.00 = $17,600
80 @ $55.00 = $ 4,400
Mar. 18
120 @ $60.00 = $ 7,200
80 @ $55.00
120 @ $60.00 = $11,600
Mar. 25
200 @ $62.00 = $ 12,400
80 @ $55.00
120 @ $60.00
200 @ $62.00 = $24,000
Mar. 29
80 @ $55.00 = $ 4,400
80 @ $60.00 = $ 4,800
40 @ $60.00
200 @ $62.00 = $14,800
$31,800
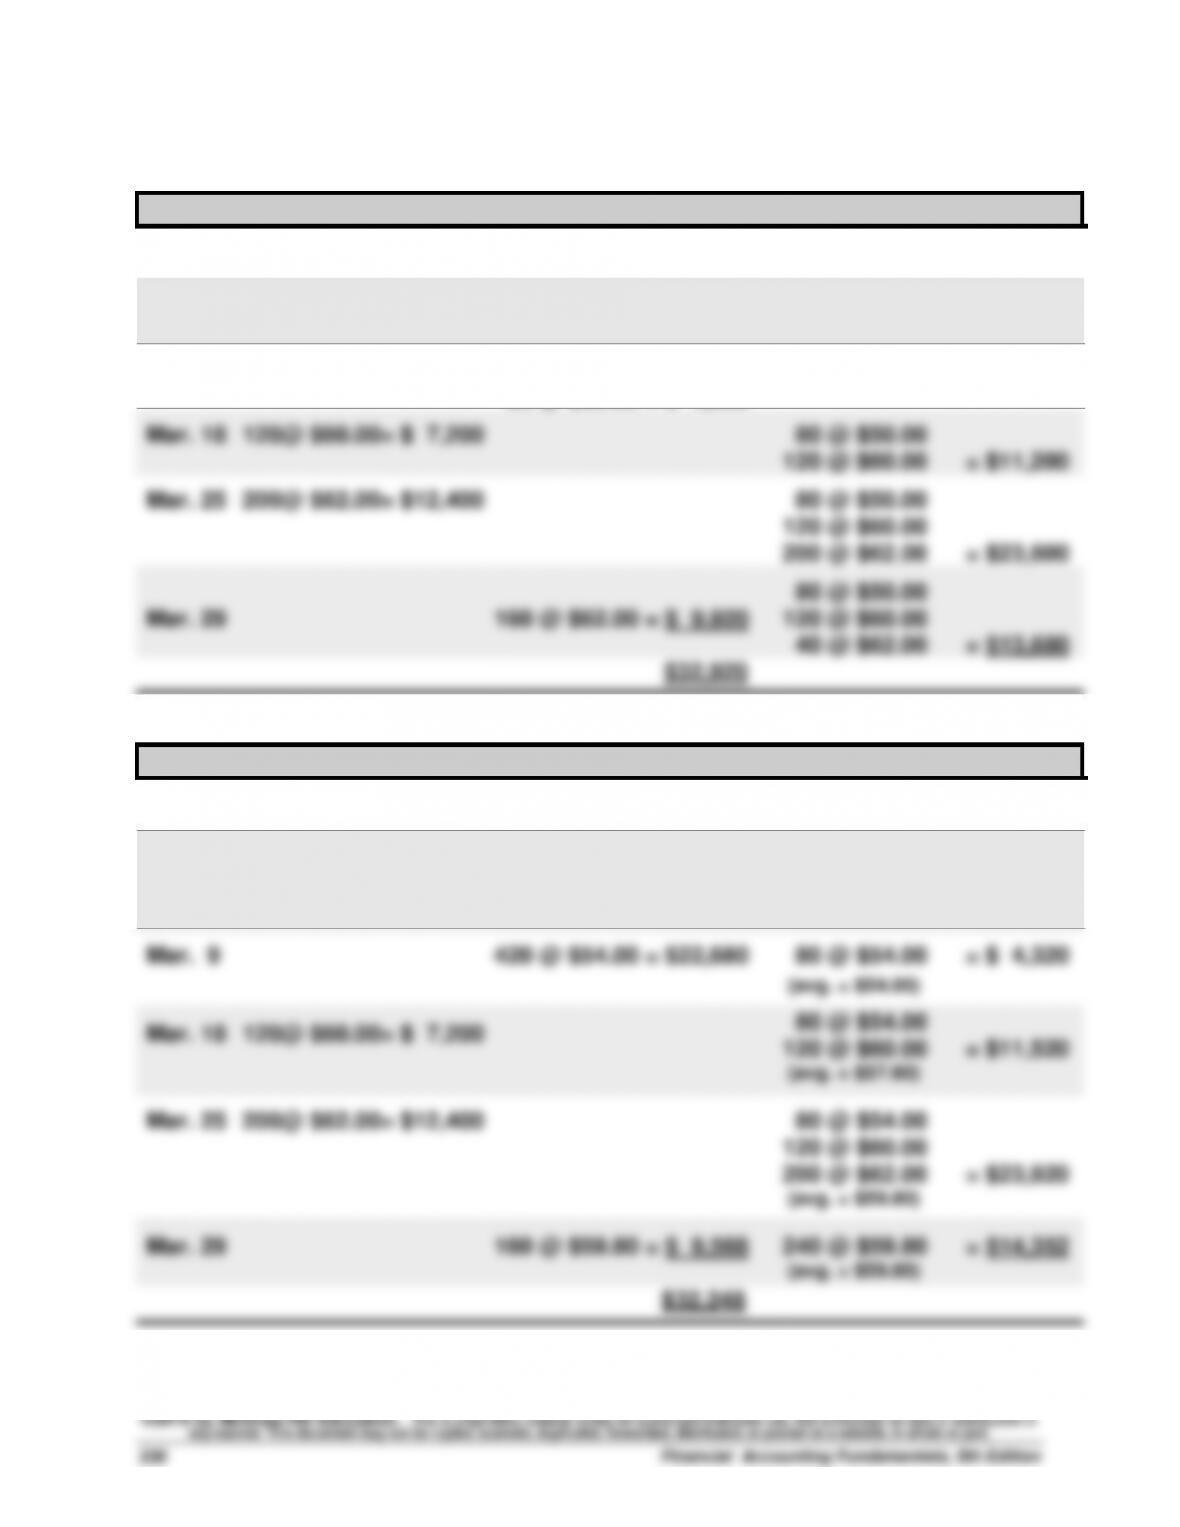
Problem 5-1A (Continued)
3b. LIFO perpetual
Date
Goods Purchased
Cost of Goods Sold
Inventory Balance
Mar. 1
100 @ $50.00 = $ 5,000
Mar. 5
400@ $55.00= $22,000
100 @ $50.00
400 @ $55.00 = $27,000
Mar. 9
400 @ $55.00 = $22,000
20 @ $50.00 = $ 1,000
80 @ $50.00 = $ 4,000
Mar. 18
120@ $60.00= $ 7,200
80 @ $50.00
120 @ $60.00 = $11,200
Mar. 25
200@ $62.00= $12,400
80 @ $50.00
120 @ $60.00
200 @ $62.00 = $23,600
Mar. 29
160 @ $62.00 = $ 9,920
80 @ $50.00
120 @ $60.00
40 @ $62.00 = $13,680
$32,920
3c. Weighted Average perpetual
Date
Goods Purchased
Cost of Goods Sold
Inventory Balance
Mar. 1
100 @ $50.00 = $ 5,000
Mar. 5
400@ $55.00= $22,000
100 @ $50.00
400 @ $55.00 = $27,000
(avg. = $54.00)
Mar. 9
420 @ $54.00 = $22,680
80 @ $54.00 = $ 4,320
(avg. = $54.00)
Mar. 18
120@ $60.00= $ 7,200
80 @ $54.00
120 @ $60.00 = $11,520
(avg. = $57.60)
Mar. 25
200@ $62.00= $12,400
80 @ $54.00
120 @ $60.00
200 @ $62.00 = $23,920
(avg. = $59.80)
Mar. 29
160 @ $59.80 = $ 9,568
240 @ $59.80 = $14,352
(avg. = $59.80)
$32,248
©2016 by McGraw-Hill Education. This is proprietary material solely for authorized instructor use. Not authorized for sale or distribution in
any manner. This document may not be copied, scanned, duplicated, forwarded, distributed, or posted on a website, in whole or part.
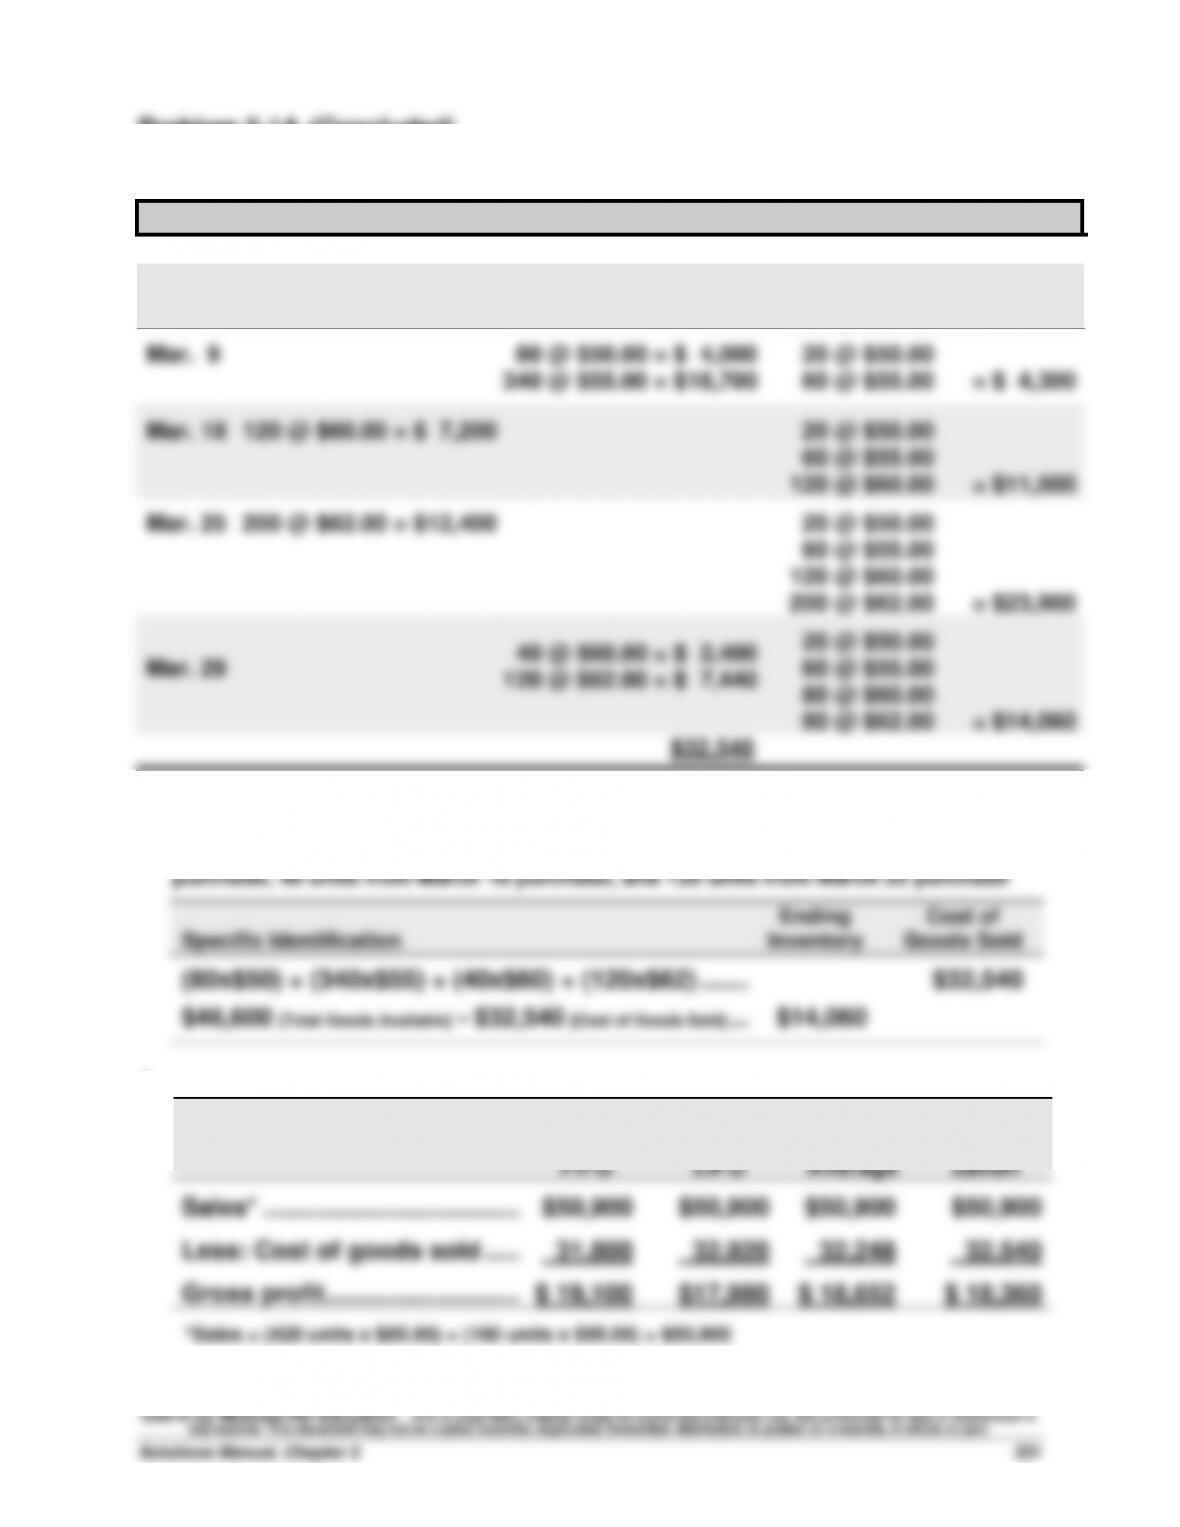
Problem 5-1A (Concluded)
3d. Specific Identification
Date
Goods Purchased
Cost of Goods Sold
Inventory Balance
Mar. 1
100 @ $50.00 = $ 5,000
Mar. 5
400 @ $55.00 = $22,000
100 @ $50.00
400 @ $55.00 = $27,000
Mar. 9
80 @ $50.00 = $ 4,000
340 @ $55.00 = $18,700
20 @ $50.00
60 @ $55.00 = $ 4,300
Mar. 18
120 @ $60.00 = $ 7,200
20 @ $50.00
60 @ $55.00
120 @ $60.00 = $11,500
Mar. 25
200 @ $62.00 = $12,400
20 @ $50.00
60 @ $55.00
120 @ $60.00
200 @ $62.00 = $23,900
Mar. 29
40 @ $60.00 = $ 2,400
120 @ $62.00 = $ 7,440
20 @ $50.00
60 @ $55.00
80 @ $60.00
80 @ $62.00 = $14,060
$32,540
Specific identification—Alternative Computation
Cost of goods sold—80 units from beginning inventory, 340 units from March 5
4.
FIFO
LIFO
Weighted
Average
Specific
Identifi-
cation
Sales* ………………………………..
$50,900
$50,900
$50,900
$50,900
Less: Cost of goods sold …...
31,800
32,920
32,248
32,540
Gross profit ………………………..
$ 19,100
$17,980
$ 18,652
$ 18,360
*Sales = (420 units x $85.00) + (160 units x $95.00) = $50,900
Problem 5-2A (40 minutes)
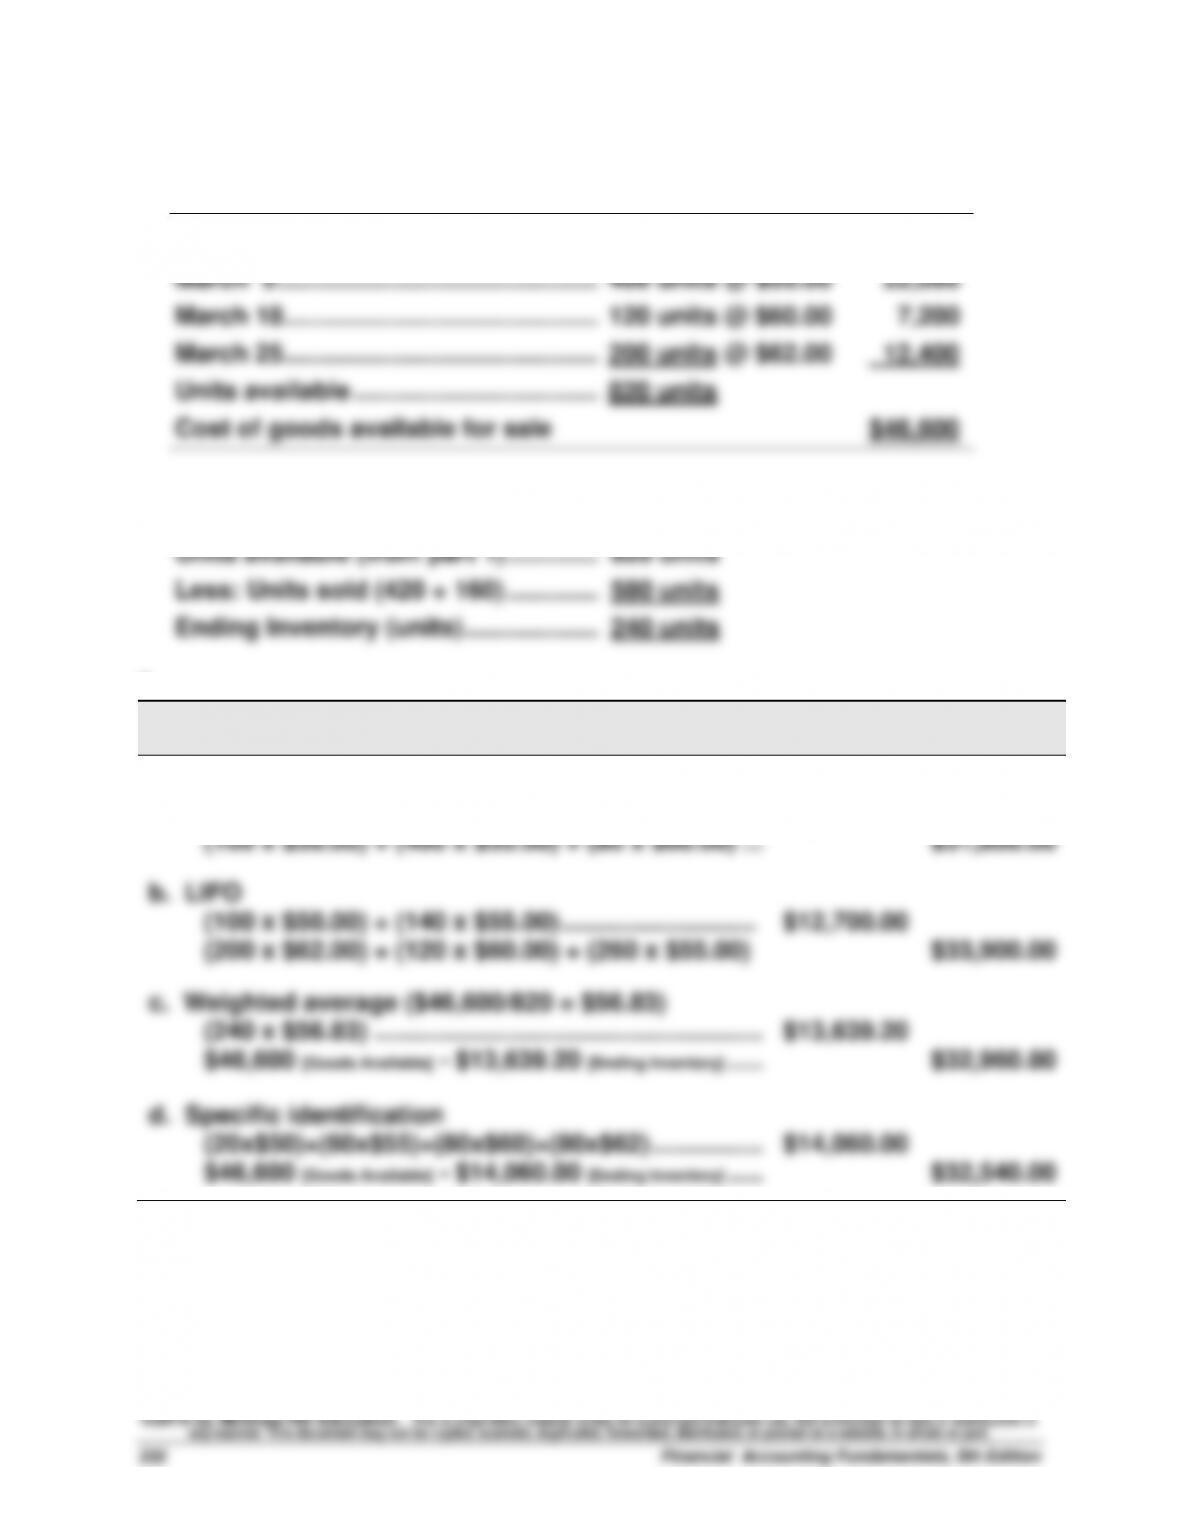
1. Compute cost of goods available for sale and units available for sale
Beginning inventory ……………………...
100 units @ $50.00
$ 5,000
March 5 ………………………………………...
400 units @ $55.00
22,000
March 18 ………………………………………..
120 units @ $60.00
7,200
March 25 ………………………………………..
200 units @ $62.00
12,400
Units available ……………………………….
820 units
Cost of goods available for sale
$46,600
2. Units in ending inventory
Units available (from part 1) …………..…………..
820 units
Less: Units sold (420 + 160) …………..…………..
580 units
Ending Inventory (units) ………………..…………
240 units
3.
Periodic Inventory
Ending
Inventory
Cost of
Goods Sold
a. FIFO
(200 x $62.00) + (40 x $60.00) ………………………….
$14,800.00
(100 x $50.00) + (400 x $55.00) + (80 x $60.00) …
$31,800.00
b. LIFO
(100 x $50.00) + (140 x $55.00) ……………………….
$12,700.00
(200 x $62.00) + (120 x $60.00) + (260 x $55.00)
$33,900.00
c. Weighted average ($46,600/820 = $56.83)
(240 x $56.83) ………………………………………………..
$13,639.20
$46,600 [Goods Available] – $13,639.20 [Ending Inventory] …..
$32,960.80
d. Specific identification
(20x$50)+(60x$55)+(80x$60)+(80x$62) …………….
$14,060.00
$46,600 [Goods Available] – $14,060.00 [Ending Inventory] …..
$32,540.00
Problem 5-2A (Concluded)
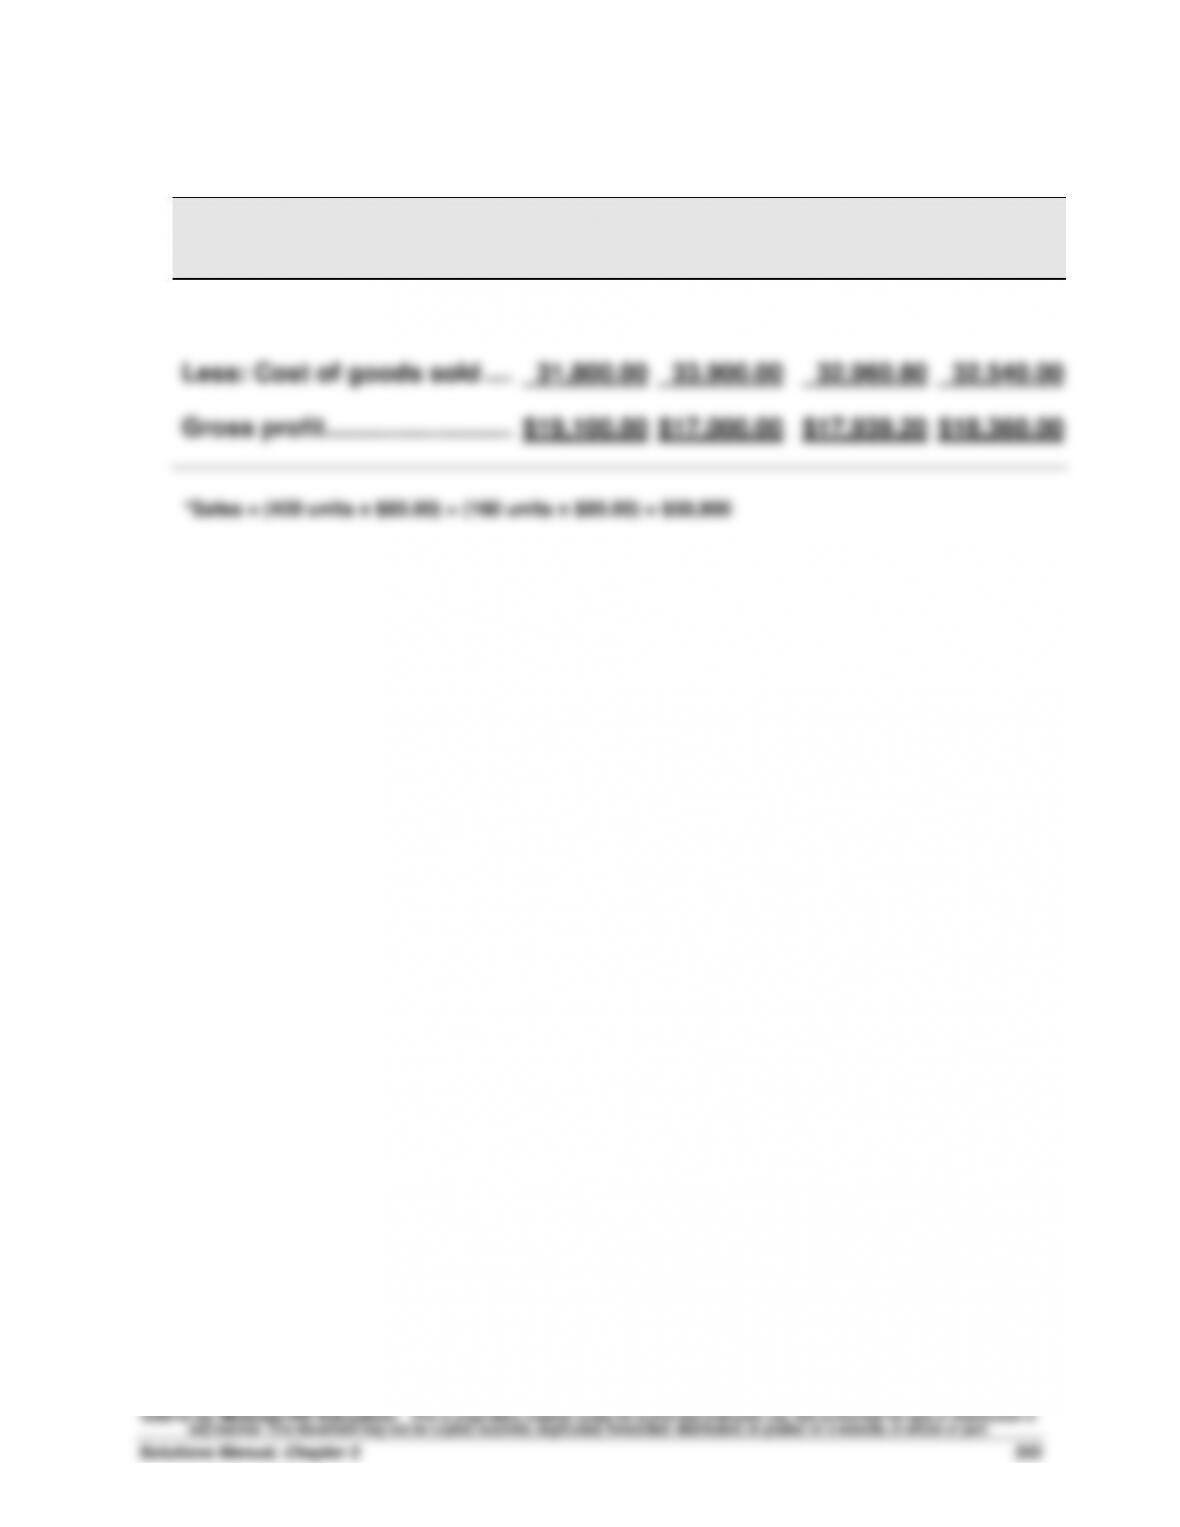
4.
FIFO
LIFO
Weighted
Average
Specific
Identifi-
cation
Sales* ………………………………..
$50,900.00
$50,900.00
$50,900.00
$50,900.00
Less: Cost of goods sold …...
31,800.00
33,900.00
32,960.80
32,540.00
Gross profit ………………………..
$19,100.00
$17,000.00
$17,939.20
$18,360.00
*Sales = (420 units x $85.00) + (160 units x $95.00) = $50,900
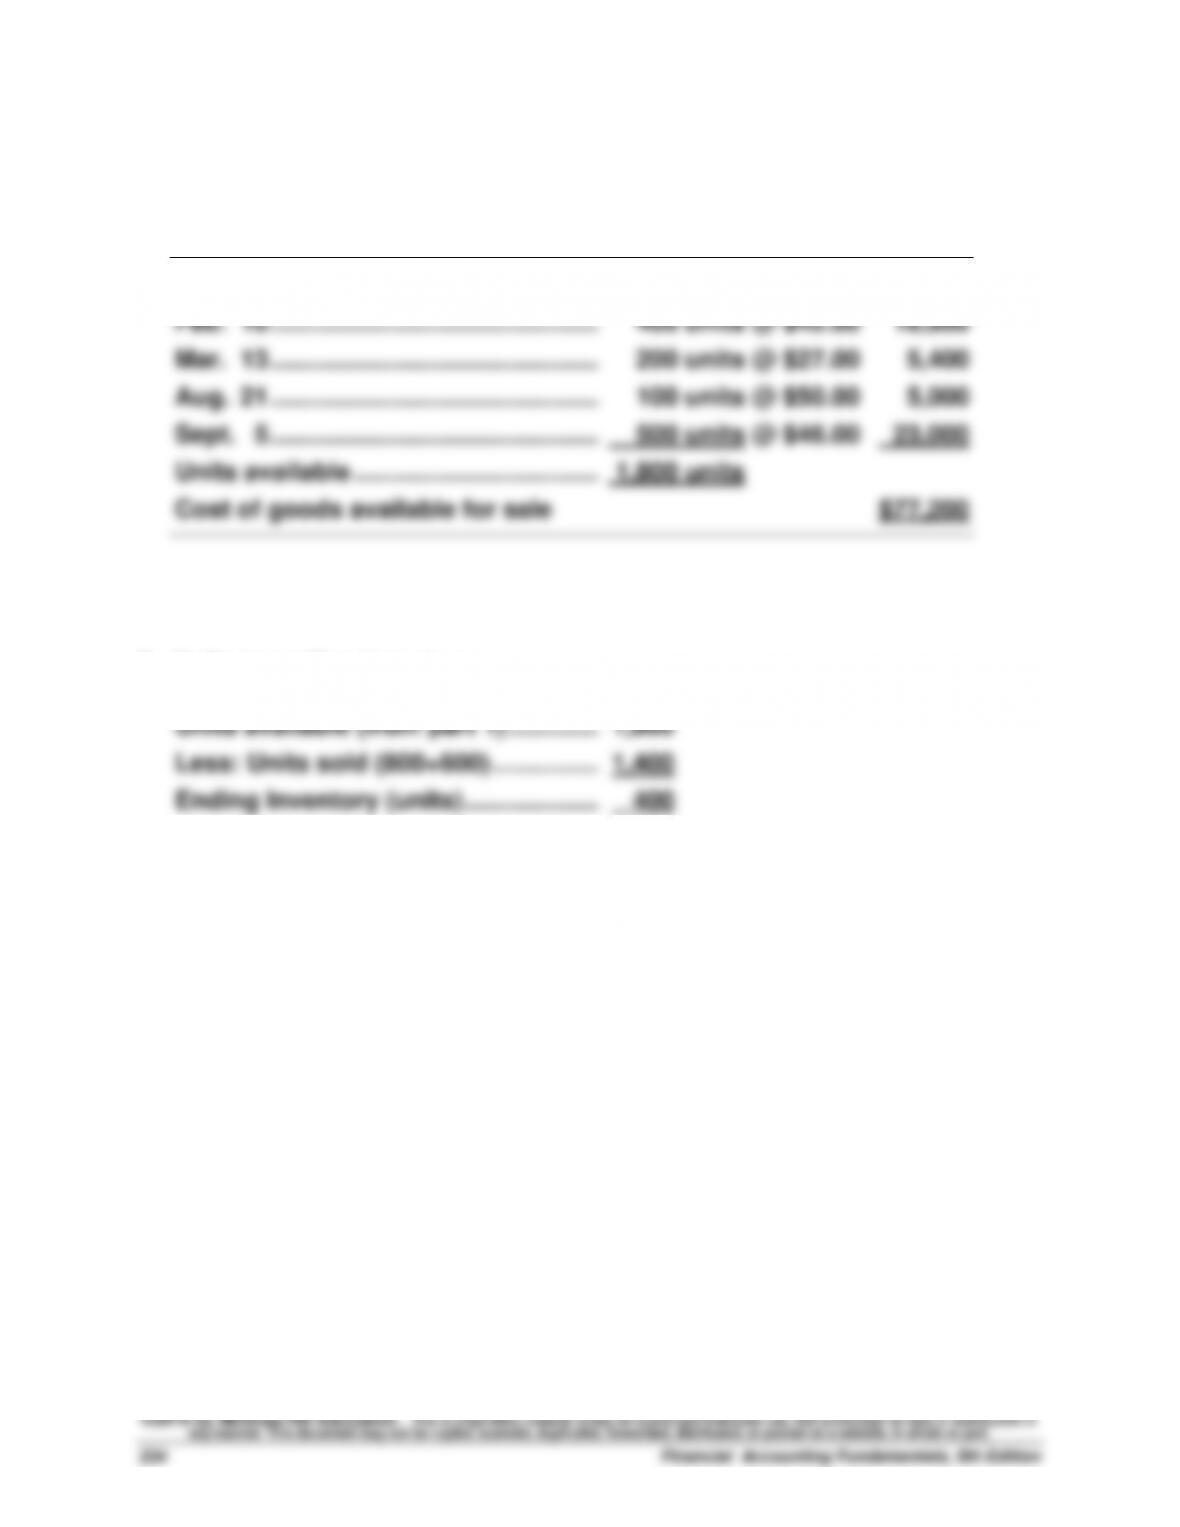
Problem 5-3A (40 minutes)
1. Calculate cost of goods available for sale and units available for sale
Beginning inventory ……………………...
600 units @ $45.00
$27,000
Feb. 10 ………………………………………….
400 units @ $42.00
16,800
Mar. 13 ………………………………………….
200 units @ $27.00
5,400
Aug. 21 …………………………..……………..
100 units @ $50.00
5,000
Sept. 5 …………………………..……………..
500 units @ $46.00
23,000
Units available ……………………………….
1,800 units
Cost of goods available for sale
$77,200
2. Units in ending inventory
Units available (from part 1) …………..…………..
1,800
Less: Units sold (800+600) …………….…………..
1,400
Ending Inventory (units) ………………..…………
400
Problem 5-3A (Continued)
3a. FIFO perpetual
Date
Goods Purchasd
Cost of Goods Sold
Inventory Balance
1/1
600 @ $45.00 = $27,000
2/10
400 @ $42.00= $16,800
600 @ $45.00
400 @ $42.00 = $43,800
3/13
200 @ $27.00= $ 5,400
600 @ $45.00
400 @ $42.00 = $49,200
200 @ $27.00
3/15
600 @ $45.00
200 @ $42.00 = $35,400
200 @ $42.00
200 @ $27.00 = $13,800
8/21
100 @ $50.00= $ 5,000
200 @ $42.00
200 @ $27.00 = $18,800
100 @ $50.00
9/5
500 @ $46.00= $23,000
200 @ $42.00
200 @ $27.00
100 @ $50.00
500 @ $46.00 = $41,800
9/10
200 @ $42.00
200 @ $27.00
100 @ $50.00
100 @ $46.00 = $23,400
400 @ $46.00 = $18,400
$58,800
FIFO Alternate Solution Format
Cost of goods available for sale
$77,200
Less: Cost of sales
600 @ $45.00
$27,000
400 @ $42.00
16,800
200 @ $27.00
5,400
100 @ $50.00
5,000
100 @ $46.00
4,600
Total cost of goods sold
58,800
Ending Inventory
$18,400
Proof of Ending Inventory
400 @ $46.00
$18,400
Ending Inventory ……………..
400 units
$18,400
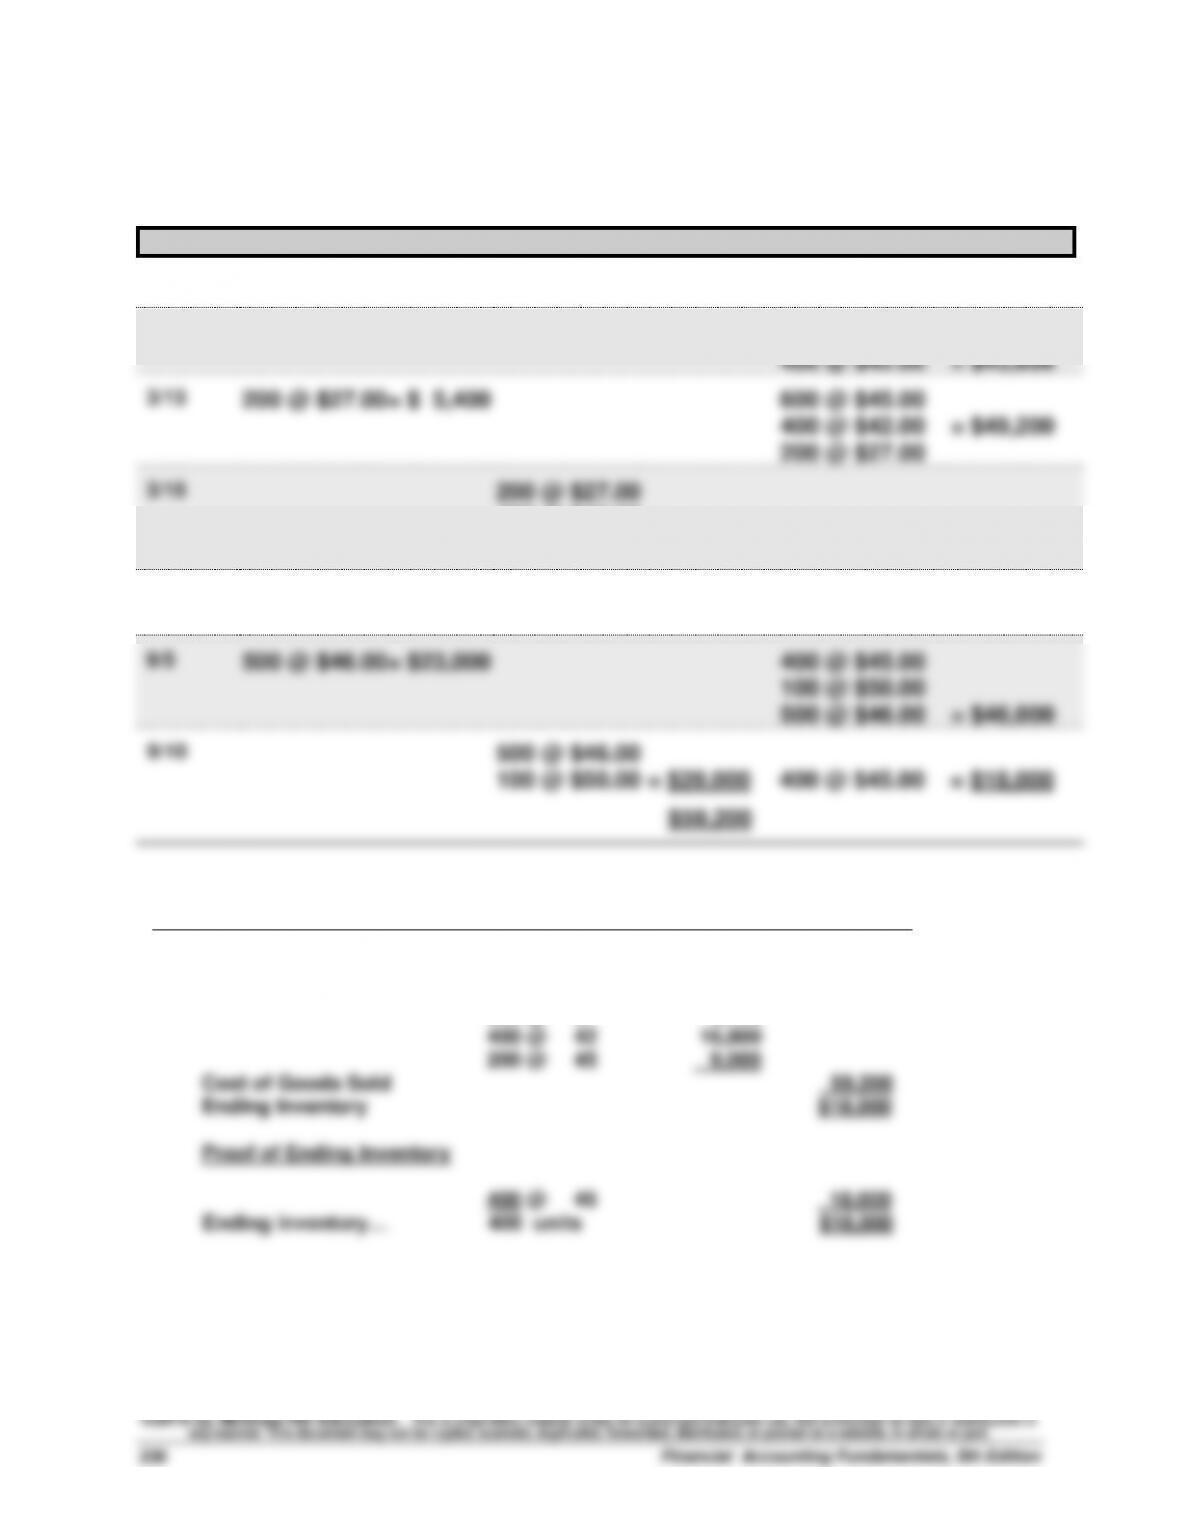
Problem 5-3A (Continued)
3b. LIFO perpetual
Date
Goods Purchased
Cost of Goods Sold
Inventory Balance
1/1
600 @ $45.00 = $27,000
2/10
400 @ $42.00= $16,800
600 @ $45.00
400 @ $42.00 = $43,800
3/13
200 @ $27.00= $ 5,400
600 @ $45.00
400 @ $42.00 = $49,200
200 @ $27.00
3/15
200 @ $27.00
400 @ $42.00
200 @ $45.00 = $31,200
400 @ $45.00 = $18,000
8/21
100 @ $50.00= $ 5,000
400 @ $45.00
100 @ $50.00 = $23,000
9/5
500 @ $46.00= $23,000
400 @ $45.00
100 @ $50.00
500 @ $46.00 = $46,000
9/10
500 @ $46.00
100 @ $50.00 = $28,000
400 @ $45.00 = $18,000
$59,200
LIFO alternate solution format
Cost of goods available for sale
$77,200
Less: Cost of sales
500 @ $46
$23,000
100 @ 50
5,000
200 @ 27
5,400
400 @ 42
16,800
200 @ 45
9,000
Cost of Goods Sold
59,200
Ending Inventory
$18,000
Proof of Ending Inventory
400 @ 45
18,000
Ending Inventory…
400 units
$18,000