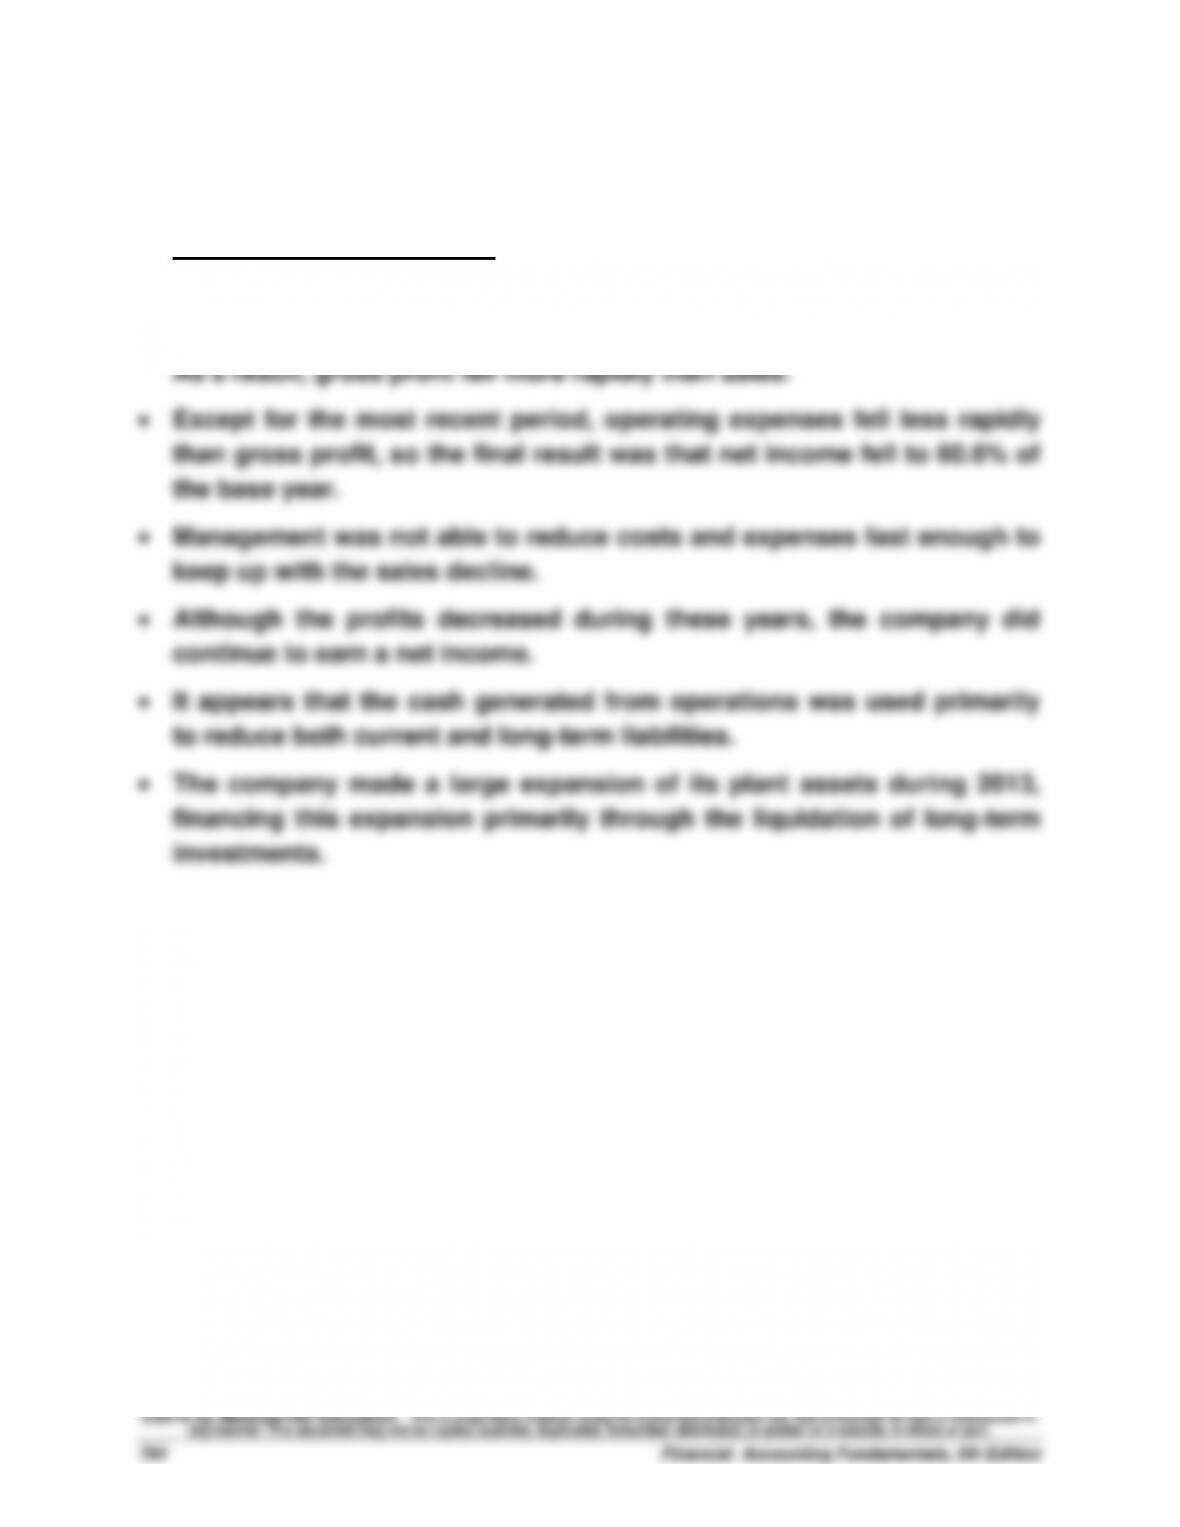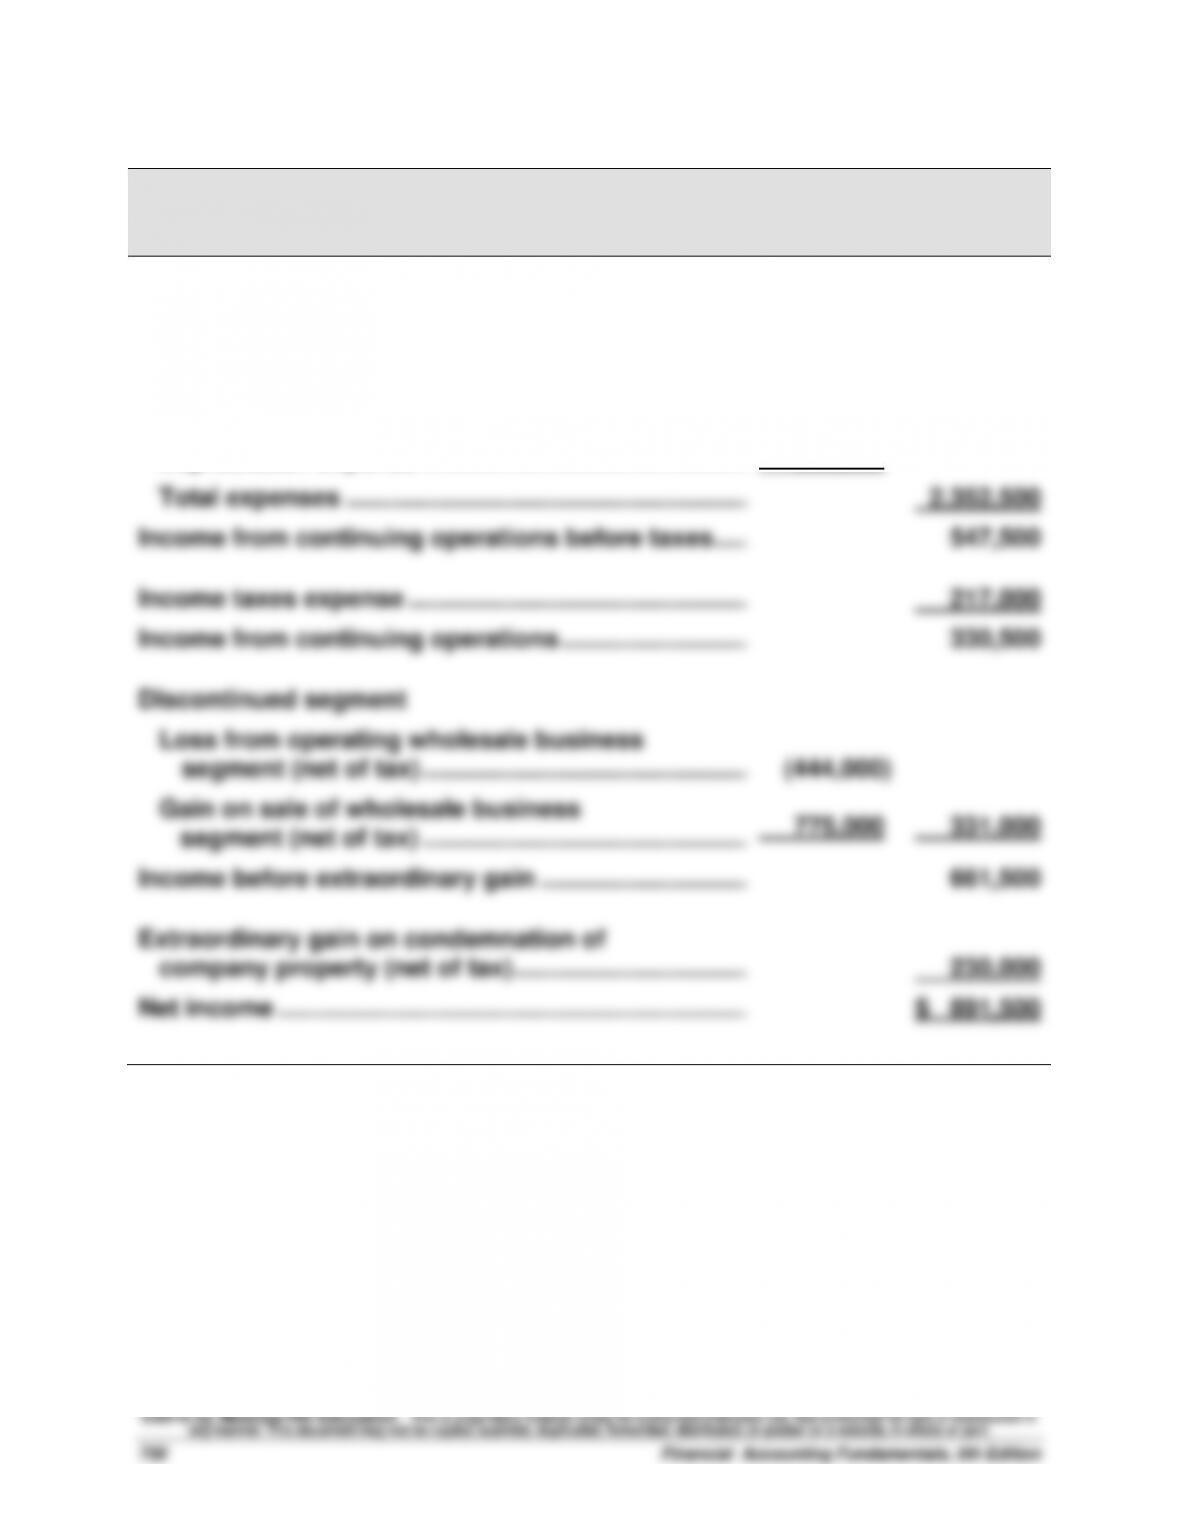
Exercise 13-14 (15 minutes)
RANDA MERCHANDISING, INC.
Income Statement
For Year Ended December 31, 2015
Net sales ………………………………………………………………..
$2,900,000
Expenses
Cost of goods sold ……………………………………………...
$1,480,000
Salaries expense ………………………………………………...
640,000
Depreciation expense ………………………………………....
232,500
Total expenses …………………………………………………...
2,352,500
Income from continuing operations before taxes …....
547,500
Income taxes expense …………………………………………...
217,000
Income from continuing operations ………………………..
330,500
Discontinued segment
Loss from operating wholesale business
segment (net of tax) ………………………………………....
(444,000)
Gain on sale of wholesale business
segment (net of tax) ………………………………………....
775,000
331,000
Income before extraordinary gain …………………………..
661,500
Extraordinary gain on condemnation of
company property (net of tax) ……………………………...
230,000
Net income …………………………………………………………....
$ 891,500
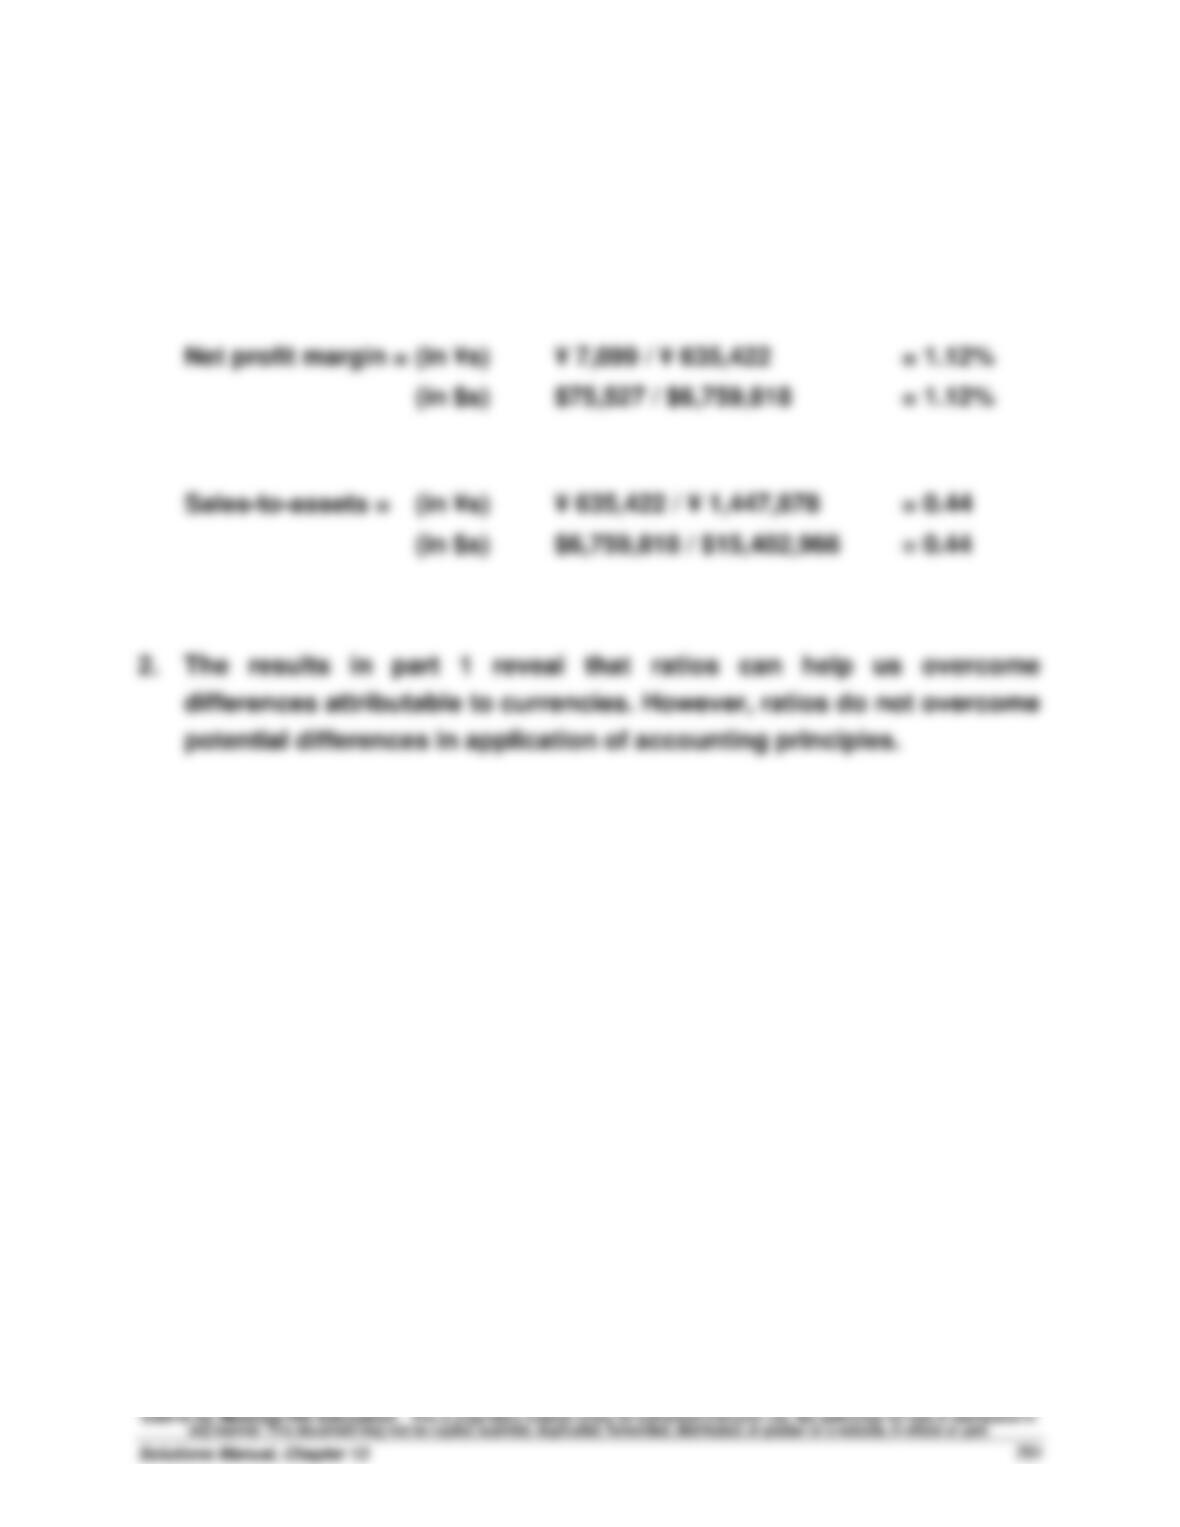
Exercise 13-15 (15 minutes)
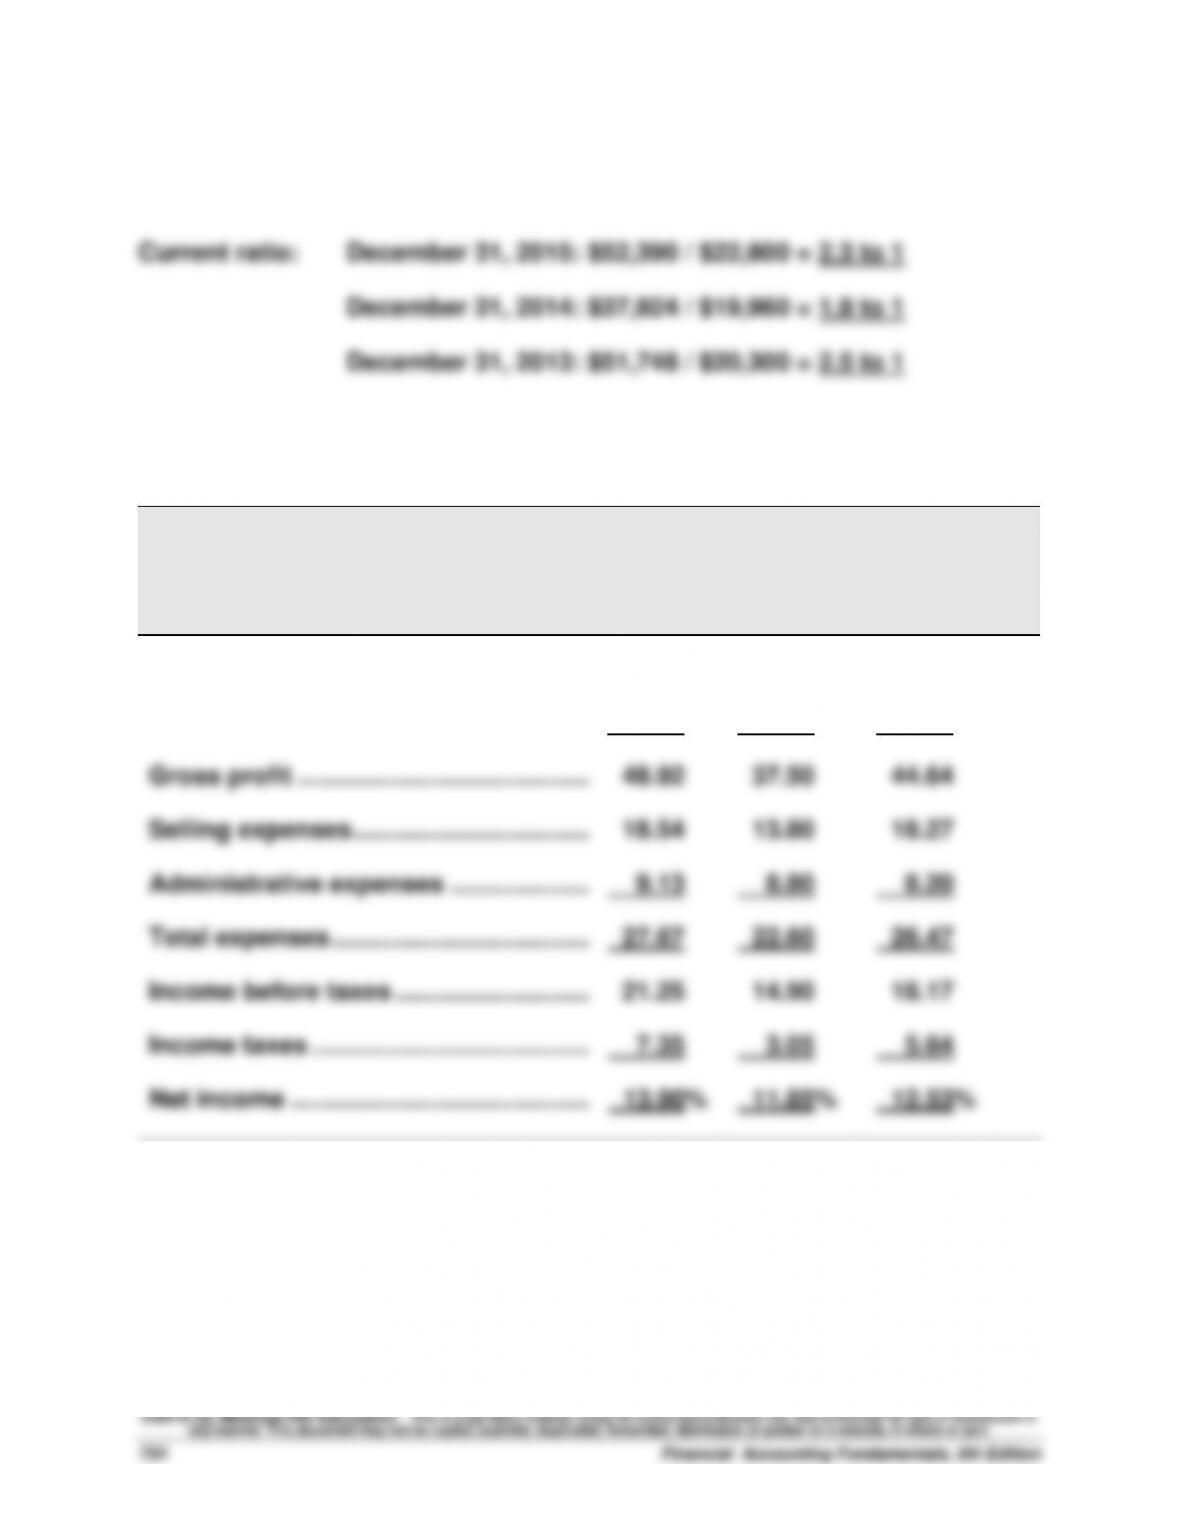
1. Current ratio = (in ¥s) ¥ 1,192,250 / ¥ 194,475 = 6.13
(in $s) $12,683,516 / $2,068,887 = 6.13
PROBLEM SET A
Problem 13-1A (120 minutes)
Part 1
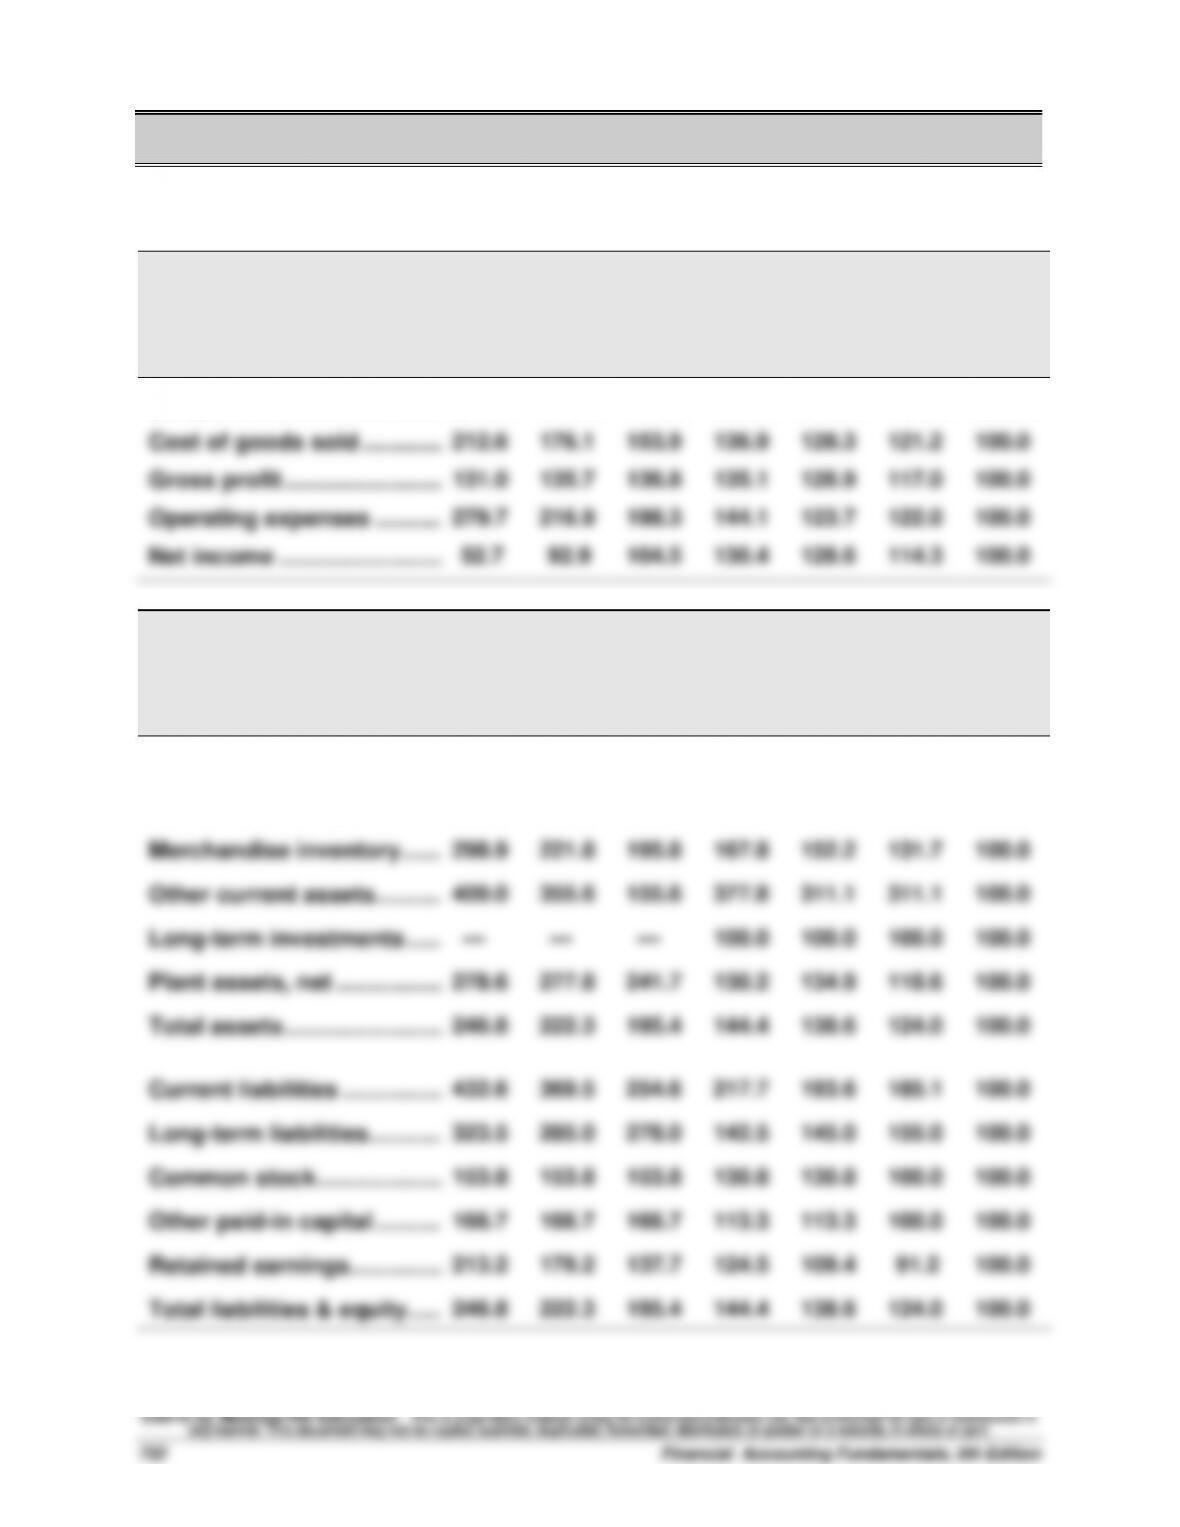
HAROUN COMPANY
Income Statement Trends
For Years Ended December 31, 2015-2009
2015
2014
2013
2012
2011
2010
2009
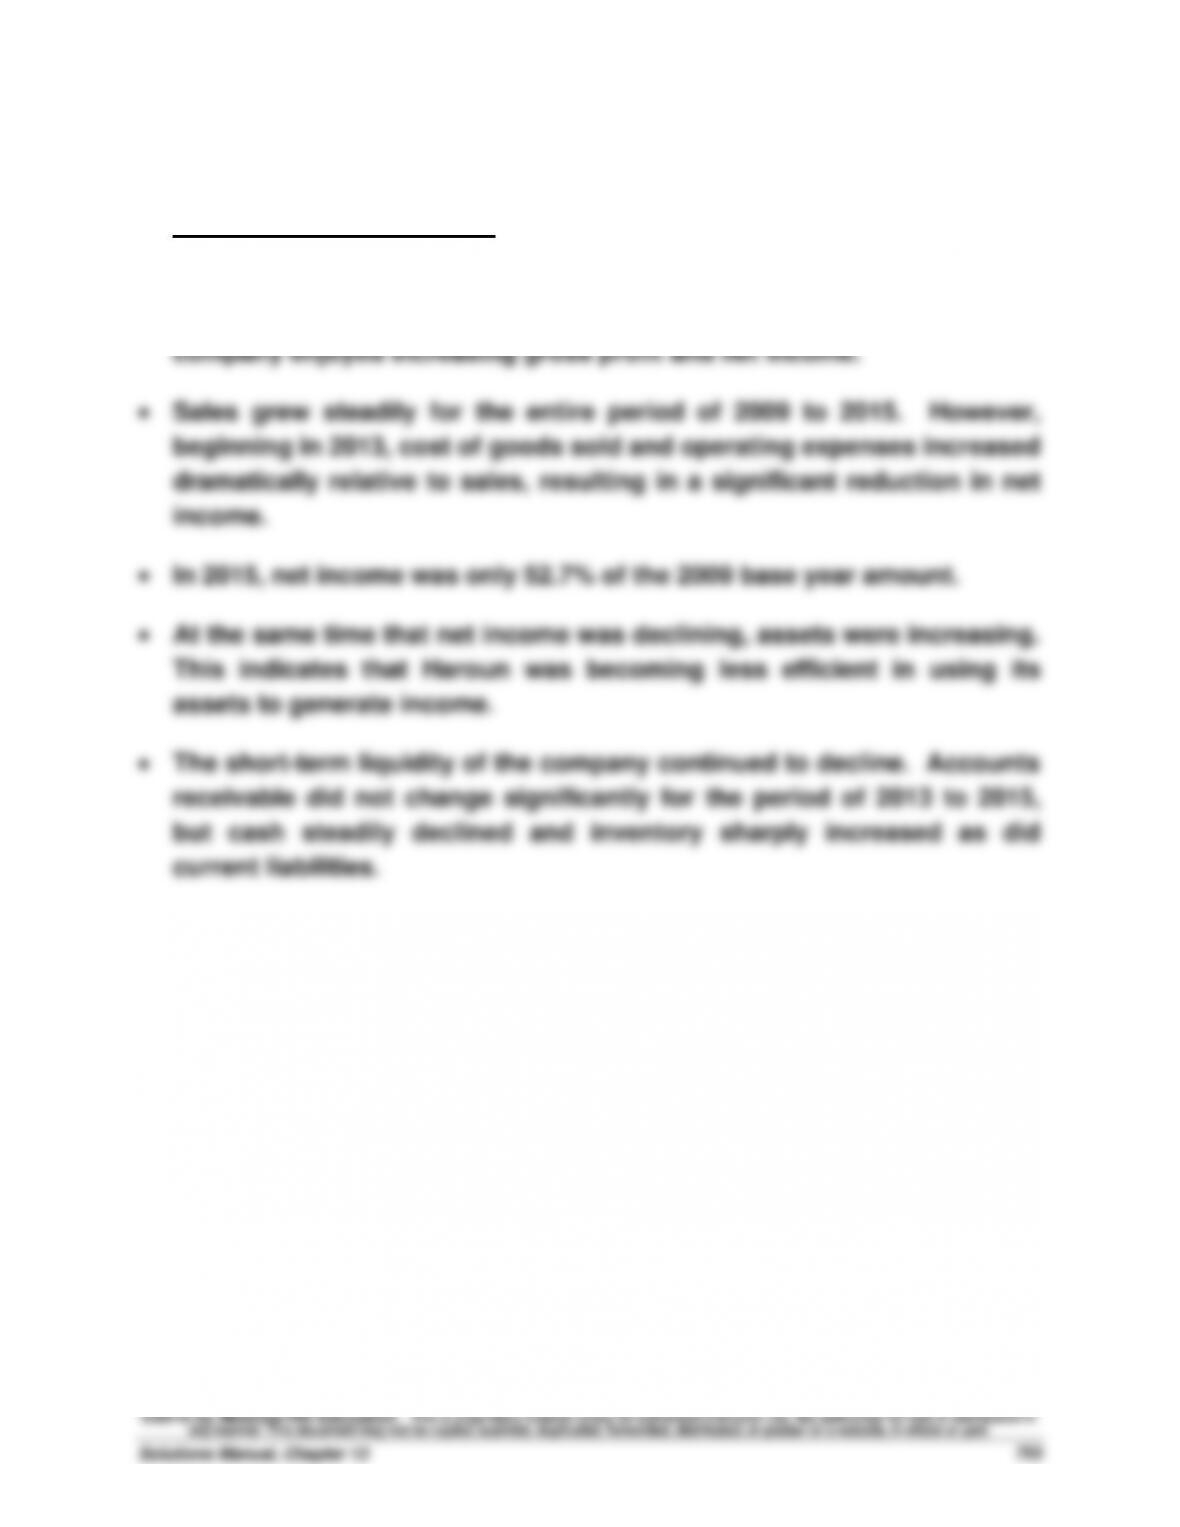
Sales ……………………………….
182.5%
161.2%
147.6%
136.2%
127.8%
119.6%
100.0%
Cost of goods sold …………..
212.6
176.1
153.9
136.9
128.3
121.2
100.0
Gross profit ……………………..
131.0
135.7
136.8
135.1
126.9
117.0
100.0
Operating expenses ………...
279.7
216.9
198.3
144.1
123.7
122.0
100.0
Net income ……………………...
52.7
92.9
104.5
130.4
128.6
114.3
100.0
HAROUN COMPANY
Balance Sheet Trends
December 31, 2015-2009
2015
2014
2013
2012
2011
2010
2009
Cash ………………………………..
65.2%
87.6%
92.1%
94.4%
98.9%
96.6%
100.0%
Accounts recble., net ……….
226.9
238.0
215.7
166.7
147.2
139.8
100.0
Merchandise inventory ……..
298.9
221.8
195.8
167.8
152.2
131.7
100.0
Other current assets ………...
400.0
355.6
155.6
377.8
311.1
311.1
100.0
Long-term investments …….
—
—
—
100.0
100.0
100.0
100.0
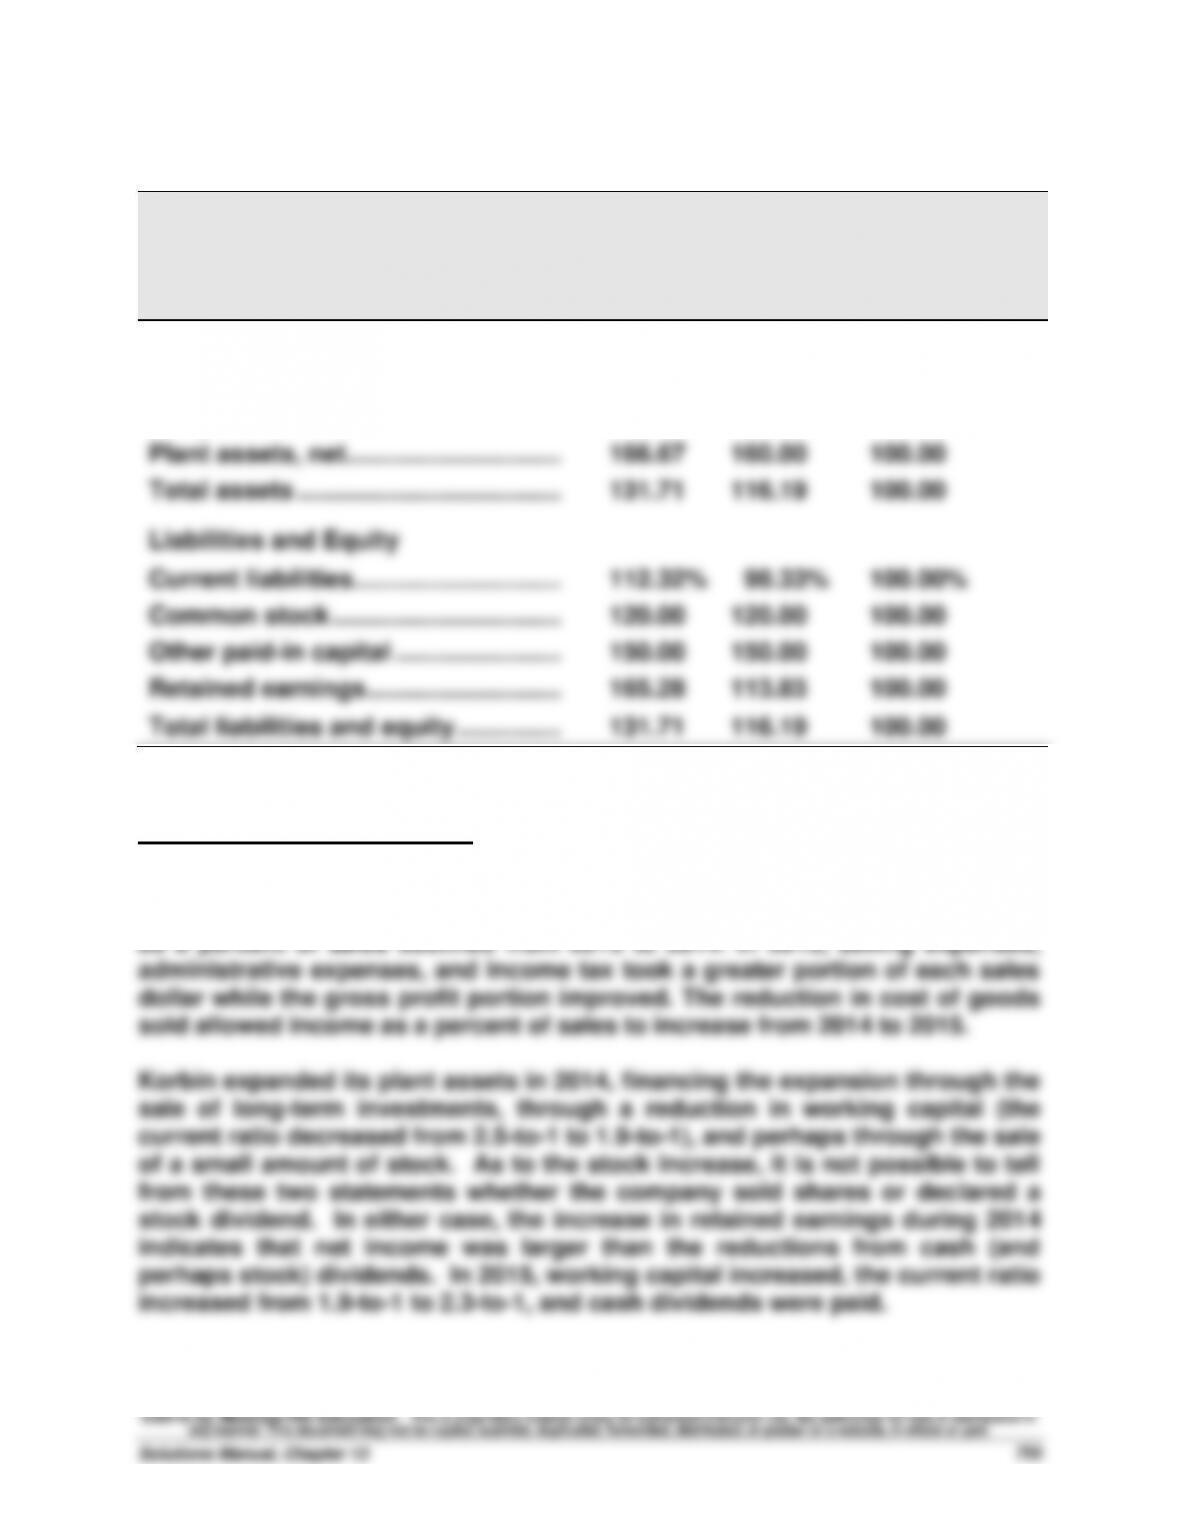
Plant assets, net ……………...
278.6
277.8
241.7
130.2
134.9
118.6
100.0
Total assets ……………………..
246.8
222.3
195.4
144.4
138.6
124.0
100.0
Current liabilities ……………..
432.6
369.5
254.6
217.7
193.6
185.1
100.0
Long-term liabilities ………….
323.5
285.0
278.0
142.5
145.0
155.0
100.0
Common stock ………………...
153.8
153.8
153.8
130.8
130.8
100.0
100.0
Other paid-in capital ………...
166.7
166.7
166.7
113.3
113.3
100.0
100.0
Retained earnings…………….
213.2
179.2
137.7
124.5
109.4
91.2
100.0
Total liabilities & equity …….
246.8
222.3
195.4
144.4
138.6
124.0
100.0
Problem 13-2A (60 minutes)
Part 1
Part 2
KORBIN COMPANY
Common-Size Comparative Income Statements
For Years Ended December 31, 2015, 2014, and 2013
2015
2014
2013
Sales ……………………………………………………
100.00%
100.00%
100.00%
Cost of goods sold …………………………..
51.08
62.50
55.36
Gross profit …………………………………………
48.92
37.50
44.64
Selling expenses …………………………….……
18.54
13.80
18.27
Administrative expenses ………………..……
9.13
8.80
8.20
Total expenses ……………………………….……
27.67
22.60
26.47
Income before taxes ……………………….….
21.25
14.90
18.17
Income taxes ………………………………….……
7.35
3.05
5.64
Net income …………………………………….……
13.90%
11.85%
12.53%
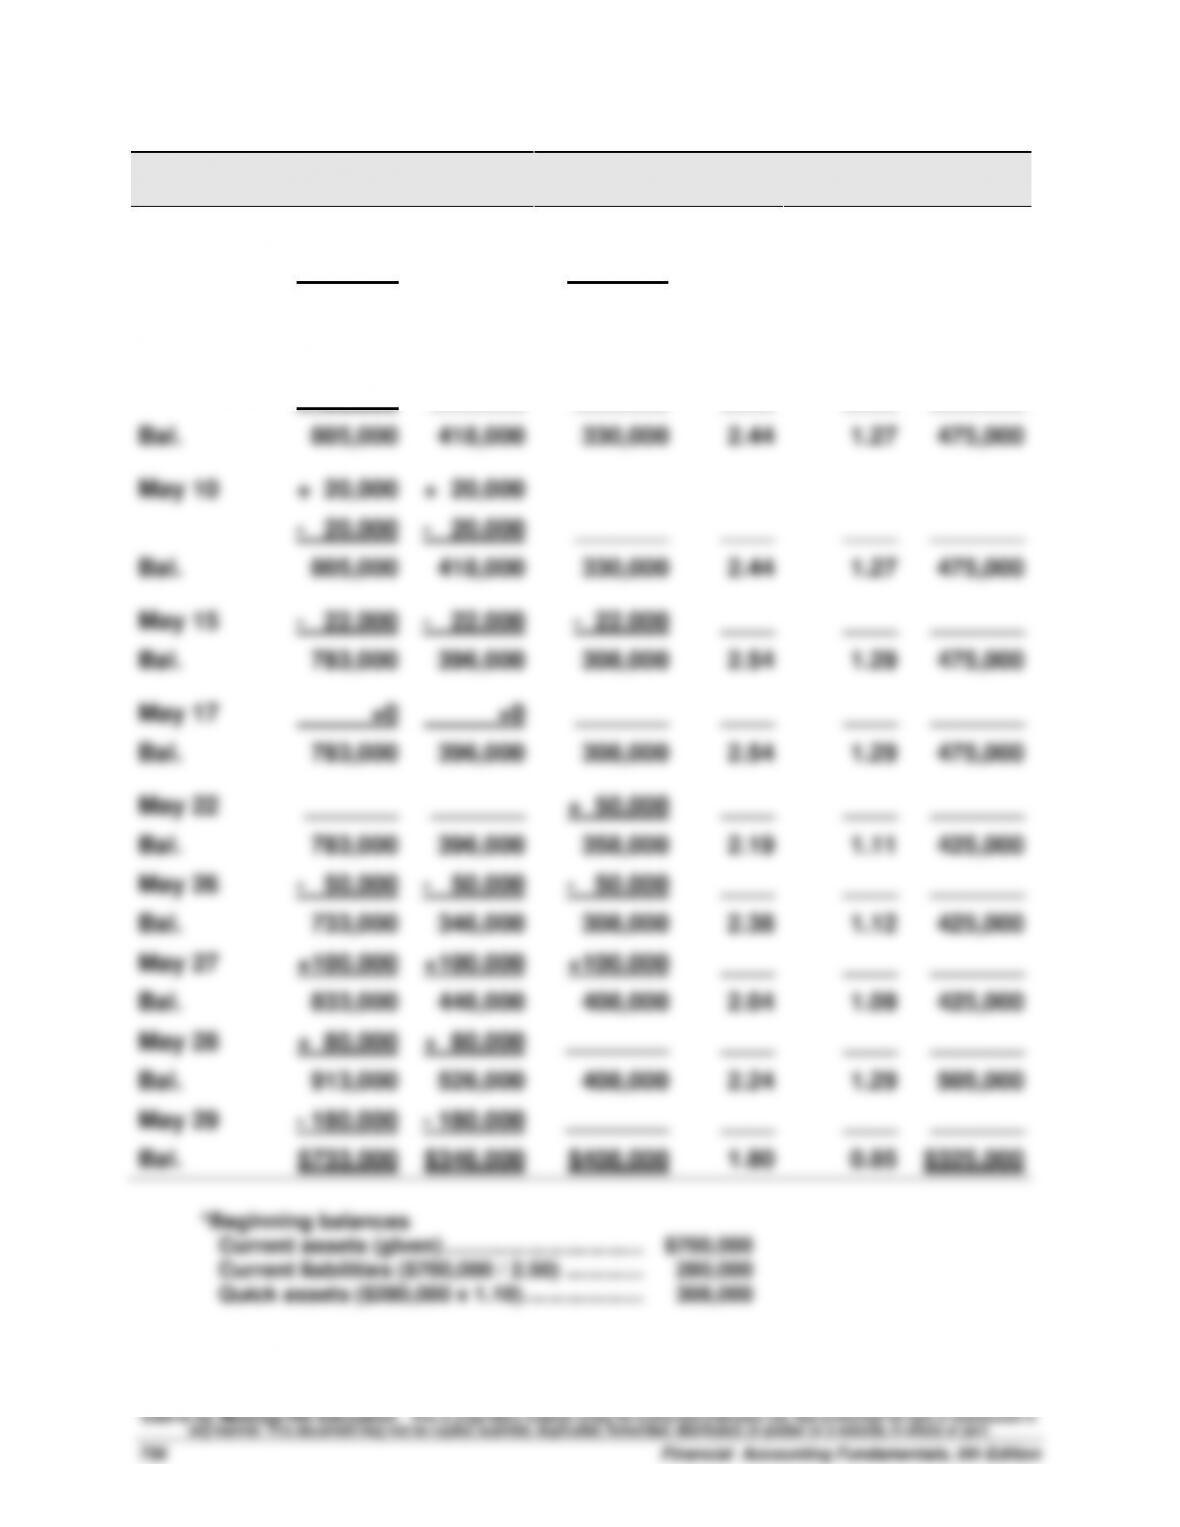
Problem 13-3A (60 minutes)
Trans-
action
Current
Assets
Quick
Assets
Current
Liabilities
Current
Ratio
Acid-Test
Ratio
Working
Capital
Beginning*
$700,000
$308,000
$280,000
2.50
1.10
$420,000
May 2
+ 50,000
_______
+ 50,000
____
____
_______
Bal.
750,000
308,000
330,000
2.27
0.93
420,000
May 8
+110,000
+110,000
– 55,000
_______
_______
____
____
_______
Bal.
805,000
418,000
330,000
2.44
1.27
475,000
May 10
+ 20,000
+ 20,000
– 20,000
– 20,000
_______
____
____
_______
Bal.
805,000
418,000
330,000
2.44
1.27
475,000
May 15
– 22,000
– 22,000
– 22,000
____
____
_______
Bal.
783,000
396,000
308,000
2.54
1.29
475,000
May 17
+0
+0
_______
____
____
_______
Bal.
783,000
396,000
308,000
2.54
1.29
475,000
May 22
_______
_______
+ 50,000
____
____
_______
Bal.
783,000
396,000
358,000
2.19
1.11
425,000
May 26
– 50,000
– 50,000
– 50,000
____
____
_______
Bal.
733,000
346,000
308,000
2.38
1.12
425,000
May 27
+100,000
+100,000
+100,000
____
____
_______
Bal.
833,000
446,000
408,000
2.04
1.09
425,000
May 28
+ 80,000
+ 80,000
________
____
____
_______
Bal.
913,000
526,000
408,000
2.24
1.29
505,000
May 29
– 180,000
– 180,000
________
____
____
_______
Bal.
$733,000
$346,000
$408,000
1.80
0.85
$325,000
Problem 13-4A (50 minutes)
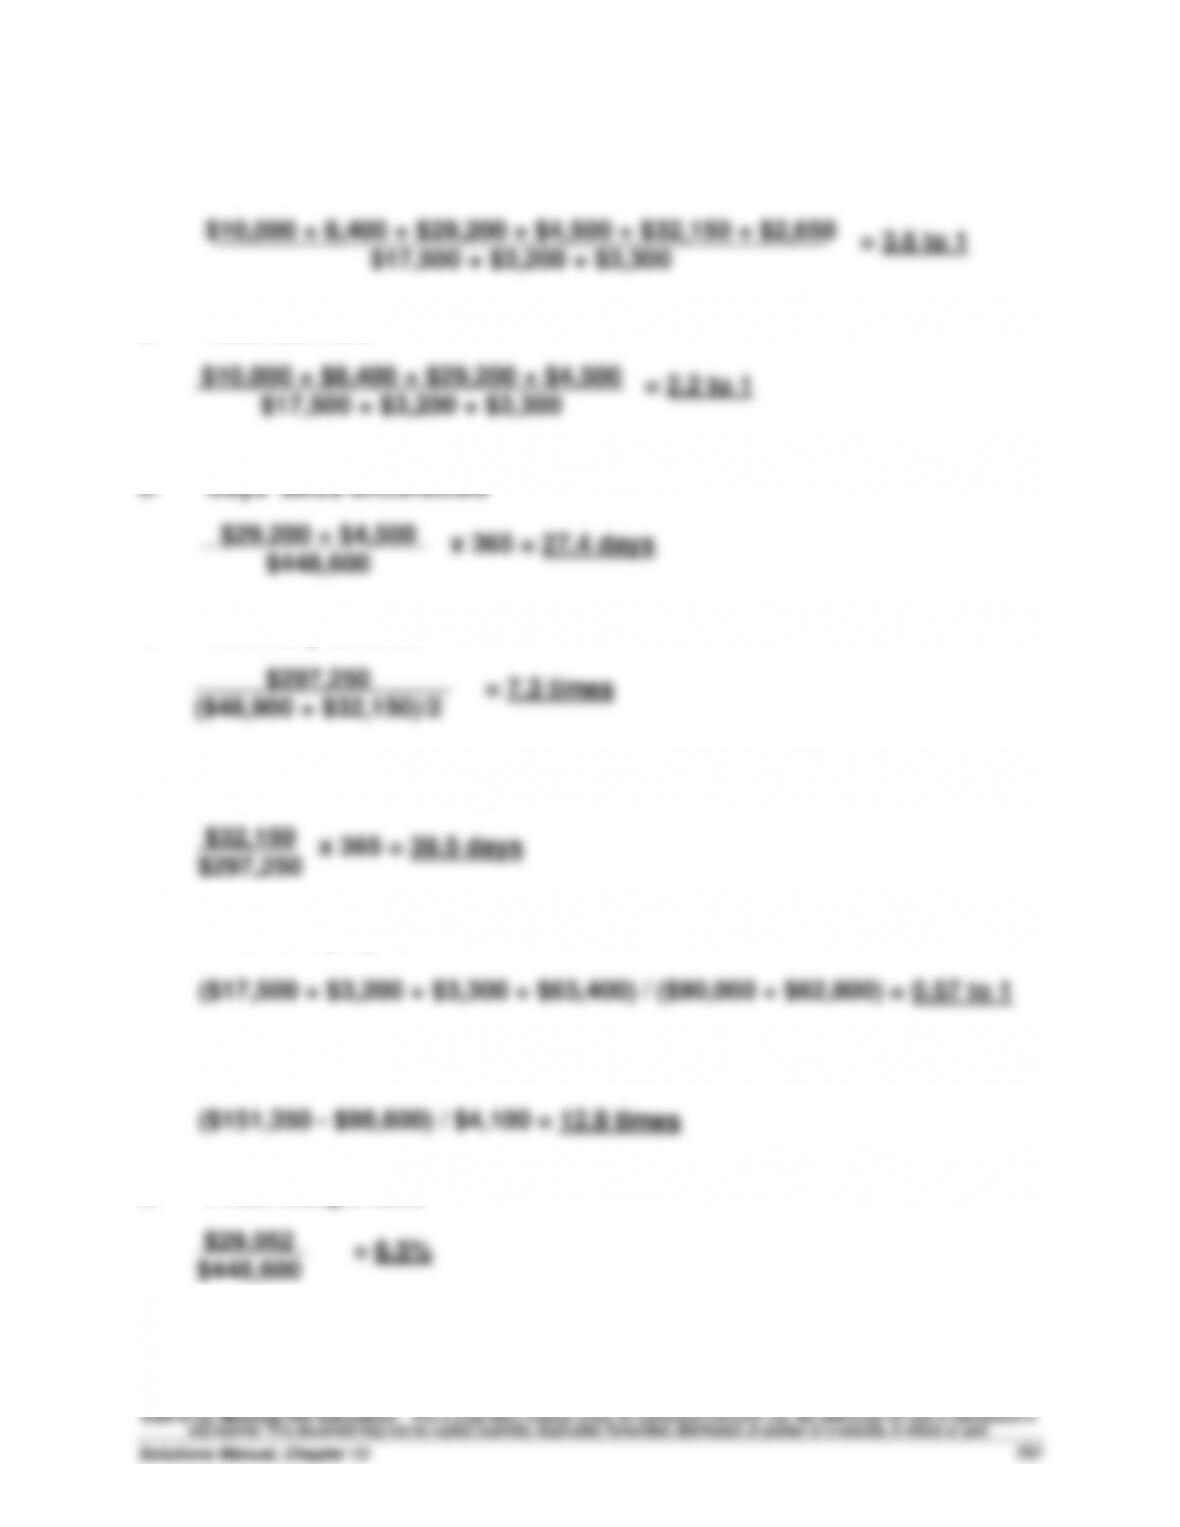
1. Current ratio
2. Acid-test ratio
4. Inventory turnover
5. Days’ sales in inventory
6. Debt–to-equity ratio
7. Times interest earned
8. Profit margin ratio
$448,600
Problem 13-4A (Concluded)
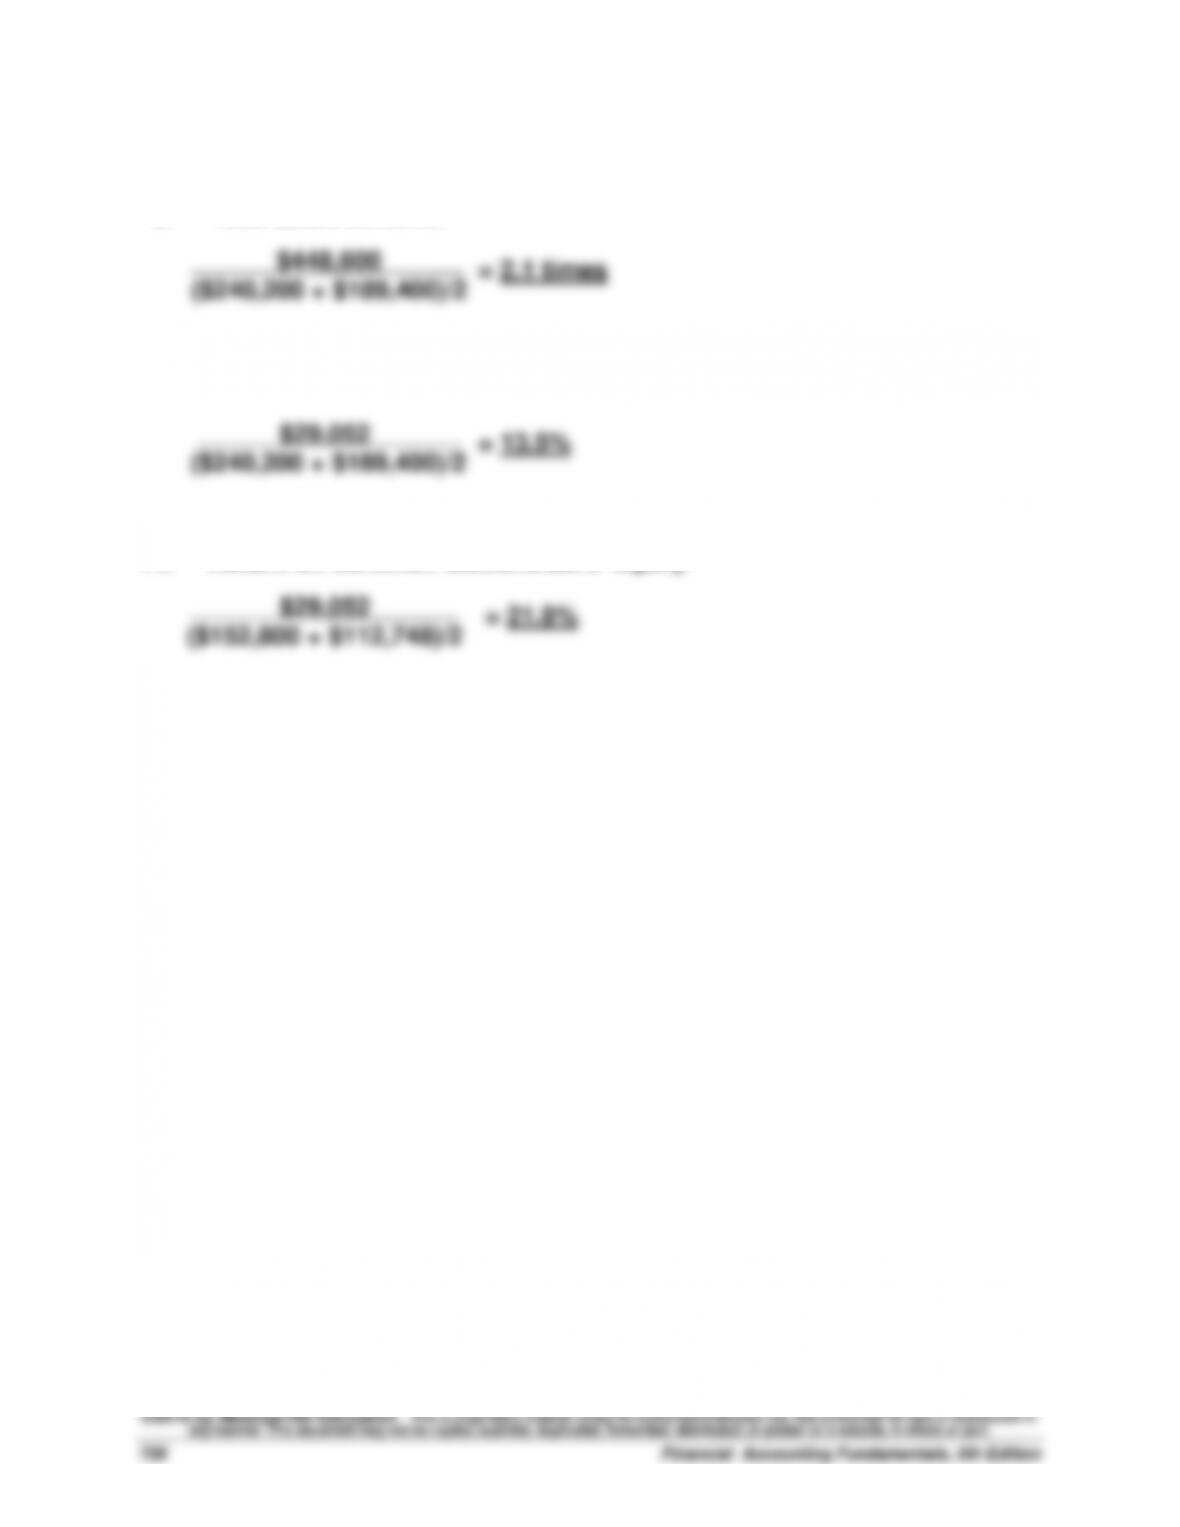
9. Total asset turnover
10. Return on total assets
11. Return on common stockholders’ equity
Problem 13–5A (Concluded)
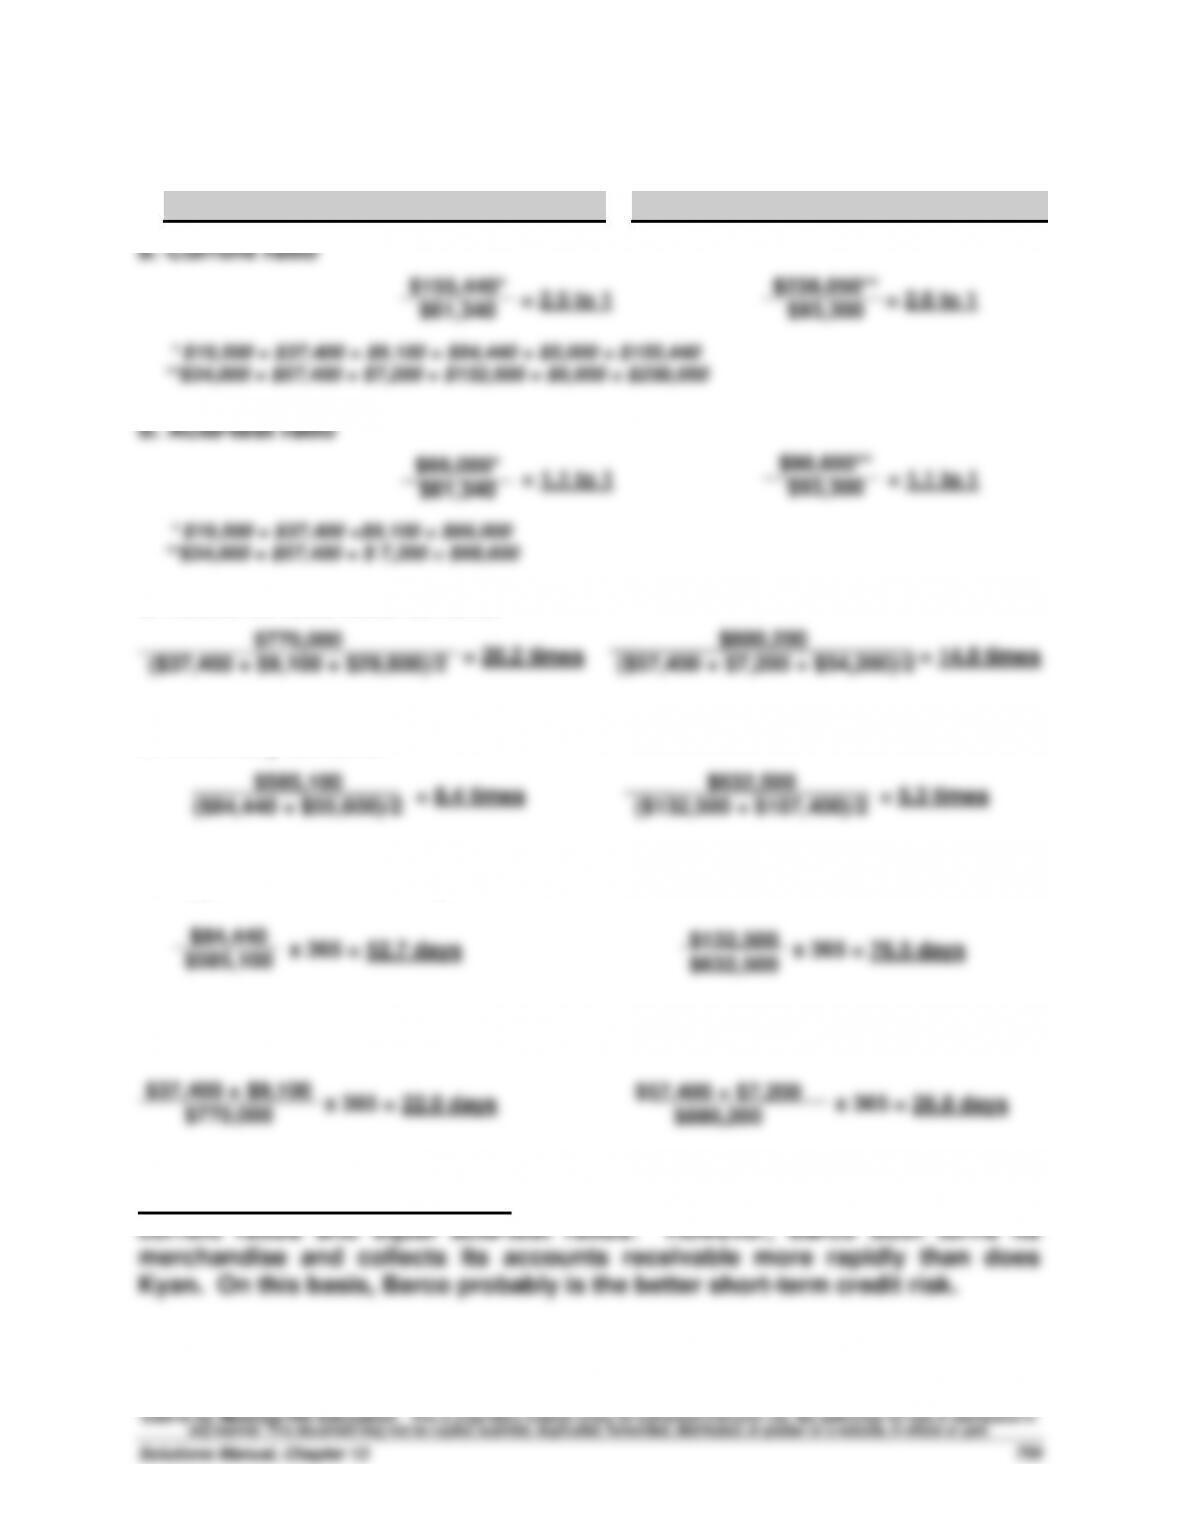
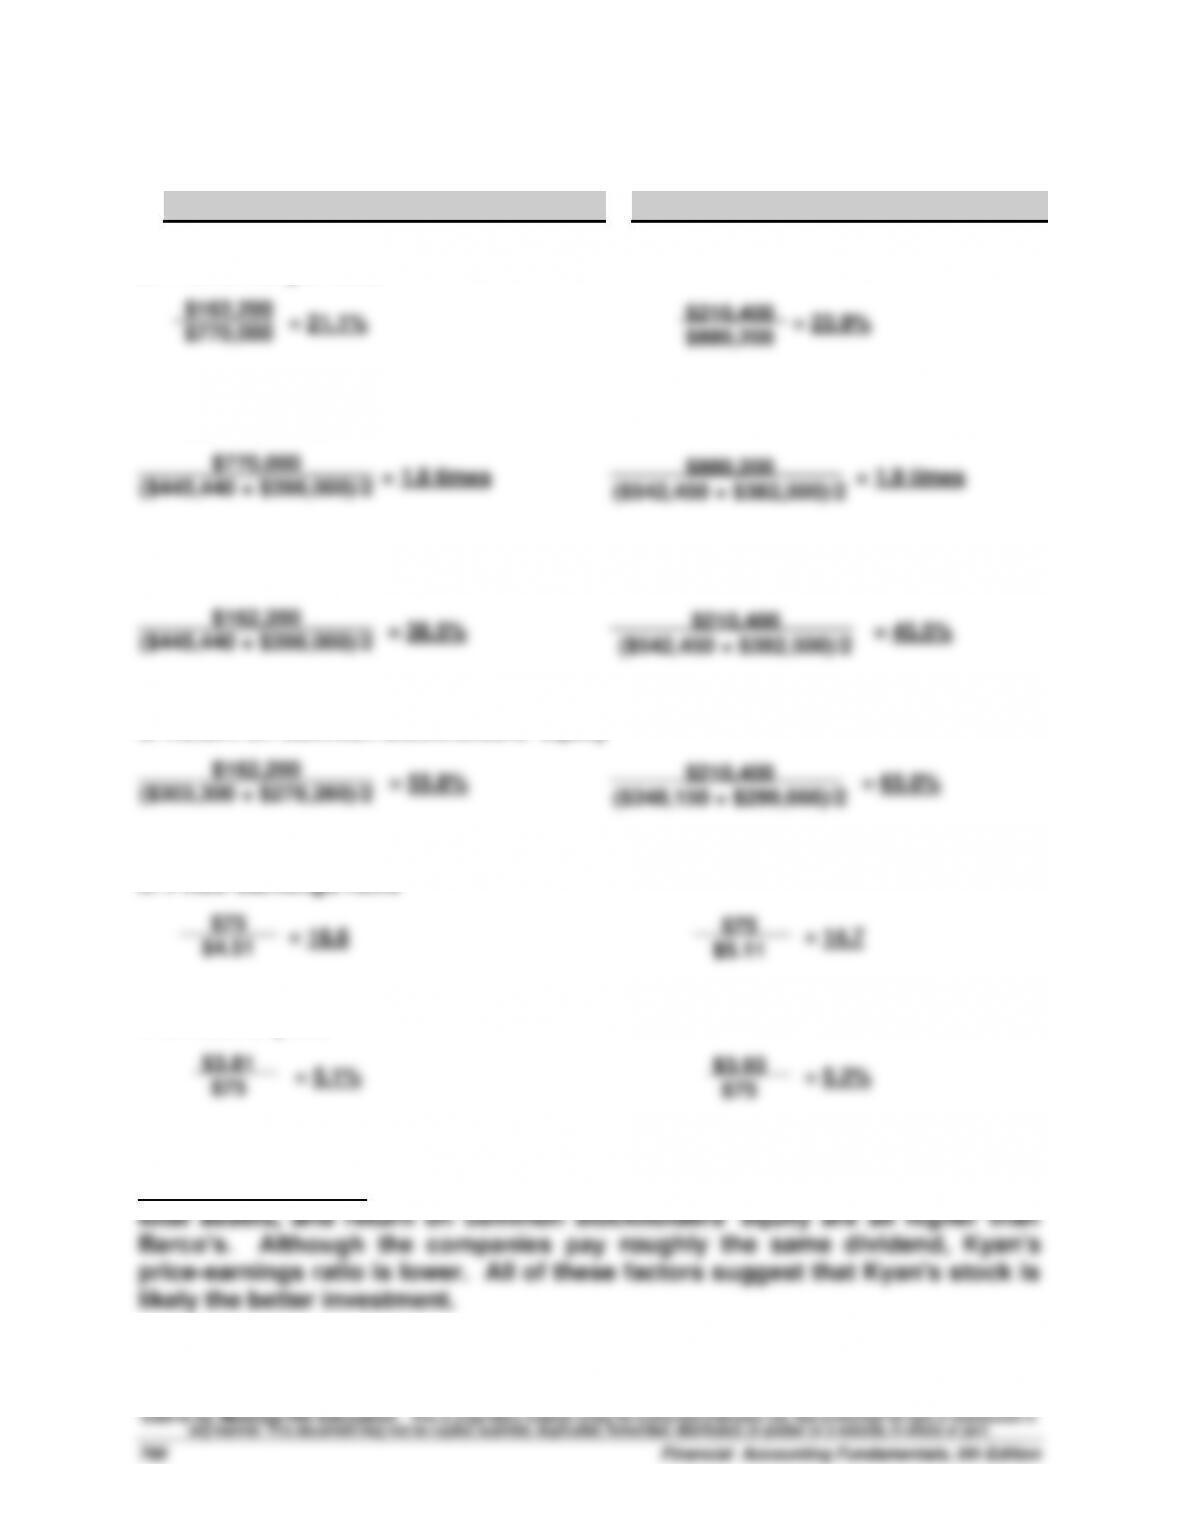
Part 2
Barco Company
Kyan Company
a. Profit margin ratio
b. Total asset turnover
c. Return on total assets
d. Return on common stockholders’ equity
e. Price-earnings ratio
f. Dividend yield
Investment analysis: Kyan’s profit margin ratio, total asset turnover, return on
Problem 13–6AA (Concluded)
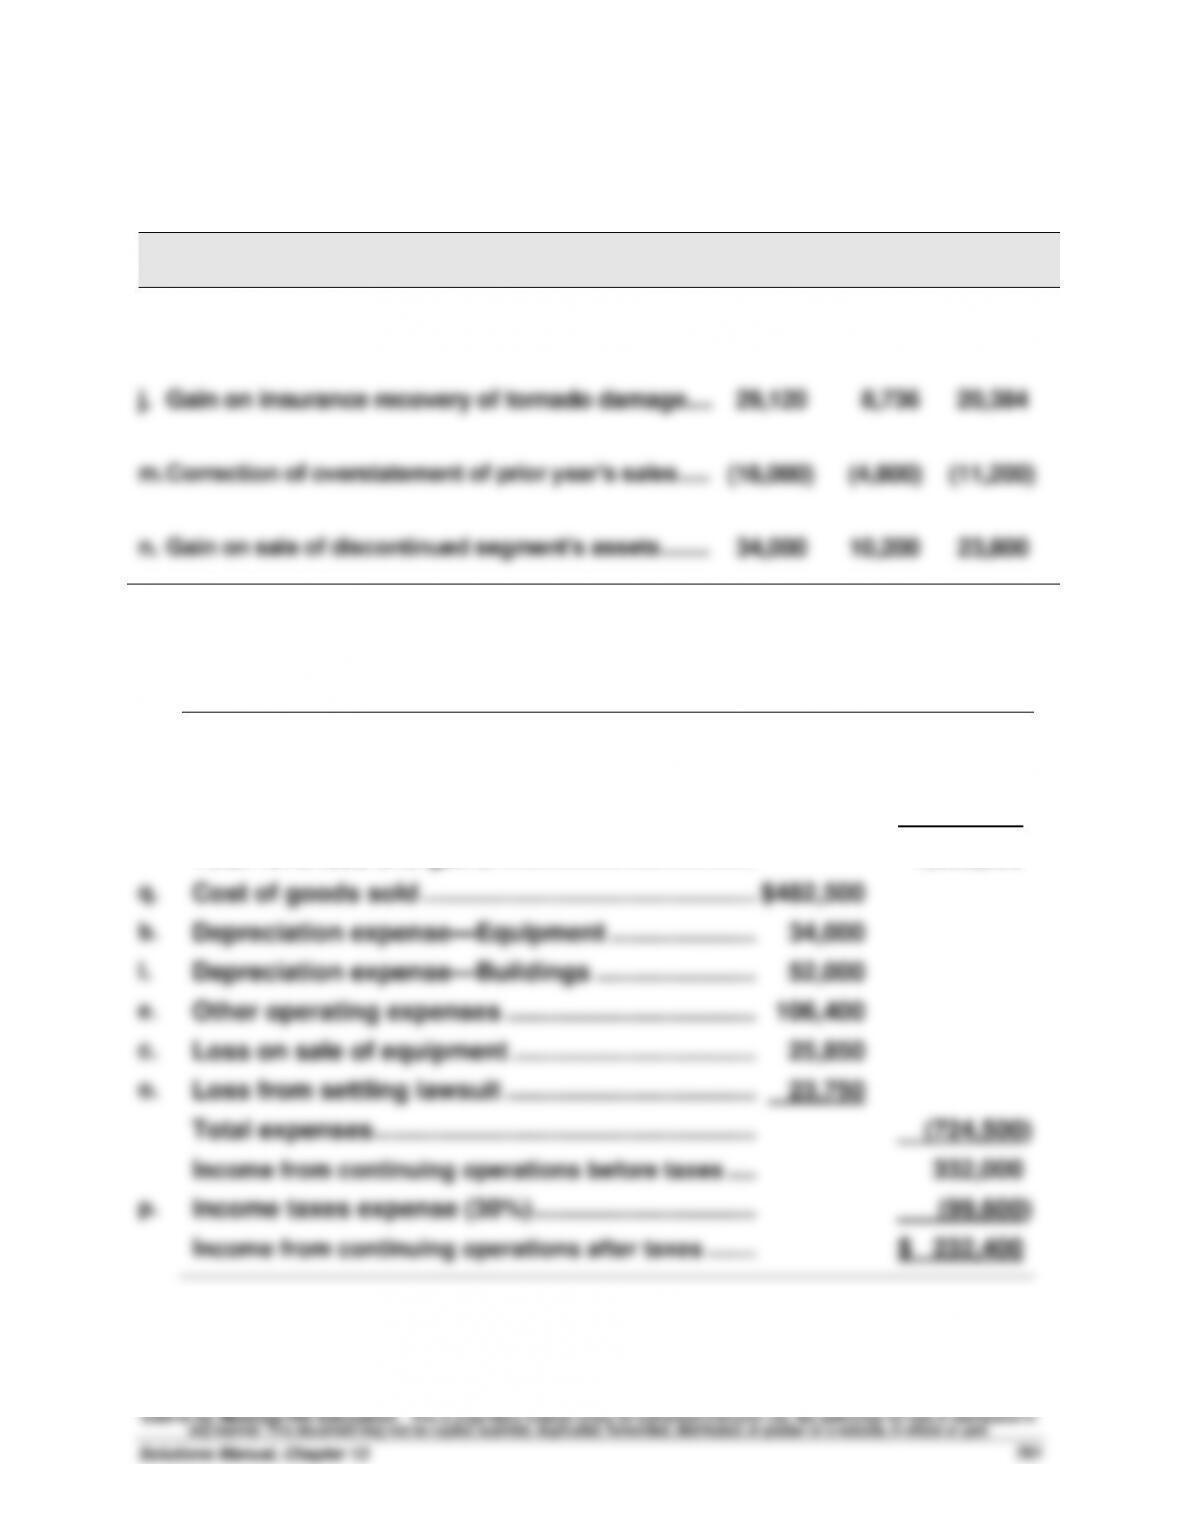
Part 3 Income from discontinued segment
i.
Loss from operating a discontinued
segment (after-tax) …………………………………………………….…
$ (12,775)
n.
Gain on sale of discontinued segment’s
assets (after-tax) ……………………………………………………….
23,800
Income from discontinued segment ……………………………..…………………..
$ 11,025
Part 4 Income before extraordinary items
Income from continuing oper. after taxes (from Part 2) …………………………..
$232,400
Income from discontinued segment (from Part 3) …………………………..
11,025
Income before extraordinary items ……………………………….…………………..
$243,425
Part 5 Net income
Income before extraordinary items ……………………………….…………………..
$243,425
j.
Extraordinary item
Gain on insurance recovery of tornado damage
(after-tax) ……………………………………………………………..…………………..
20,384
Net income …………………………..……………………………………………………….
$263,809
PROBLEM SET B
Problem 13-1B (120 minutes)
Part 1
TRIPOLY COMPANY
Income Statement Trends
For Years Ended December 31, 2015-2009
2015
2014
2013
2012
2011
2010
2009
Sales ……………………………….
65.1%
70.9%
73.3%
79.1%
86.0%
89.5%
100.0%
Cost of goods sold …………..
72.6
76.3
77.4
82.6
89.5
92.1
100.0
Gross profit ……………………..
59.2
66.7
70.0
76.3
83.3
87.5
100.0
Operating expenses ………...
56.0
69.3
74.7
84.0
93.3
96.0
100.0
Net income ……………………...
60.6
65.5
67.9
72.7
78.8
83.6
100.0
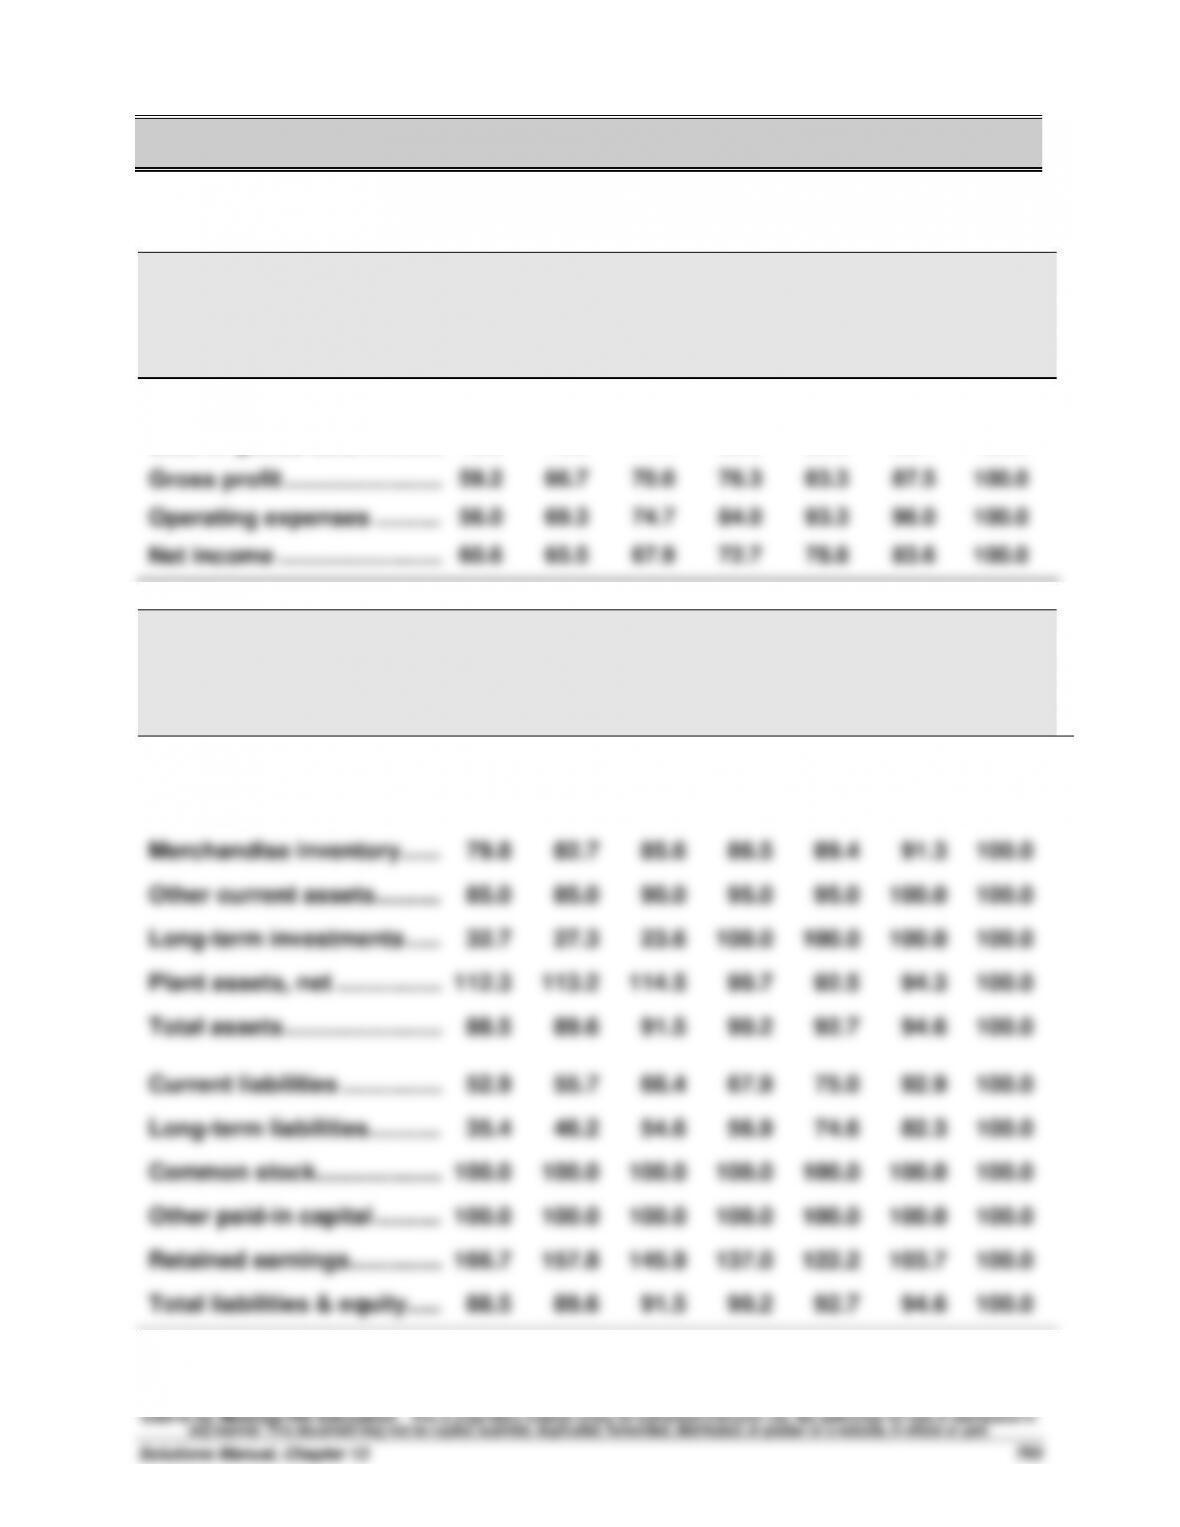
TRIPOLY COMPANY
Balance Sheet Trends
December 31, 2015-2009
2015
2014
2013
2012
2011
2010
2009
Cash ………………………………
64.7%
67.6%
76.5%
79.4%
88.2%
91.2%
100.0%
Accounts recble., net ……….
81.3
85.0
87.5
90.0
93.8
96.3
100.0
Merchandise inventory ……..
79.8
82.7
85.6
86.5
89.4
91.3
100.0
Other current assets ………...
85.0
85.0
90.0
95.0
95.0
100.0
100.0
Long-term investments …….
32.7
27.3
23.6
100.0
100.0
100.0
100.0
Plant assets, net ……………...
112.3
113.2
114.5
90.7
92.5
94.3
100.0
Total assets ……………………..
88.5
89.6
91.5
90.2
92.7
94.6
100.0
Current liabilities ……………..
52.9
55.7
66.4
67.9
75.0
92.9
100.0
Long-term liabilities ………….
35.4
46.2
54.6
56.9
74.6
82.3
100.0
Common stock ………………...
100.0
100.0
100.0
100.0
100.0
100.0
100.0
Other paid-in capital ………...
100.0
100.0
100.0
100.0
100.0
100.0
100.0
Retained earnings…………….
166.7
157.8
145.9
137.0
122.2
103.7
100.0
Total liabilities & equity …….
88.5
89.6
91.5
90.2
92.7
94.6
100.0