Reporting in Action — BTN C-1
1. Yes, Apple’s financial statements are consolidated. The statements are
labeled as “consolidated” in each of the financial statement headings.
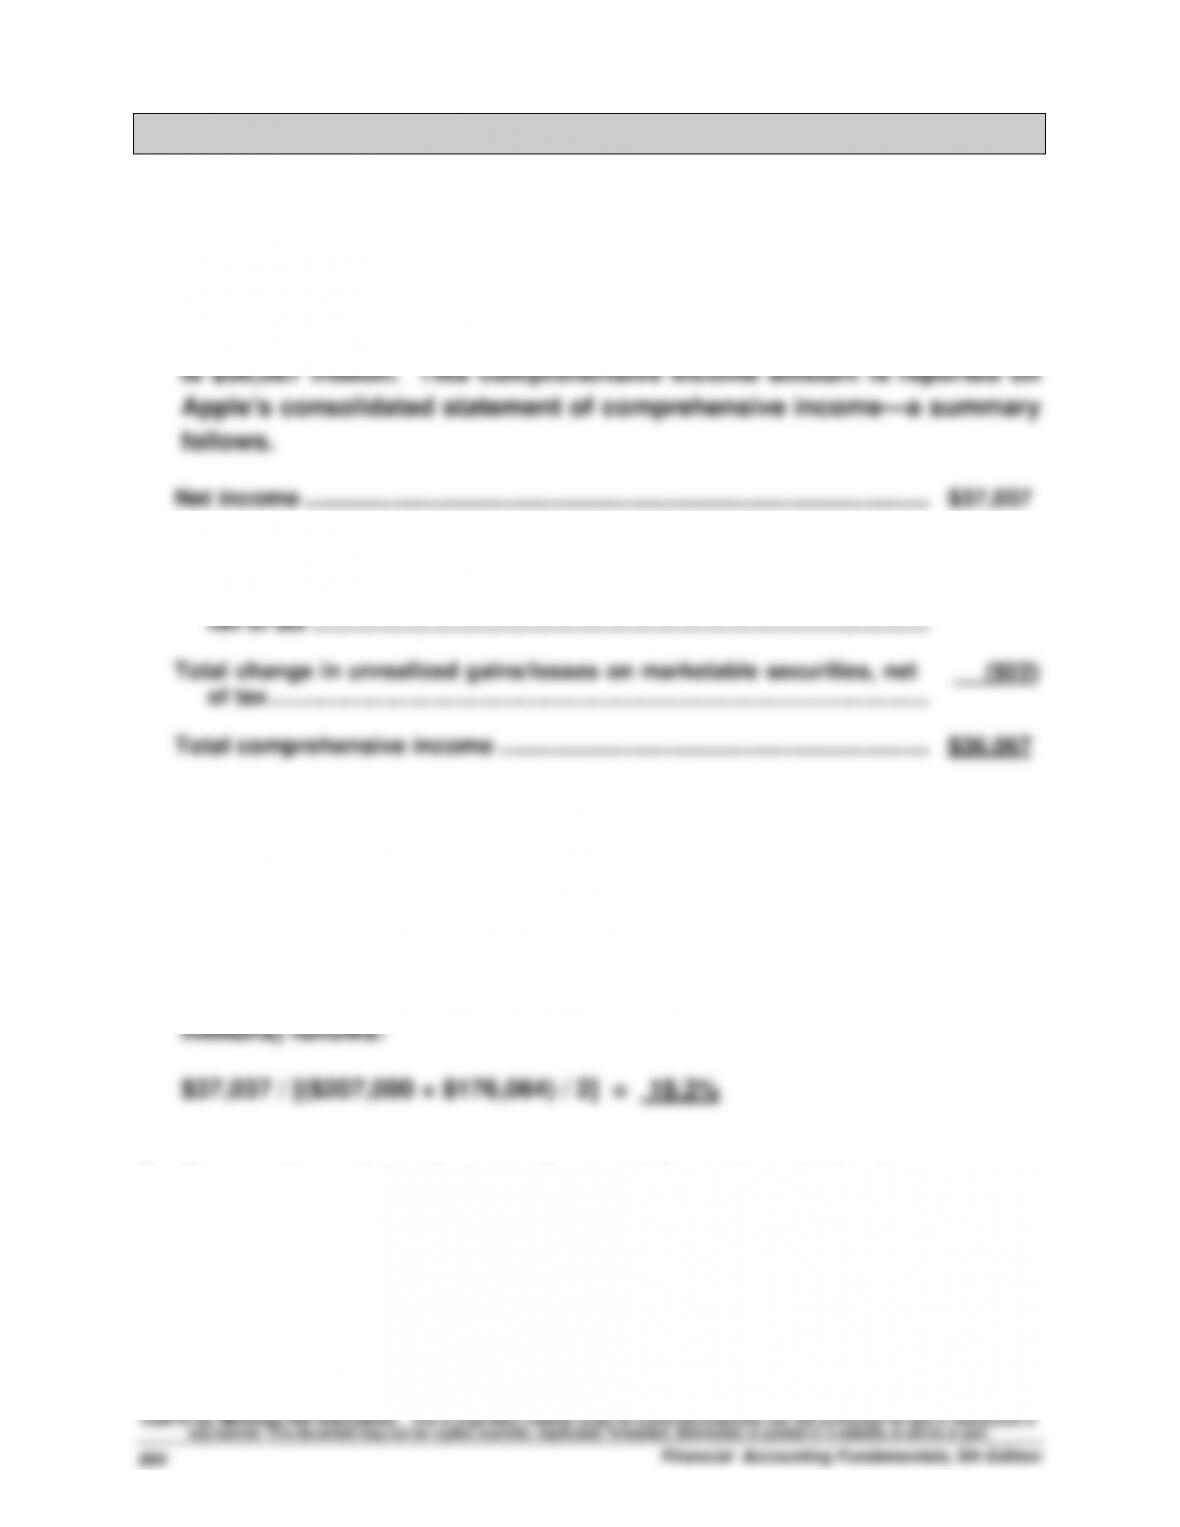
2. Apple’s comprehensive income for the year ended September 28, 2013,
Comparative Analysis — BTN C-2
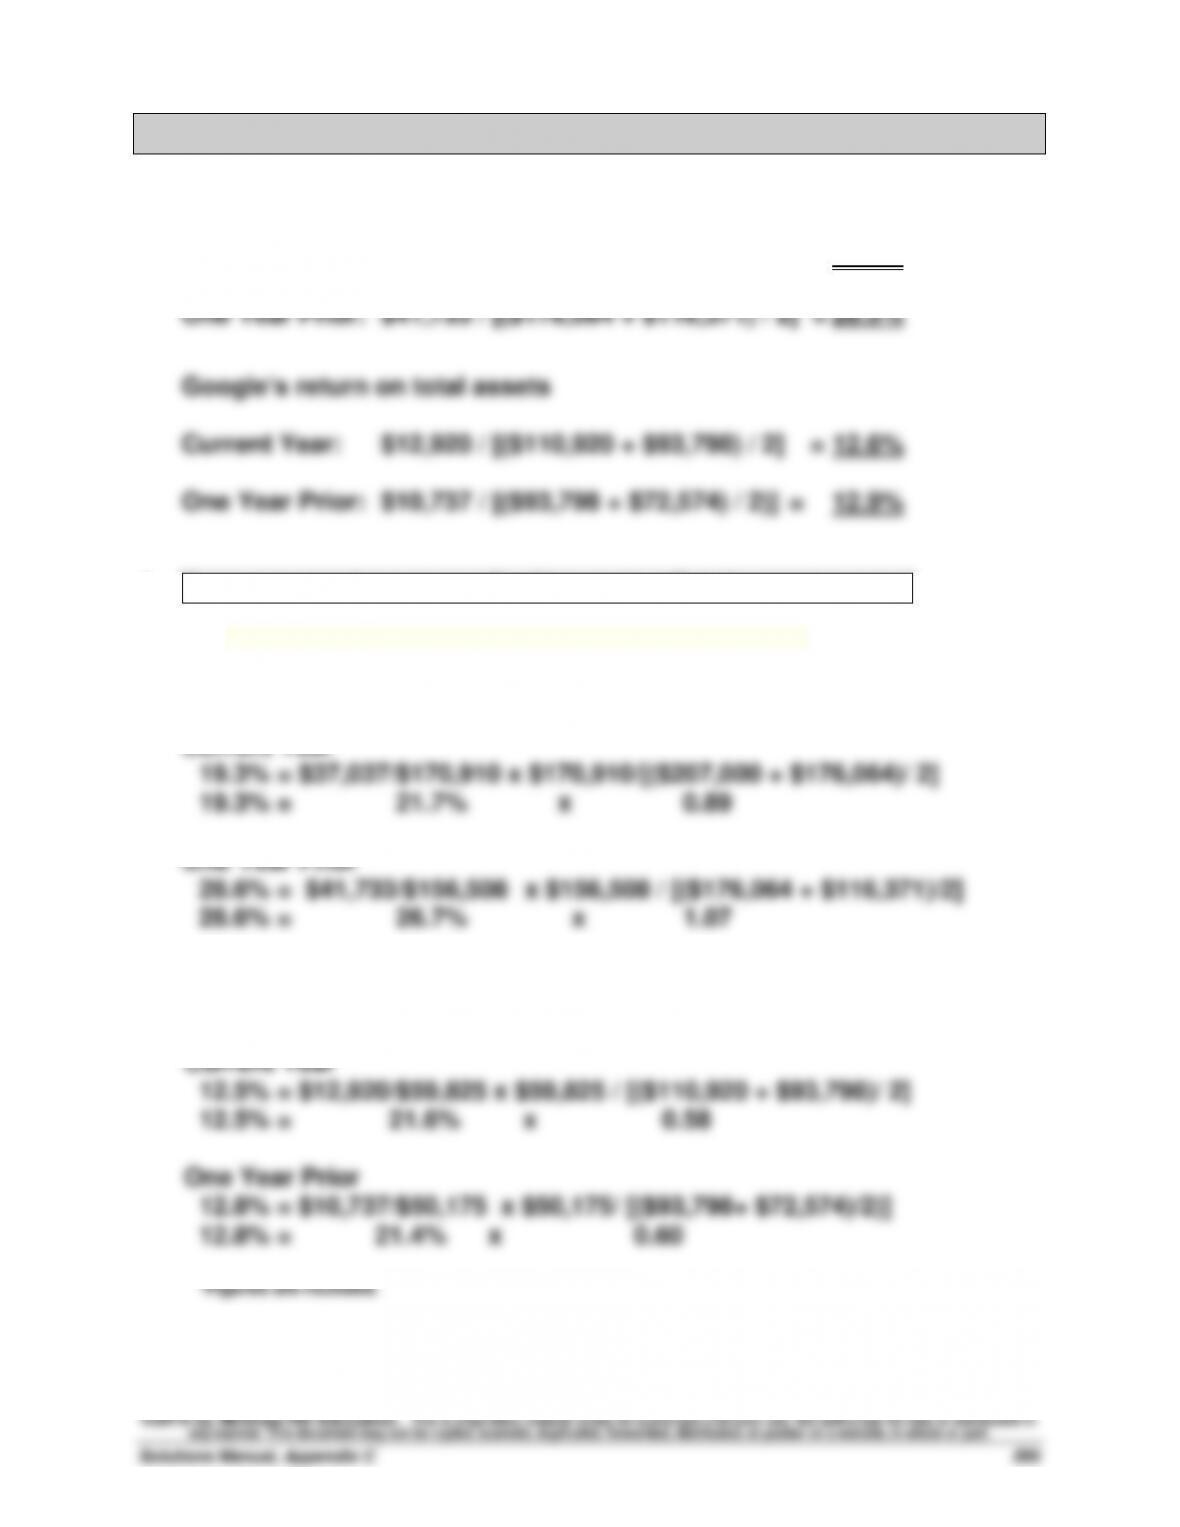
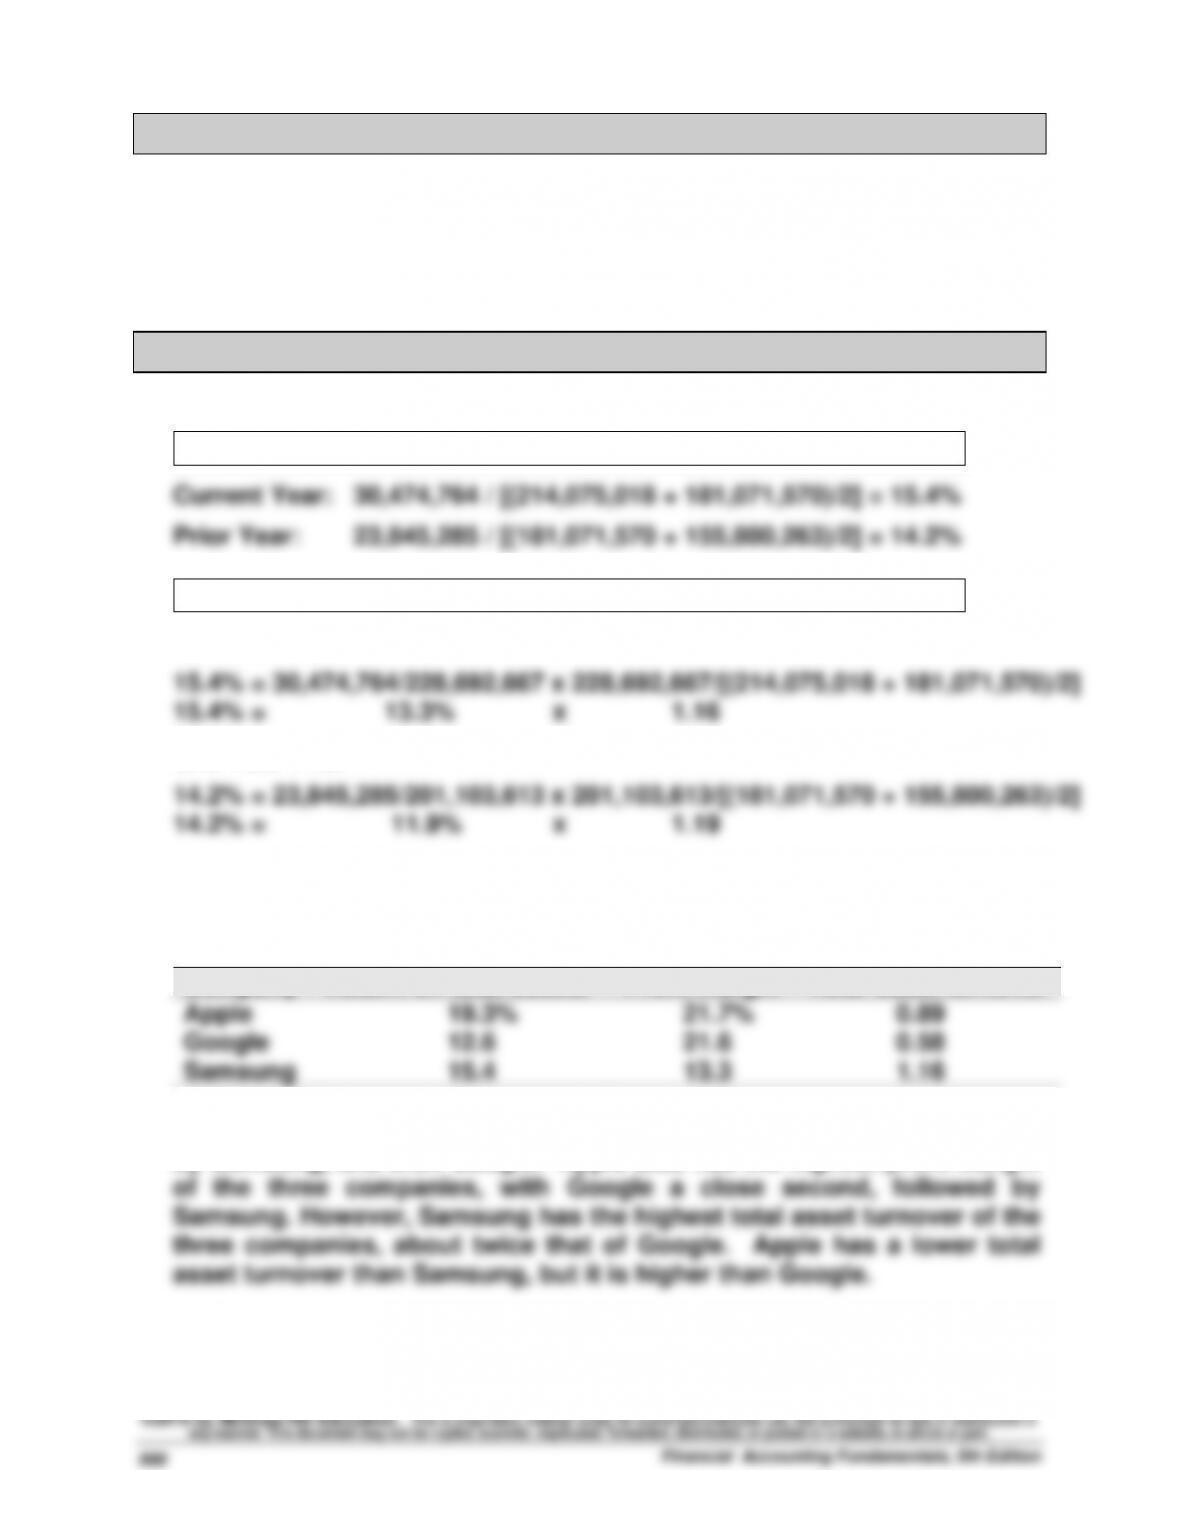
1. Apple’s return on total assets
Current Year: $37,037 / [($207,000 + $176,064) / 2] = 19.3%
2. Return on total assets = Profit margin x Total asset turnover
—— Returns in part 2 can differ from those in part 1 due to rounding ——
Apple’s component analysis of return on total assets*
Current Year
Google’s component analysis of return on total assets*
Comparative Analysis (Concluded)
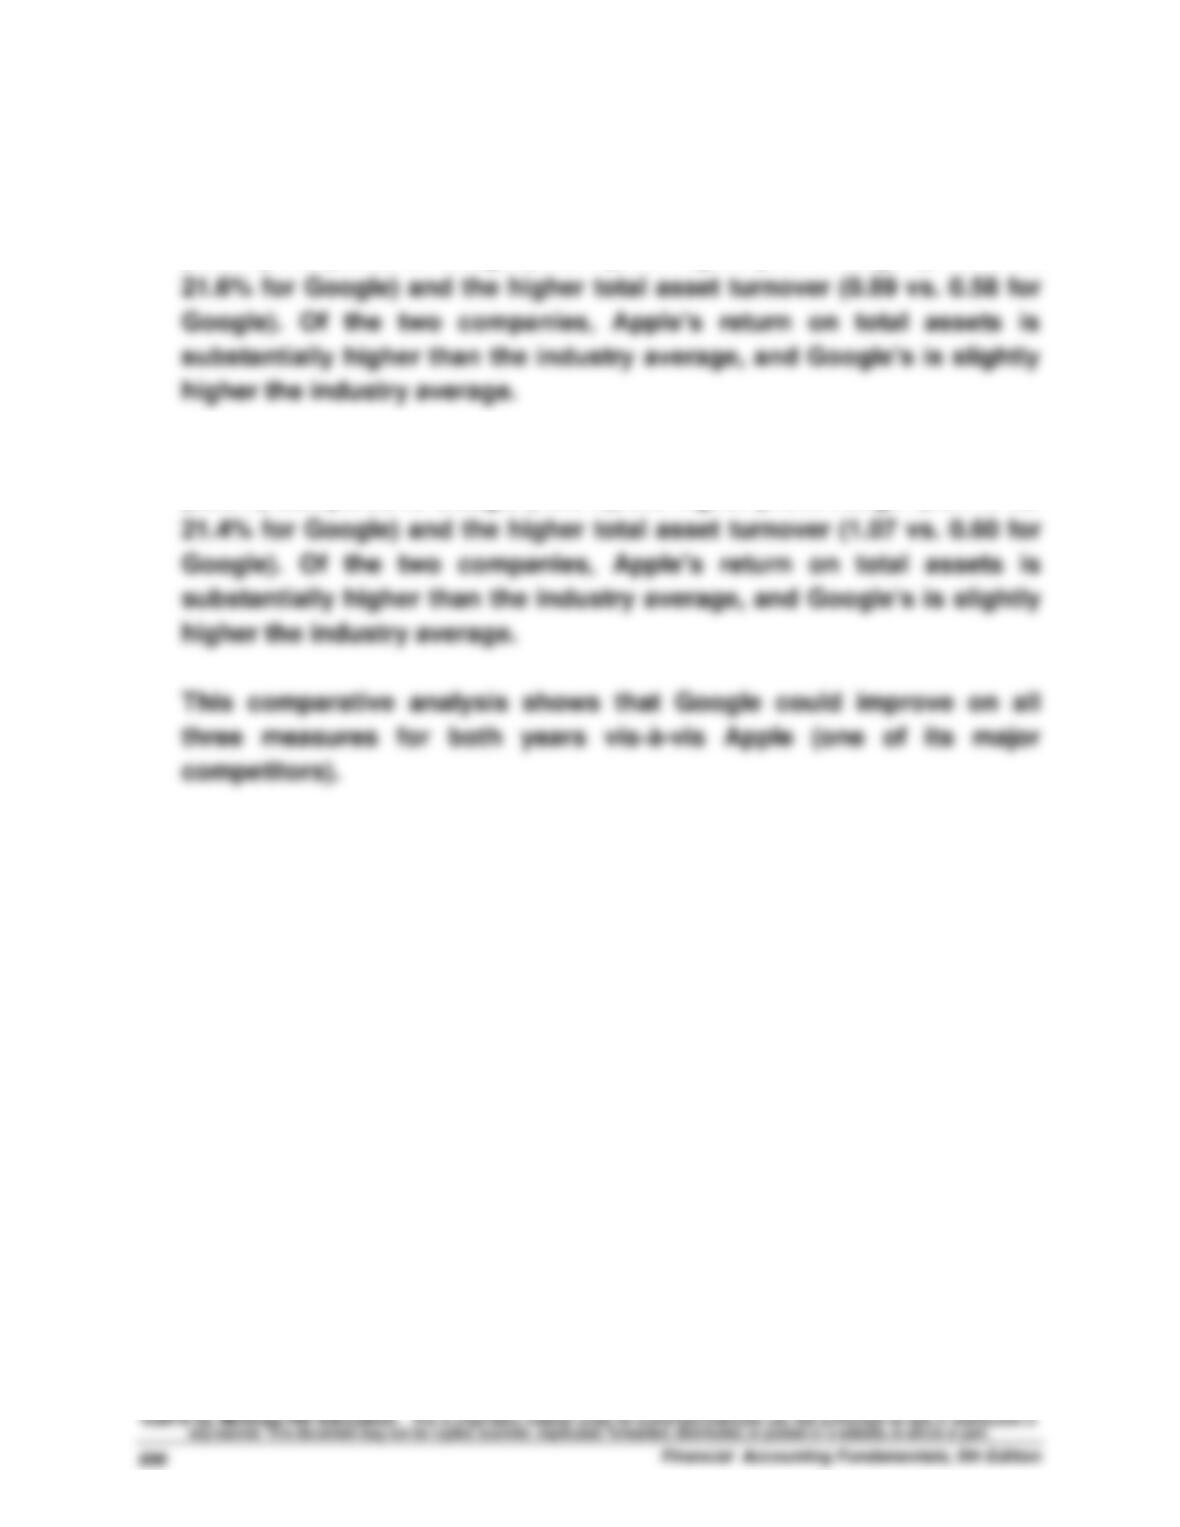
3. Current Year Analysis: Apple has the higher return on total assets
(19.3%) compared to Google (12.6%), the higher profit margin (21.7% vs.
One Year Prior Analysis: Apple has the higher return on total assets
(28.5%) compared to Google (12.9%), the higher profit margin (26.7% vs.
Ethics Challenge — BTN C-3
1. Kasey’s bonus is not contingent on the classification of available-for-
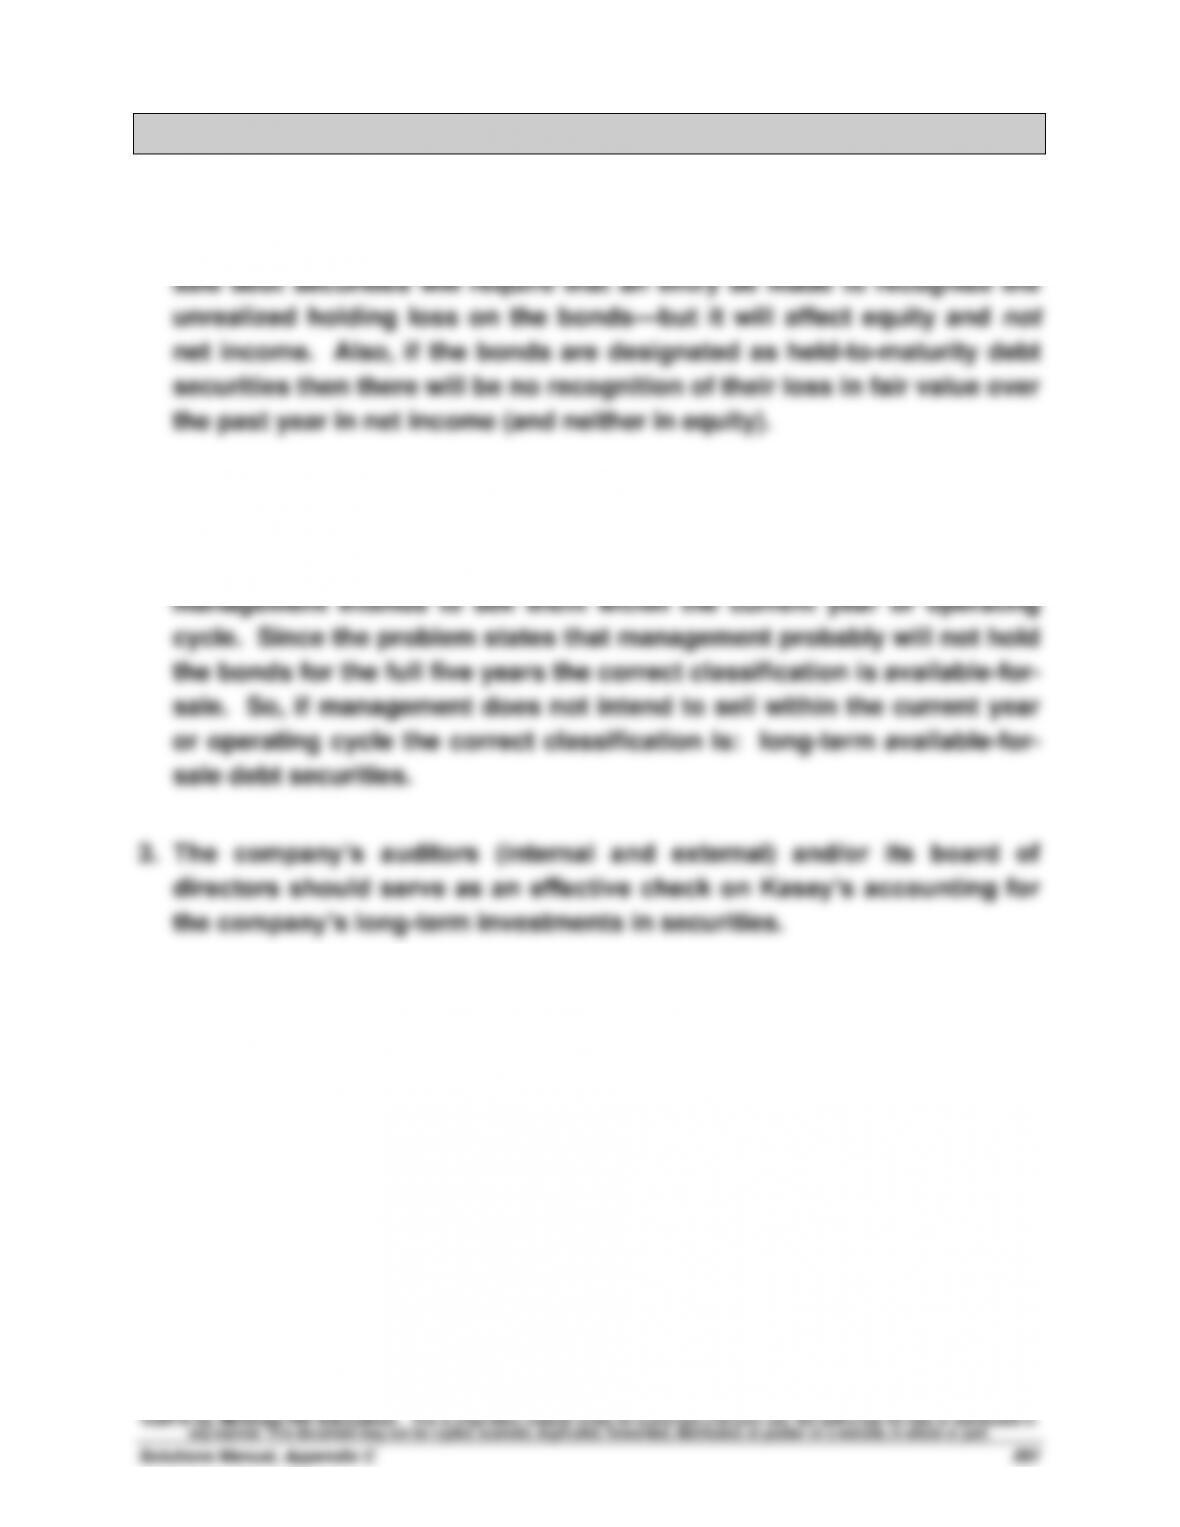
sale versus held-to-maturity. Designation of the bonds as available-for–
2. Generally, Kasey must classify its debt securities as either short or long
term and as available–for-sale or held-to-maturity. Since the bonds are
5-year bonds they should be classified as long-term investments unless
Communicating in Practice — BTN C-4
TO: Mary Jolee
FROM: (Your Name)
SUBJECT: Sale of Kemper Common Stock
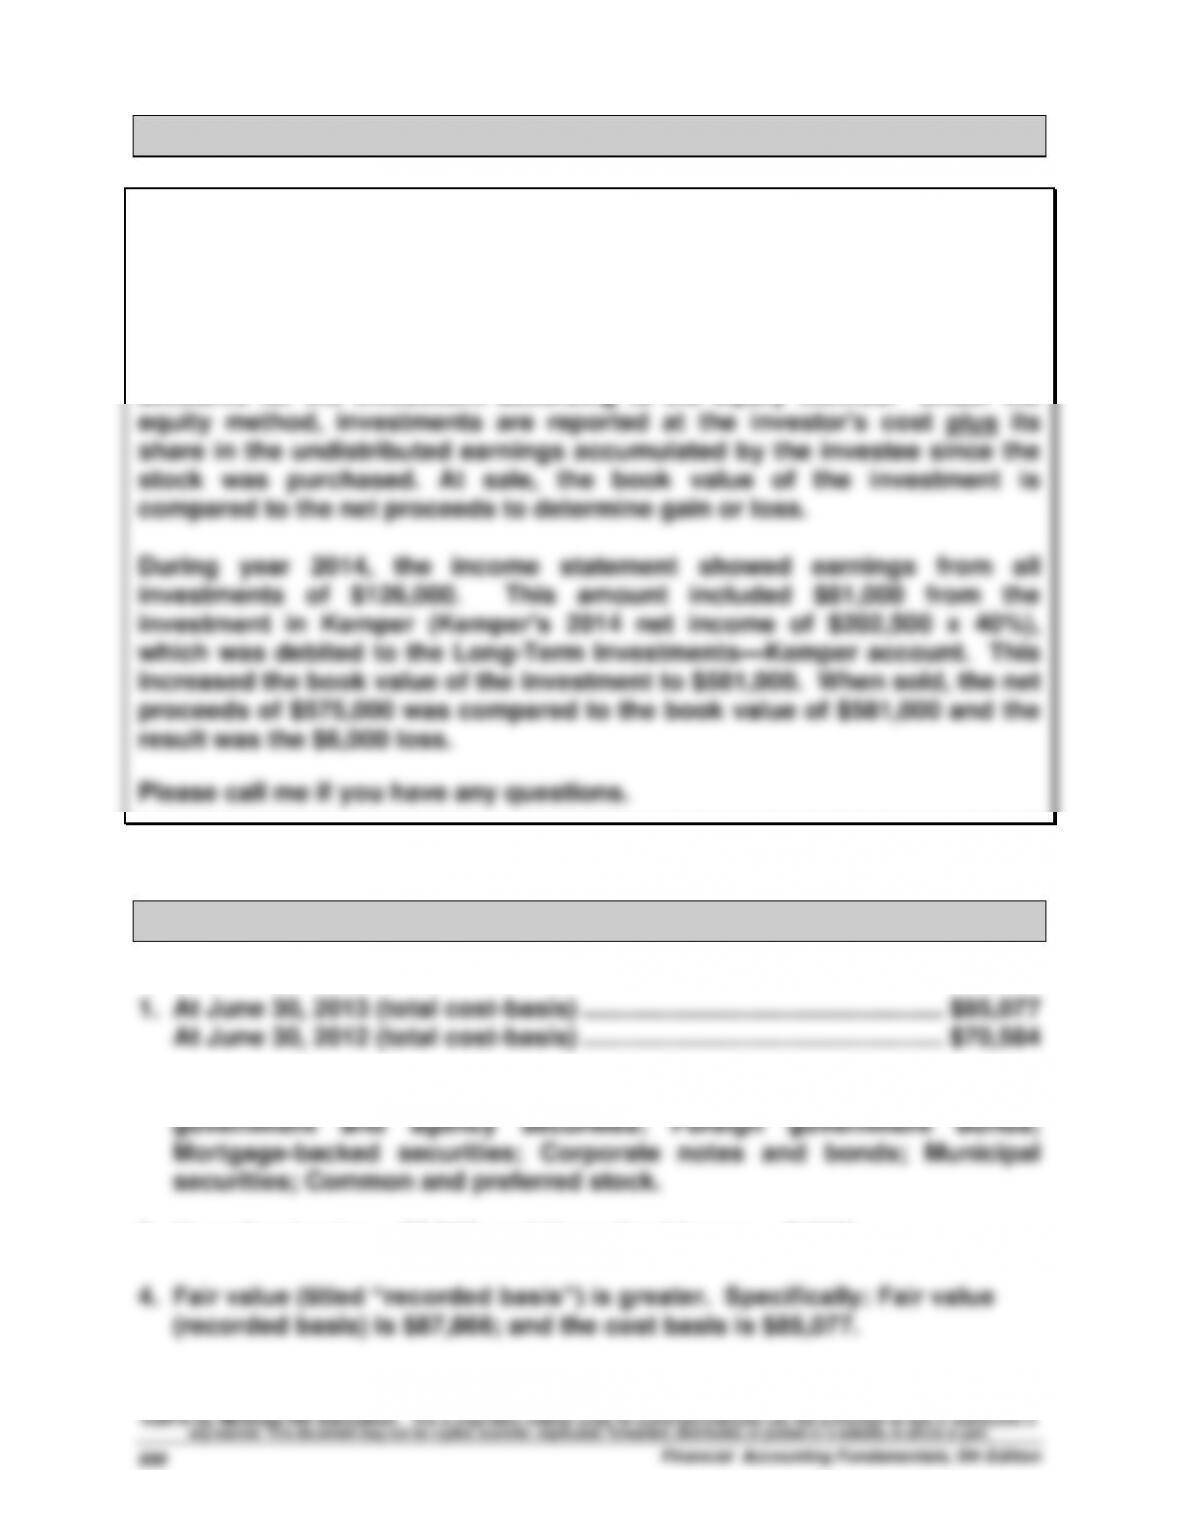
The $6,000 loss on the sale of Kemper common stock is correctly stated.
Jolee Company owned 40% of the outstanding shares, and therefore
accounts for the investment according to the equity method. Under the
Taking It to the Net — BTN C-5
($ millions for Parts 1 through 4)
2. Mutual funds; Commercial paper; Certificates of deposit; U.S.
3. Unrealized gains = $3,249; and Unrealized losses = $(460).
Teamwork in Action — BTN C-6
There is no specific solution to this activity. The instructor should serve as
a facilitator during this learning reinforcement activity.
Entrepreneurial Decision — BTN C-7
1.
2015
Jan. 1
Internet Rights …………………………………………...
106,920
Accounts Payable ………………………………...
106,920
Agreed to pay for Internet rights
12,000,000 yen x $0.00891/yen
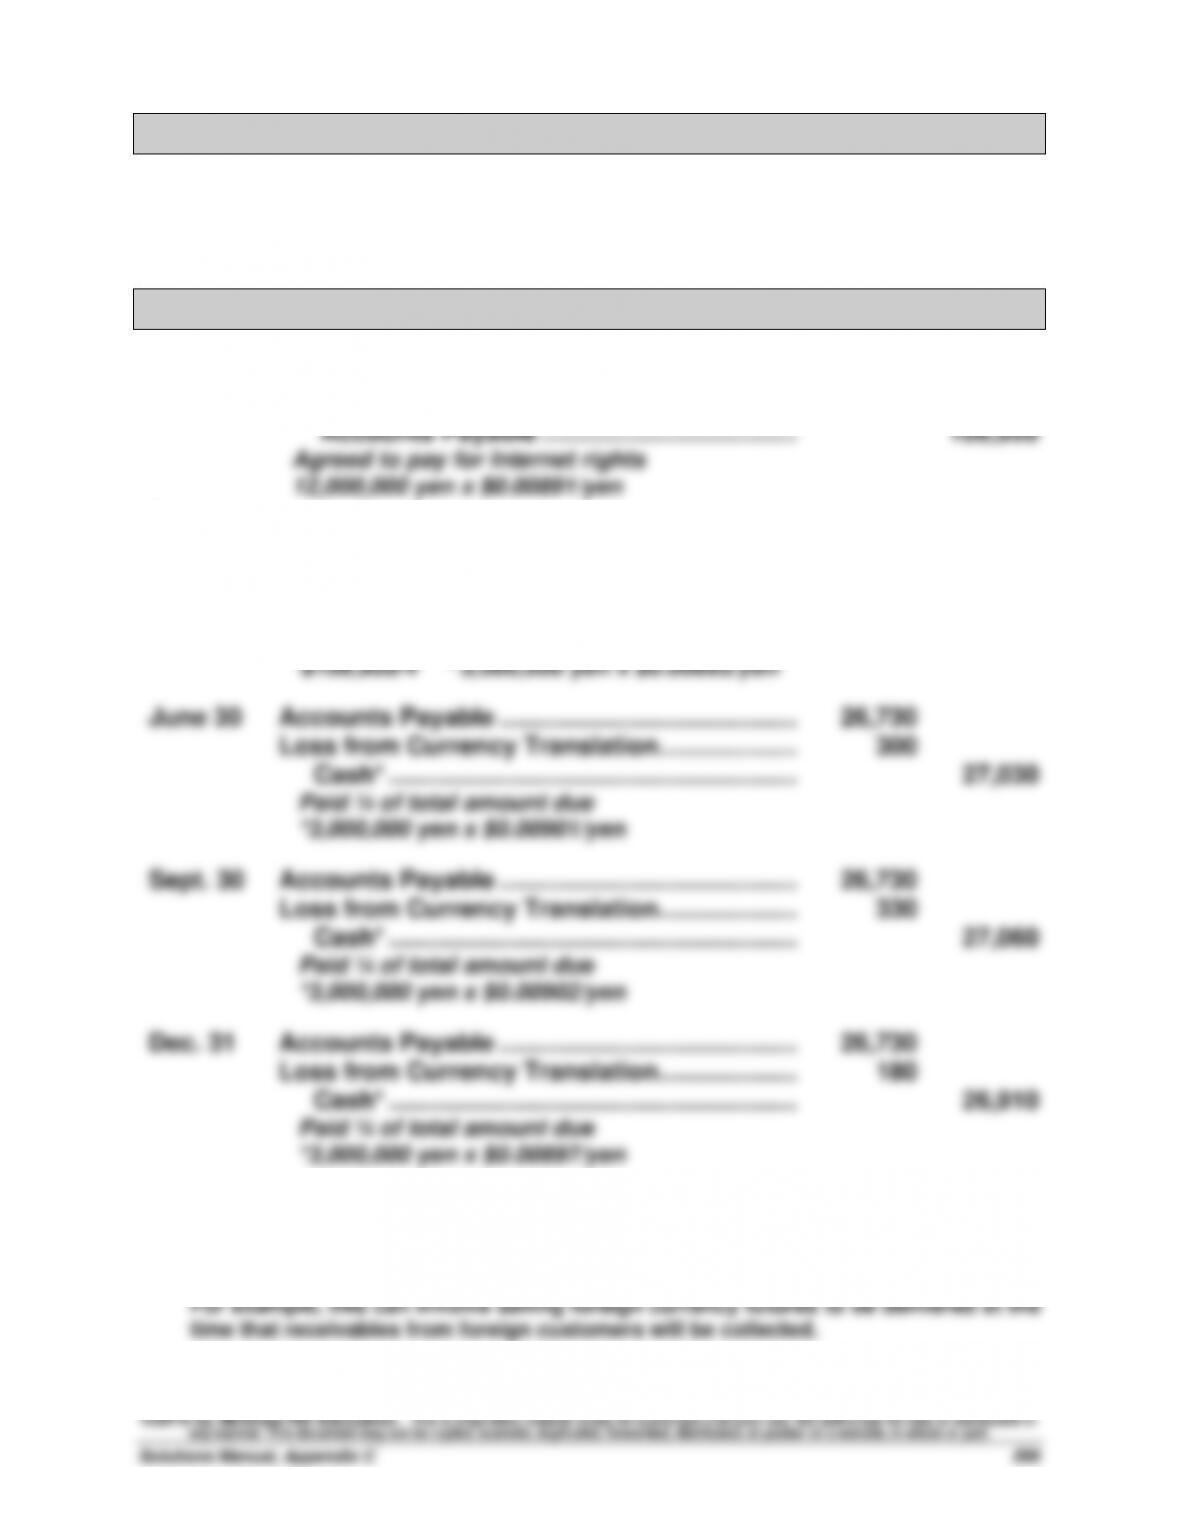
2.
Mar. 31
Accounts Payable* ……………………………………..
26,730
Loss from Currency Translation………………....
60
Cash ……………………………………………………..
26,790
Paid ¼ of total amount due
*$106,920/4 **3,000,000 yen x $0.00893/yen
June 30
Accounts Payable ……………………………………...
26,730
Loss from Currency Translation………………....
300
Cash* …………………………………………………....
27,030
Paid ¼ of total amount due
*3,000,000 yen x $0.00901/yen
Sept. 30
Accounts Payable ……………………………………...
26,730
Loss from Currency Translation………………....
330
Cash* …………………………………………………....
27,060
Paid ¼ of total amount due
*3,000,000 yen x $0.00902/yen
Dec. 31
Accounts Payable ……………………………………...
26,730
Loss from Currency Translation………………....
180
Cash* …………………………………………………....
26,910
Paid ¼ of total amount due
*3,000,000 yen x $0.00897/yen
3. Since all of the company’s payments are to be in yen, the company can
buy yen in advance to “lock in” the payment amount.
NOTE: A few students might understand the company’s opportunity for hedging.
Hitting the Road— BTN C-8A
Exchange rates can be found at businesses that specialize in foreign currency
exchange. Also, American Express offices abroad exchange currencies for
cardholders and post foreign exchange rates. Typically, railroad stations and
airports also post foreign exchange rates and offer currency exchange services.
Global Decision— BTN C-9
1. Samsung (₩ in millions)
Return on total assets = Net Income / Average Total Assets
Return on total assets = Profit margin x Total asset turnover
Current Year
One Year Prior
2. (a) Current Year Analysis: Samsung vs Apple vs Google
Return on total assets = Profit margin x Total asset turnover
Company
Return on total assets*
Profit margin
Total asset turnover
Apple
19.3%
21.7%
0.89
Google
12.6
21.6
0.58
Samsung
15.4
13.3
1.16
In the current year, Apple has the highest return on total assets followed
by Samsung, and then Google. Apple also has the highest profit margin
Global Decision (Concluded)
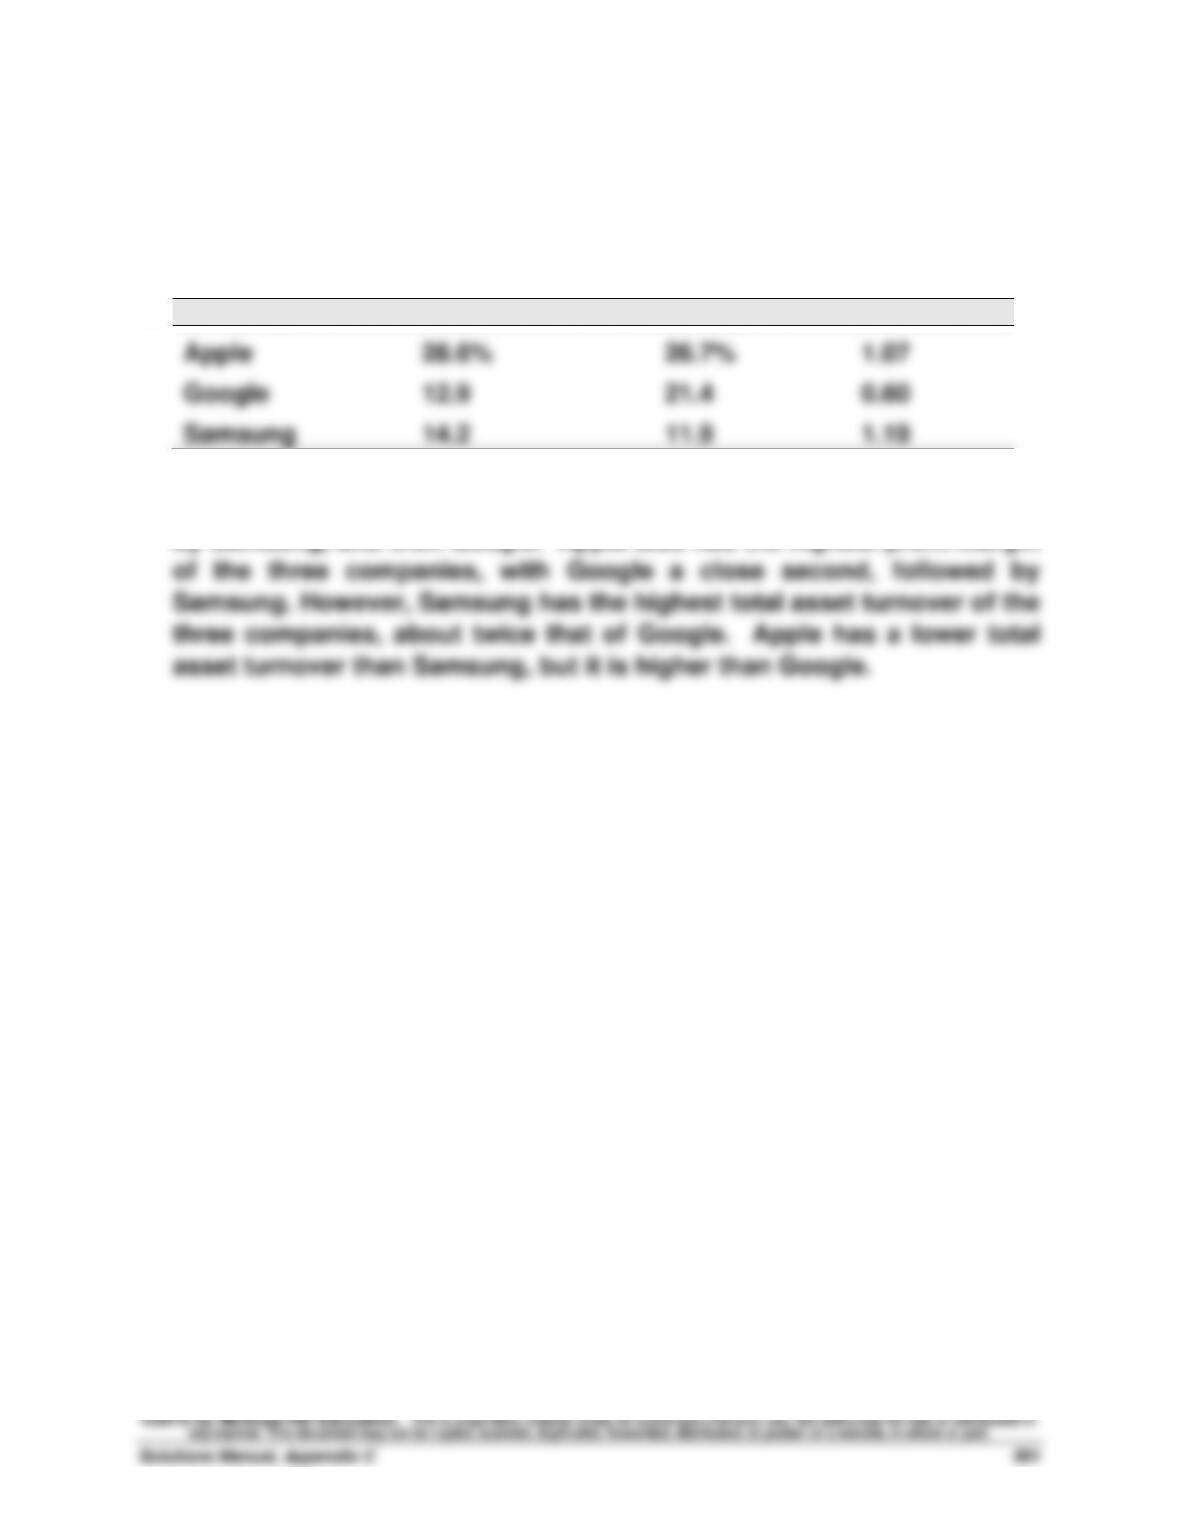
2. (b) Prior Year Analysis: Samsung vs Apple vs Google
Return on total assets = Profit margin x Total asset turnover
Company
Return on total assets*
Profit margin
Total asset turnover
Apple
28.6%
26.7%
1.07
Google
12.9
21.4
0.60
Samsung
14.2
11.9
1.19
In the prior year, Apple has the highest return on total assets followed
by Samsung, and then Google. Apple also has the highest profit margin