5-1
Financial Reporting and Analysis (6th Ed.)
Chapter 5 Solutions
Essentials of Financial Statement Analysis
Exercises
Exercises
E5-1 Calculating profitability ratios
(AICPA adapted)
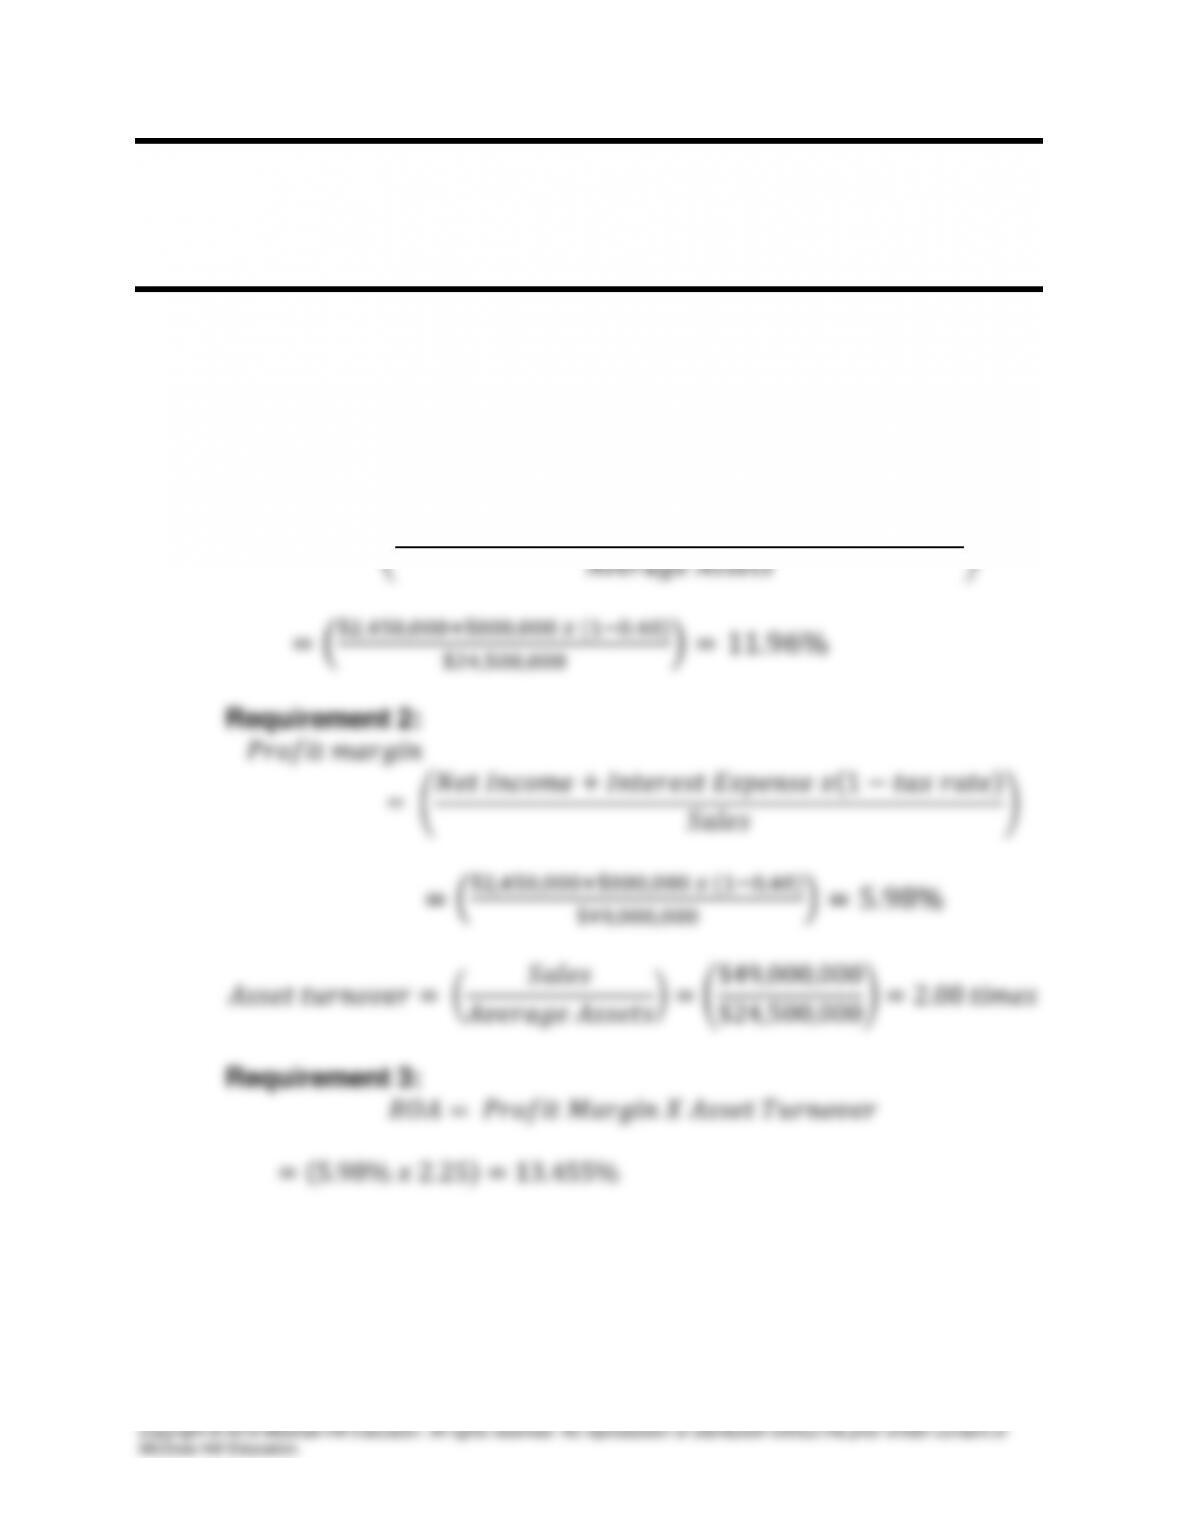
Requirement 1:
𝑅𝑂𝐴= (𝑁𝑒𝑡 𝐼𝑛𝑐𝑜𝑚𝑒 + 𝐼𝑛𝑡𝑒𝑟𝑒𝑠𝑡 𝐸𝑥𝑝𝑒𝑛𝑠𝑒 𝑥(1−𝑡𝑎𝑥 𝑟𝑎𝑡𝑒)
5-2
E5-2 Determining inventory turnover
(AICPA adapted)
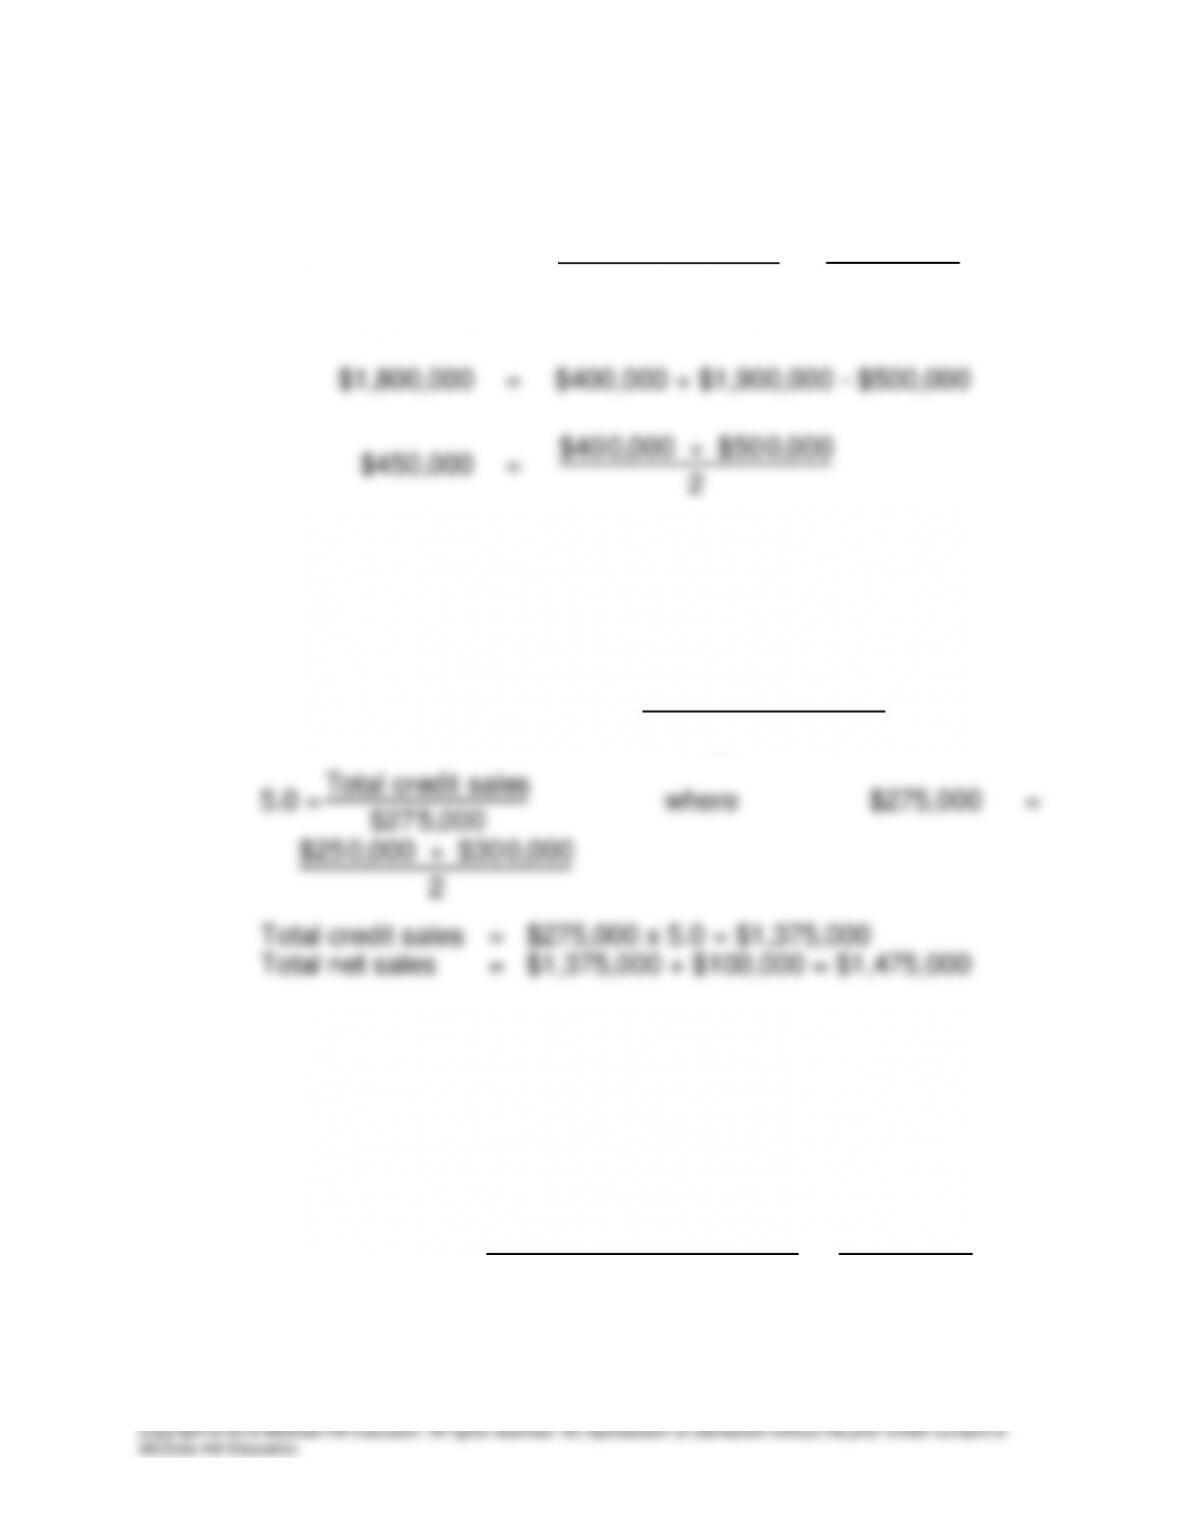
Inventory turnover =
Cost of goods sold
Average inventory
=
$1,800,000
$450,000
= 4.0
times
2
E5-3 Determining receivable turnover
(AICPA adapted)
Total net sales equals total credit sales plus total cash sales. The
accounts receivable turnover ratio is used to find total credit sales:
Accounts receivable turnover =
Total credit sales
Average receivables
E5-4 Assessing receivable and inventory turnover
(AICPA adapted)
Requirement 1:
Accounts receivable turnover
=
Net credit sales
Average trade receivables
=
$2,500,000
$462,500
= 5.41
times
5-3
Copyright © 2015 McGraw-Hill Education. All rights reserved. No reproduction or distribution without the prior written consent of
McGraw-Hill Education.
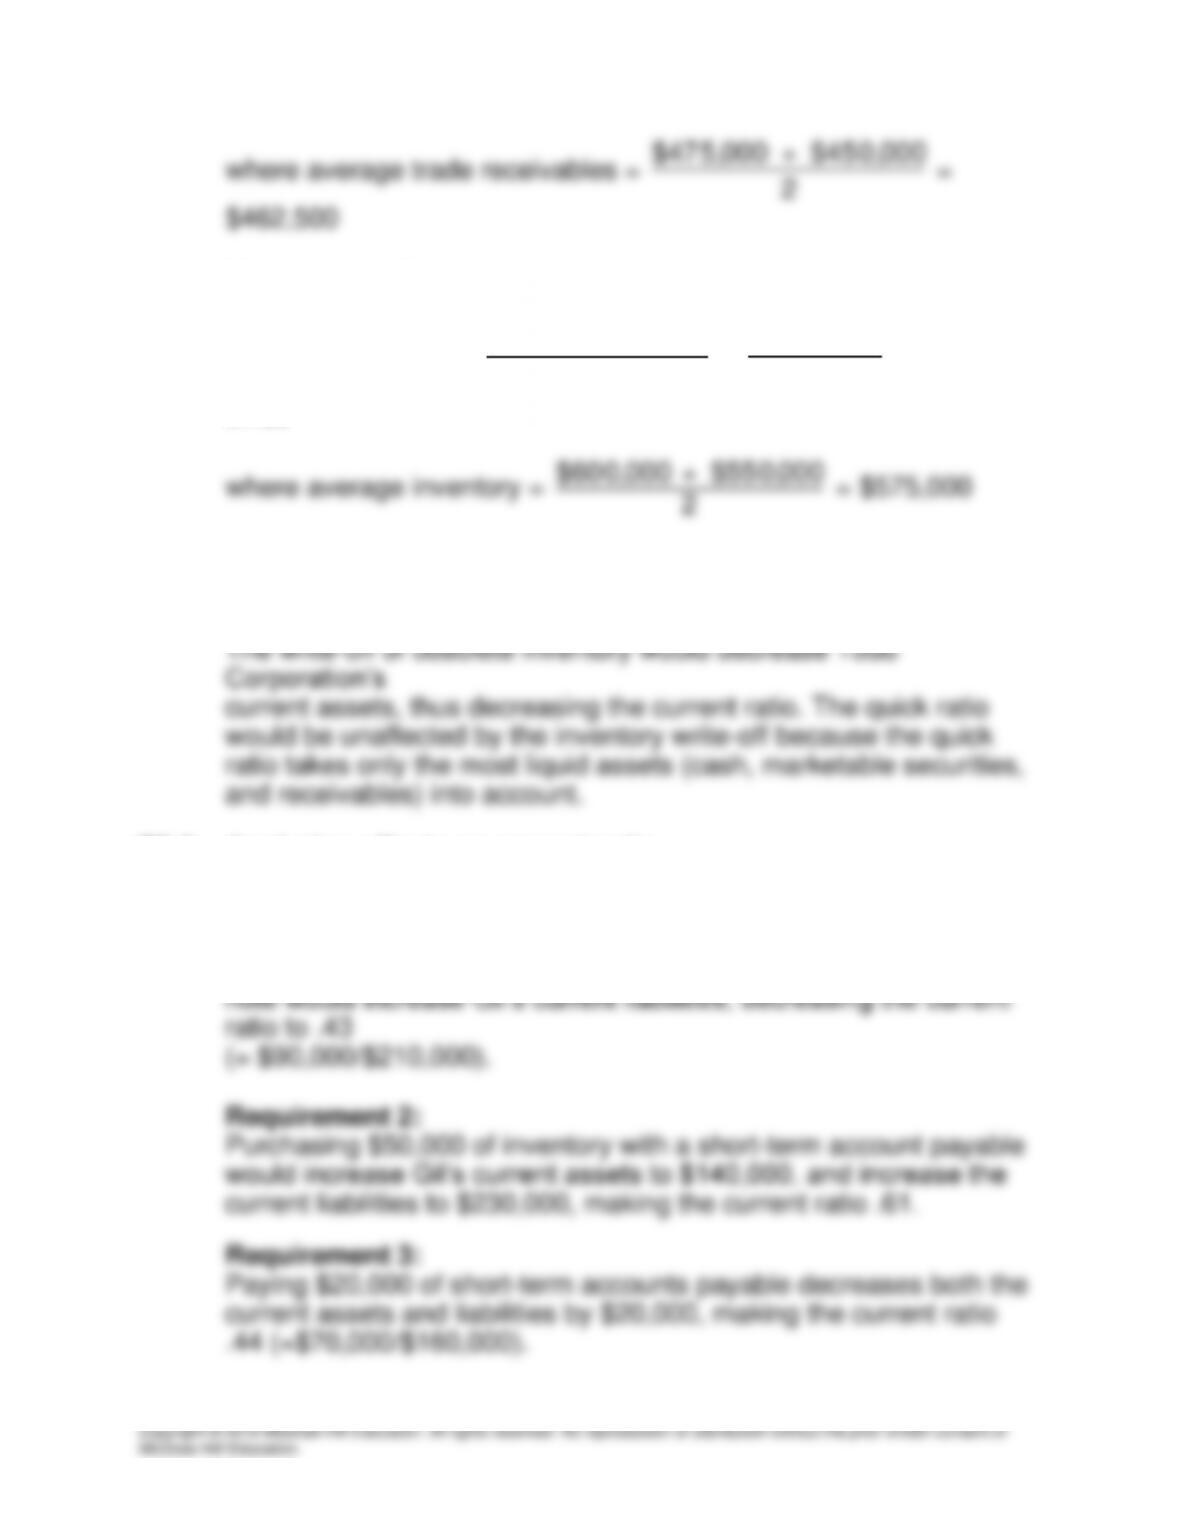
where average trade receivables =
$475,000 + $450,000
2
=
$462,500
Requirement 2:
Inventory turnover =
Cost of goods sold
Average inventory
=
$2,000,000
$575,000
= 3.48
times
2
E5-5 Analyzing current and quick ratios
(AICPA adapted)
E5-6 Analyzing effects on current ratio
(AICPA adapted)
Requirement 1:
The refinancing of a $30,000 long-term mortgage with a short-term
5-4
Copyright © 2015 McGraw-Hill Education. All rights reserved. No reproduction or distribution without the prior written consent of
McGraw-Hill Education.
Requirement 4:
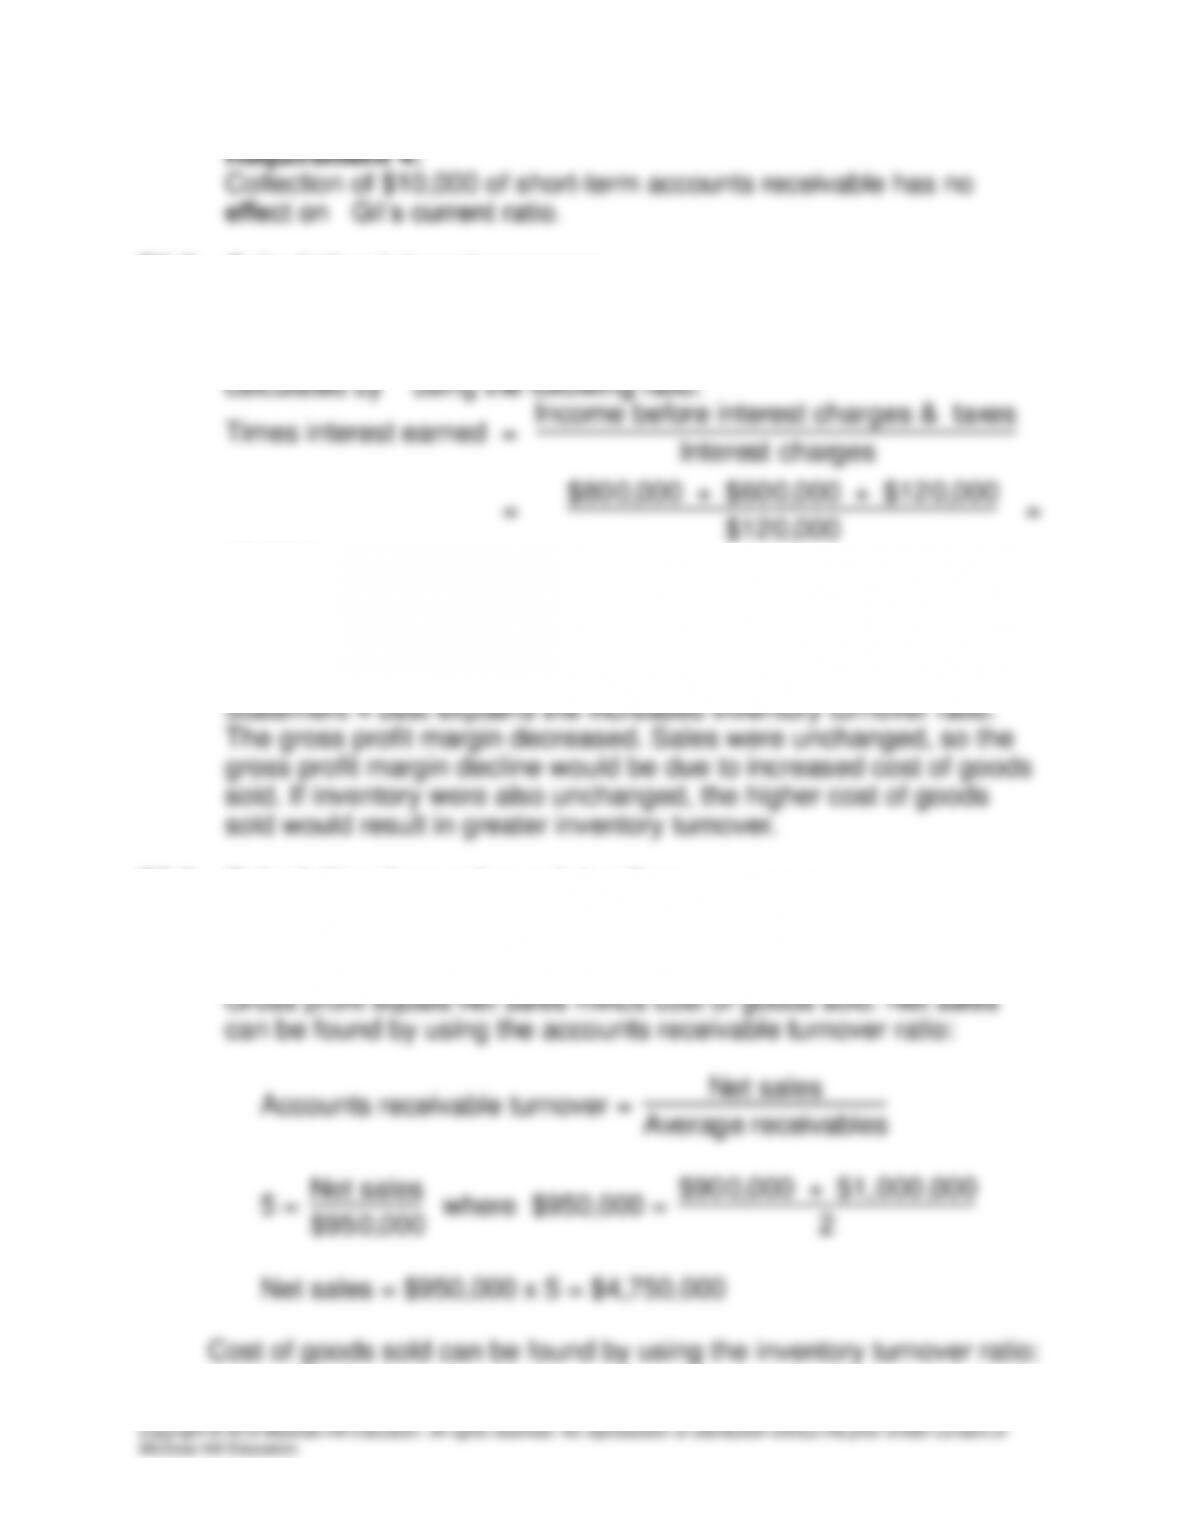
Collection of $10,000 of short-term accounts receivable has no
effect on Gil’s current ratio.
E5-7 Calculating interest coverage
(AICPA adapted)
The number of times that bond interest was earned can be
$120,000
12.67 times
E5-8 Analyzing why inventory turnover increased
(AICPA adapted)
E5-9 Calculating days sales outstanding
(AICPA adapted)
Requirement 1:
5-5
Inventory turnover =
Cost of goods sold
Average inventory
Cost of goods sold
E5–10 Hershey Company and Tootsie Roll Industries
Requirement 1:
Tootsie Roll is the smaller of the two companies as measured by
sales, and thus it should come as no surprise that Tootsie Roll also
5-6
the industry average. Hershey’s ROA is 15.8%, consistent with a
valuable brand. Tootsie Roll’s ROA is only 5.1%, far below the 10%
E5–11 Mentor Graphics and its non-GAAP earnings
Requirement 1:
Here are the items specifically mentioned by management: equity–
based (noncash) employee compensation; severance and related
Requirement 3:
Analysts and investors may be harmed if they naively assume that
excluded costs are non-recurring expenses of the business. Doing
so may give analysts and investors a false sense of the company’s
E5–12 Calculating ROCE for Whole Foods Market
Requirements1 and 2:
5-7
Computation of ROCE
2012
2009
Net income
$465,573
$146,804
Nonrecurring items
—
—
Preferred dividends
—
(19,833)
Net income available to common
465,473
126,971
Average common equity
3,396,887
1,566,950
ROCE
13.71%
8.10%
about 1.72 (or 8.10 ROCE / 4.7 ROA), whereas the multiplier in
2012 was 1.41. This means that ROCE in 2012 would have 16.7%
(9.7% ROA x 1.72 multiplier) had the company’s financial leverage
remained at its higher, 2009 level.
5-8
E5–13 Cause-of-change analysis
Requirement 1:
($ in millions)
Causes of change in net income
Net income – 2013
$1,364.0
Effect of increase in sales
[$1,000 x (1–45%–15%)]
248.0
Effect of increase in COGS%
[$6,500 x 2% x (1–38%)]
(80.6)
Effect of increase in OPEX%
[$6,500 x 1% x (1–38%)]
(40.3)
Effect of increase in tax rate
[$2,405 x 2%]
(48.1)
Increase in net income
79.0
Net income – 2014
$1,443.0
Requirement 2:
Although net income grew by 5.8% ($1,443 vs. $1,364) from 2013
to 2014, sales increased by 18.2% ($6,500 vs. $5,500) over the
same period. The earnings increase did not keep pace with the
sales increase due to deteriorating margins and an increase in the
income tax rate. The deteriorating margins were due to increases in
both cost of goods sold and operating expenses as a percent of
sales. In the absence of such strong sales, net income would have
Financial Reporting and Analysis (6th Ed.)
Chapter 5 Solutions
Essentials of Financial Statement Analysis
Problems
Problems
P5-1 Comparing profitability
Requirement 1:
Following are sales growth data for the three companies. All dollar
amounts are in millions.
The Kroger Co.
Year Ended
1/31/09
1/30/10
1/29/11
1/28/12
Sales
$76,063
$76,609
$82,049
$90,374
Annual sales growth rate
0.7%
7.1%
10.1%
Compound annual growth rate
5.9%
Publix Super Markets
12/31/11
Annual sales growth rate
1.6%
3.3%
Compound annual growth rate
4.1%
Slater Brothers Holdings
9/27/09
9/26/10
9/25/11
9/30/12
Sales
Annual sales growth rate
2.4%
Compound annual growth rate
0.9%
5-10
Requirement 2:
P5-2 Assessing short-term liquidity
Requirement 1:
Ross Stores has the lowest current ratio of the three companies.
However, its cash conversion cycle is only 22.5 days and the
5-11
P5-3 Analyzing credit risk analysis and long-term solvency
Requirement 1:
Two coverage ratios are provided. The interest coverage ratio is
computed as earnings before interest and taxes (EBIT) divided by
equal to the long-term debt to tangible assets ratio. Because the
P5-4 Decomposing return on common shareholders’ equity
from 21.7% in the year ended February 27, 2010 to –21.1% in the
year ended March 3, 2012.
5-12
2012. So ROA, like ROCE, was declining over this period, but less
so.
Requirement 2:
Financial leverage has the effect of making ROCE more extreme.
2011) and bad (year ended March 3, 2012) suggest that Best Buy
P5-5 Interpreting accounts receivable turnover
Requirement 1:
Accounts receivable turnover is computed as sales divided by
average accounts receivable outstanding, where average
5-13
KapStone Paper and Packaging Corporation
Year
2009
2010
2011
Sales
$632,478
$782,676
$906,119
Average accounts receivable
(beginning balance + ending
balance)/2
$64,949
$62,524
$87,480
Accounts receivable turnover
9.7
12.5
10.4
Requirement 2:
Boise collected its receivables somewhat more quickly in 2011 than
did KapStone. Boise’s 11.3 turnover ratio in 2011 is equivalent to
average days receivables outstanding of 365 x
($208,714/$2,364,024) = 32.2 days and KapStone’s 10.4 is
equivalent to 365 x ($87,480/$906,119) = 35.2 days.
Requirement 3:
Boise’s receivable turnover showed steady improvement over the
• One company may “factor”—meaning sell to a third-party
financial institution—some (or a larger proportion) of its accounts
receivable to make cash available more quickly;
• One company may be more aggressive in its collection efforts;
• The two companies may employ different credit standards, which
5-14
method might not be appropriate are seasonality and “window
dressing.”
Firms whose operations are seasonal are likely to show significantly
different receivable levels throughout the year, whereas the annual
computed independently of the others. Averaging the quarterly
averages is equivalent to a weighted average of the amounts at the
five balance sheet dates that surround the year’s four quarters. For
P5-6 Analyzing inventories
Danaher’s inventory turnover ratio improved in 2010 but fell in 2011
to a level slightly below 2009. Inventory turnover will remain
5-15
It is probably useful to focus more on changes over several years
P5-7 Analyzing fixed asset turnover
Requirement 1:
Lennox International has higher turnovers (both current asset and
fixed asset) than Tecumseh Products. Consistent with the higher
P5-8 Determining accounting quality
Requirement 1: