Financial Reporting & Analysis (6th Ed.)
Chapter 17 Solutions
Statement of Cash Flows
Cases
Cases
C17-1. Statement of cash flow differences under IFRS and U.S. GAAP
Telstra
Seven Group Holdings
First Solar
Operating
section
1. Interest and other
items of a similar nature
received
2a. Dividends received
from equity accounted
investees
2b. Other dividends
received
3. Interest and other
costs of finance paid
1. Interest received
3. Interest paid
Investing section
1. Interest received
2a. Distributions
received from Foxtel.
2b. Dividends received
Financing section
3. Finance costs paid
(i.e., interest)
As illustrated, key areas of difference between IFRS and U.S. GAAP under current
standards are where interest and dividends received and interest paid are reported.
All of these items are reported in the operating section under U.S. GAAP. IFRS
permits firms to report these items in other sections of the statement of cash flows. A
number of top 100 Australian firms follow the approach taken by Seven Group
Holdings; a few others report interest or dividends received as investing activities.
17–31
C17-2. Lucky Lady, Inc.: Preparing comprehensive statement of cash flows
Note: All amounts shown in this solution are “$ in thousands”
Lucky Lady, Inc.
Statement of Cash Flows
For the Year Ended 12/31/14
(book value $2,501–cash received $684) 1,817
– Increase in net accounts receivable (29,869)
– Increase in prepaid expenses (10,536)
– Increase in inventories (12,508)
+ Decrease in pre-opening costs 10,677
+ Increase in deferred revenue 10,784
Cash flow from operations ($ 34,831)
Cash Flows from Investing Activities:
Sale of property, plant & equipment 684
Purchase of PP&E and cost of building ($480,054)
Issuance of additional common stock 72,559
Cash flow from financing activities $ 80,995
Total change in cash (368,658)
Allowance Property Pre– Other Accrued Other Current Current Capital in Common Ret.
for Doubt – Prepaid Plant and Acc. opening Operating Salaries Accrued Accrued Construct. Mat. Cap. M at. Deferred Deferred L/T oblig Common Excess of Stock in Earn.
($ in thousands) Cash A/R ful Acct s. Expenses Inventories Equipmt. Depr. Expenses Assets A/P and Wages Interest Liabilities Payables Leases LTD Revenue Taxes
Cap. Leases
LTD Stock Par Value Treasury (Deficit )
Balance 12/31/13 579,963 2,178 (1,531) 1,219 154 471,506 (21,796) 10,677 21,116 (4,322) (945) (9,429) (9,744) (32,296) (289) 0 0 (6,517) (162) (473,000) (485) (589,827) 29,490 34,040
Net loss (117,586) 117,586
Change in prepaids (10,536) 10,536
Change in invento ries (12,508) 12,508
Change in pre-opening co sts 10,677 (10,677)
Change in other operating assets (5,485) 5,485
Change in A/P 9,859 (9,859)
Change in accrued wages and sal. 7,249 (7,249)
Sale of PP&E 684 (12,934) 12,250
Purchase of PP &E (480,054) 480,054
Change in co nstructio n payables 64,548 (64,548)
Cash flow from investing (414,822)
Repayment of capital lease prin. (1,564) (1,541) 3,105
Debt proceeds 10,000 (1,573) (8,427)
Issuance of co mmo n stock 72,559 (21) (72,538)
Note on significant non-cash transaction: The Company entered into a
capital lease agreement and recorded an asset and a corresponding liability for
$16,987.
Property, Plant and Equipment
Beginning balance
$471,506
New capital lease
16,987
$14,751
Cost of asset sold (net book value
$2,501 + Acc. dep. $12,250)
Other new additions
X
Ending balance
$953,796
X = $480,054
Accumulated Depreciation
$21,796
Beginning balance
Acc. depr. on asset sold
X
8,018
Depreciation expense
68,948
Carrying value adjustment
$86,512
Ending balance
Beginning balance
Repayment of principal
New capital lease
$15,874
Ending balance
Beginning balance
Bad debts written off
17–34
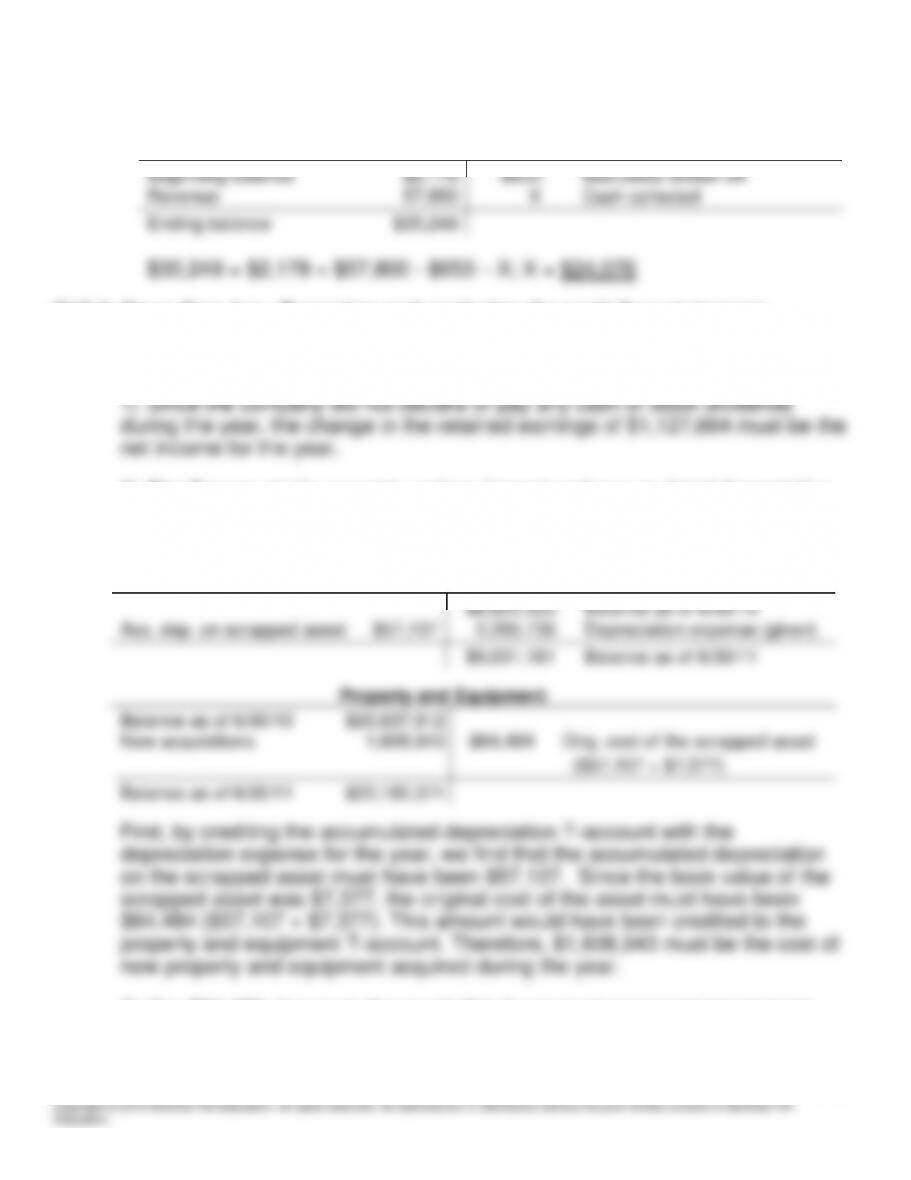
$4,733 = $1,531 + $3,855 – X; X = $653
Gross Accounts Receivable
Beginning balance
$2,178
$653
Bad debts written off
Revenue
57,800
X
Cash collected
Ending balance
$35,249
$35,249 = $2,178 + $57,800 – $653 – X; X = $24,076
C17-3. Opus One, Inc.: Preparing and analyzing the cash flow statement
Requirement 1:
Notes:
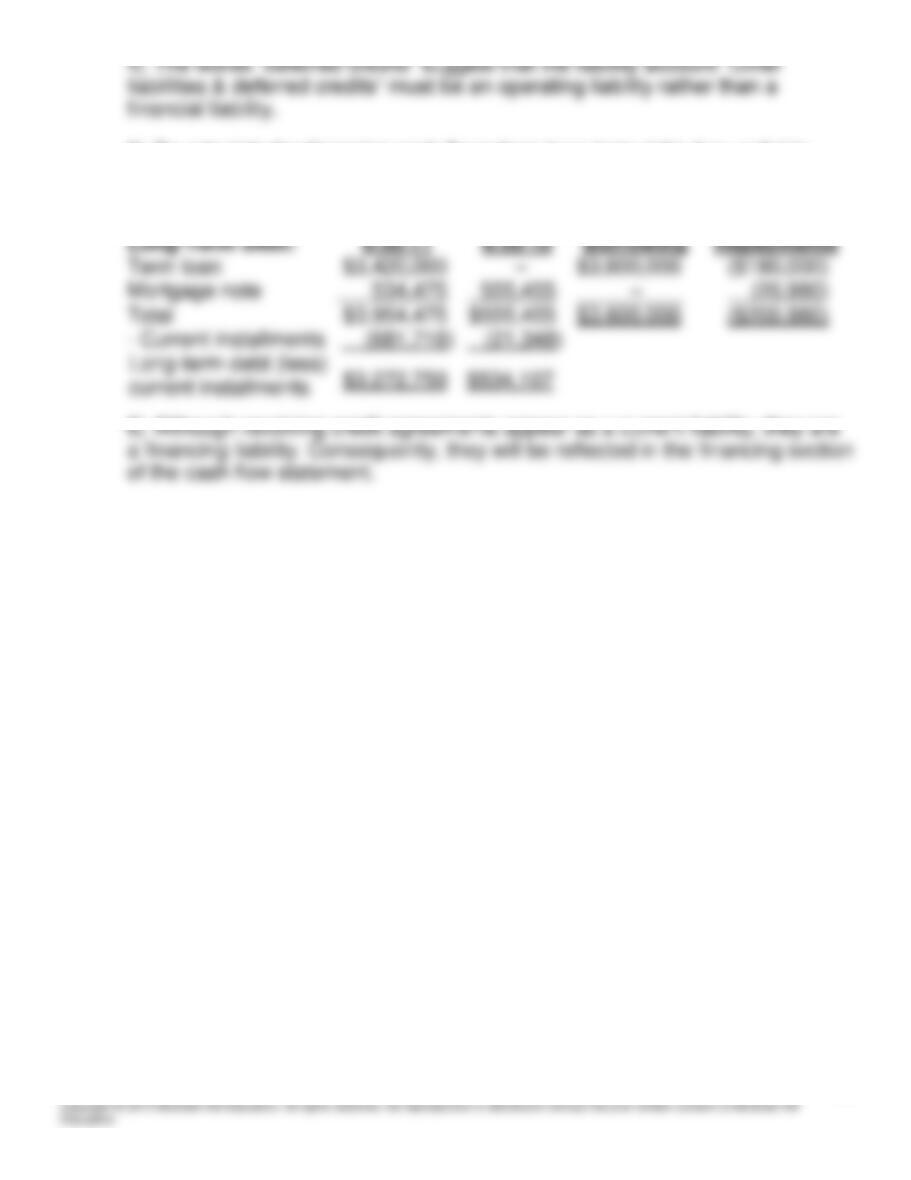
2) The T-accounts for property and equipment and accumulated depreciation
are prepared to solve for the new acquisitions of property and equipment
during the year.
Accumulated Depreciation
$6,822,553
Balance as of 6/30/10
Acc. dep. on scrapped asset
$57,107
2,265,735
Depreciation expense (given)
$9,031,181
Balance as of 6/30/11
Property and Equipment
Balance as of 6/30/10
$20,637,912
New acquisitions
1,608,943
$64,484
Orig. cost of the scrapped asset
($57,107 + $7,377)
Balance as of 6/30/11
$22,182,371
First, by crediting the accumulated depreciation T-account with the
depreciation expense for the year, we find that the accumulated depreciation
on the scrapped asset must have been $57,107. Since the book value of the
scrapped asset was $7,377, the original cost of the asset must have been
$64,484 ($57,107 + $7,377). This amount would have been credited to the
property and equipment T-account. Therefore, $1,608,943 must be the cost of
new property and equipment acquired during the year.
3) The $24,450 change in the goodwill balance must represent impairment.
17–35
Copyright © 2015 McGraw-Hill Education. All rights reserved. No reproduction or distribution without the prior written consent of McGraw-Hill
Education.
4) The words “deferred credits” suggest that the liability account “Other
liabilities & deferred credits” must be an operating liability rather than a
financial liability.
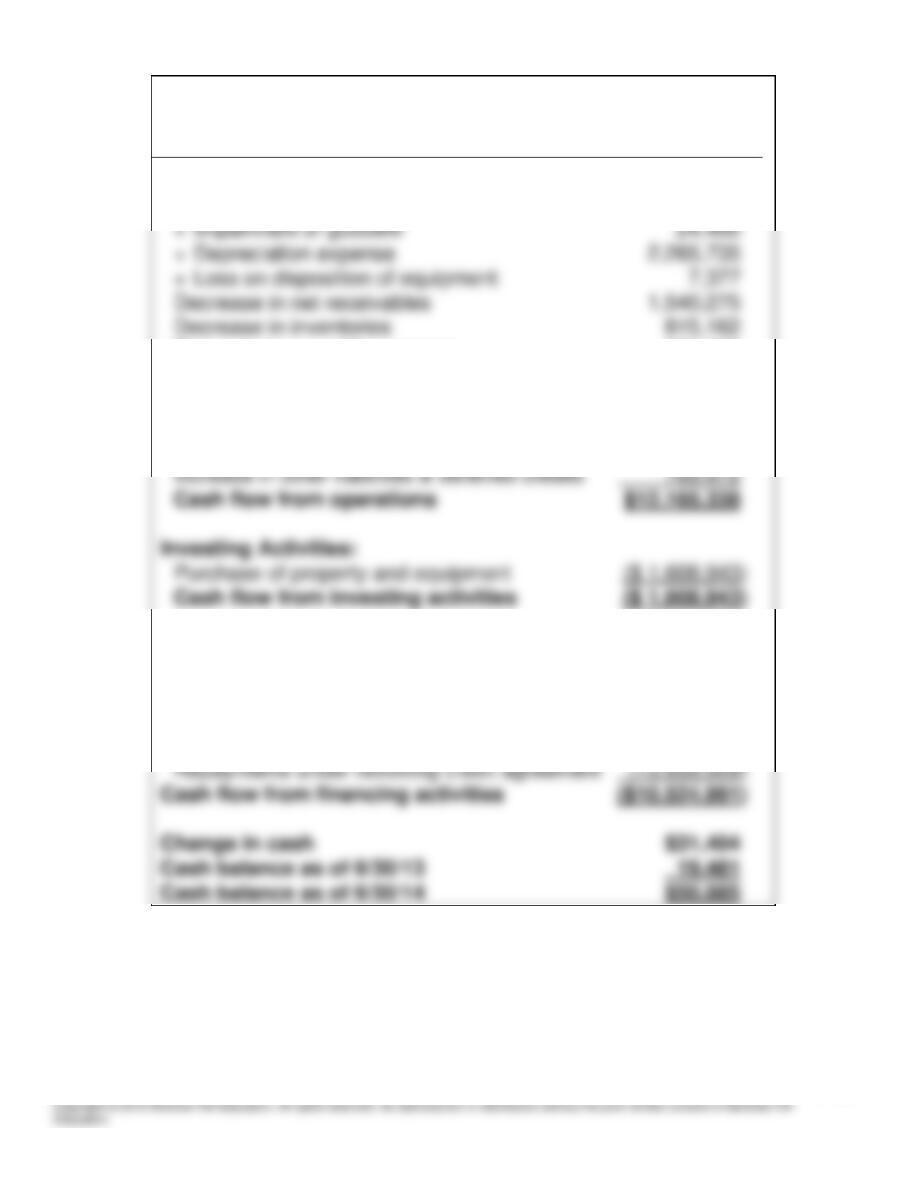
5) To calculate the financing cash flows from long-term debt, it is useful to
focus on the total long-term rather than split them into current and long-term
portions.
Long-Term Debt:
6/30/11
6/30/10
Borrowing
Repayments
Term loan
$3,420,000
–
$3,600,000
($180,000)
Mortgage note
534,475
555,455
–
(20,980)
Total
$3,954,475
$555,455
$3,600,000
($200,980)
– Current installments
(681,716)
(21,348)
Long-term debt (less)
current installments
$3,272,759
$534,107
6) Although revolving credit agreements appear as a current liability, they are
a financing liability. Consequently, they will be reflected in the financing section
of the cash flow statement.
17–36
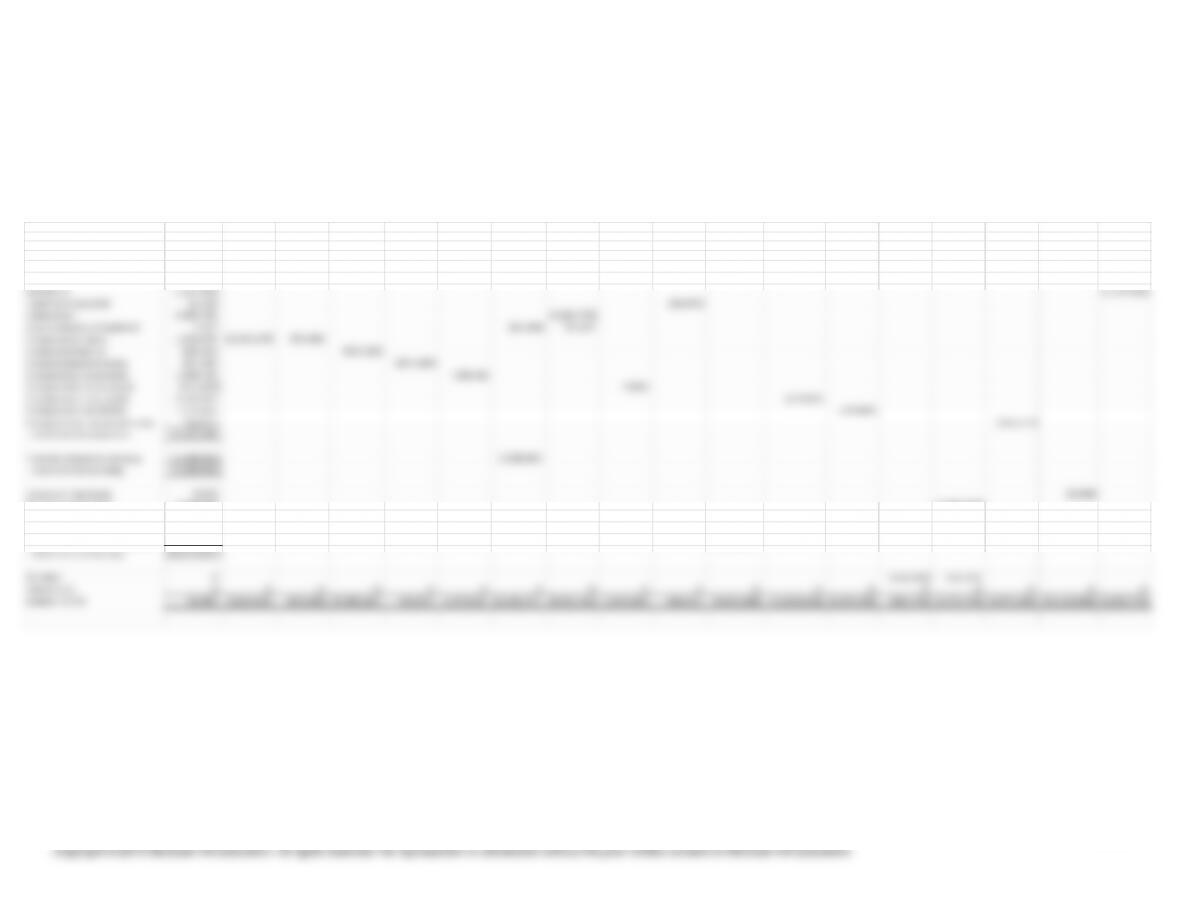
Opus One, Inc.
Statement of Cash Flows
For the Year Ended 6/30/2014
Operating Activities:
Net income for the year $ 1,127,664
Decrease in prepaid expenses 254,183
Decrease in income tax receivable 1,500,482
Increase in deferred tax asset (511,600)
Increase in accounts payable 3,102,873
Increase in accrued liabilities 1,274,865
Financing Activities:
Issuance of new shares 8,998
Borrowing on term loan 3,600,000
Repayment of term loan (180,000)
Repayment of mortgage note (20,980)
Allo wance Income Revo lving Current Other Liab Commo n
for Bad Prepaid Taxes Pro perty A cc. Deferred Credit Accounts Accrued Install. and Defd. Sto ck and Ret.
Cash A/R Debts Invento ries Expenses Receiv. and Equip. Depr. Taxes Goo dwill A greement Payable Liabilities LTD LTD Credits APIC Earn.
Balance 12/31/13 19,481 6,963,195 (1,200,000) 26,801,526 710,058 3,073,537 20,637,912 (6,822,553) 531,803 268,691 (18,743,407) (7,951,545) (2,380,493) (21,348) (534,107) (3,308,714) (10,117,946) (7,926,090)
Net inco me 1,127,664 (1,127,664)
Issuance of new shares 8,998 (8,998)
Bo rro wing o n term loan 3,600,000 (3,600,000)
Repayment of term lo an (180,000) 180,000
Repyament of mortgage note (20,980) 20,980
Repayments under revo lving credit (13,933,009) 13,933,009
Cash flow from financing (10,524,991)
17–38
Requirement 2:
Caveat: The analysis is limited by the information available in the problem.
The learning objective of this assignment is to enable the students to evaluate
the cash flow statement rather than perform a comprehensive analysis of the
financial performance of Opus One, Inc.
One can sustain this level of cash flow in the future.
First of all, the company’s receivables decreased by more than $1.5 million,
meaning the company collected that much more cash than the revenue
booked in the income statement. This might be good news if the company has
improved its collection efforts. Even so, this is unlikely to happen year after
year, we might expect the accounts receivable to have gone up. More
importantly, inventory level provides a signal about future demand; i.e,
companies are likely to build up (decrease) inventories when they expect a
surge (fall) in demand. Therefore, another possibility is that the company
saved some cash in the current year by buying less inventory, but it might
story. A joint examination of the two is likely to be instructive.
A third factor is the increase in accounts payable by more than $3 million. More
credit from suppliers is not necessarily a bad sign; i.e, suppliers are unlikely to
extend credit when they believe their customers have impending financial
difficulties. However, an increase in accounts payable often coincides with a
17–39
A fourth item is the cash received from the decrease in the income tax refund
receivable. When is it likely for a company to have an asset called income tax
refund receivable? There are two possibilities. First, the company paid more
taxes during a year when compared to what it owed the IRS based on its
C17-4. Capitalizing software development costs
Requirement 1:
Some analysts believe that the amount of capitalized software costs should be
deducted from operating cash flows to improve inter-firm comparability and to
17–40
($ in thousands) 2007 2006 2005
Cash flow from operating activities as reported $45,263 $58,626 $68,556
Additions to capitalized software (30,094) (27,977) (8,342)
Adjusted cash flow from operating activities $15,169 $30,649 $60,214
Cash flow from investing as reported ($57,847) ($129,062) ($17,190)
Reversal of software additions 30,094 27,977 8,342
Adjusted cash flow from investing activities ($27,753) ($101,085) ($8,848)
Years ended September 30,
operating cash flows that typically exceed income due to the inclusion of non–
cash expenses (e.g., depreciation, amortization, losses on asset sales, etc.) in
income. This expected pattern appears in ESCO’s original financial
statements, but disappears when operating cash flows are adjusted to include
capitalized software costs as shown below. Note that ESCO’s seemingly
in reported net income, an effect that will continue as long as the company’s
17–41
software expenditures keep increasing each year (as they have during the
three year period ended FY2007).
Requirement 5:
Both companies appear to establish technological feasibility (the point at which
1. state requirements
2. analyze requirements
3. design a solution approach
4. architect a software framework for that solution
5. develop code
6. test
7. deploy, and
8. Post Implementation.
After each step is finished, the process proceeds to the next step. From each
company’s software capitalization footnote, it appears that both companies
capitalize costs incurred after the completion of step 3. Companies taking a
17–42
a.
DR Software Development Costs and
Licenses
163,859
CR Cash
163,859
b.
DR Amortization expense—software
109,891
CR Software Development Costs and
Licenses
109,891
The “unidentified debit” represents a discrepancy between working capital
components of net accrual adjustments on the cash flow statement and
changes in those accounts on the balance sheet. In this case, the discrepancy
is most likely due to the effects of purchases and disposals of businesses
given (1) that Take-Two reports changes in assets and liabilities net of such
effects on its cash flow statement, and (2) that Take–Two’s cash flow statement
investing section reports an outflow in 2007 related to purchases of businesses
of $5,795.