Bl dgs. Def.
Mkt. A/R Ppd. and Acc. Inta ng. Accrd. Accrd. Def. Inc. Tx. Notes Inc. Com. Re t. Accum. Trea s .
Cas h Se c. (net) Invties . Exps. Land Imprv. Equi p. LHI Depr. Gdwi l l . & other A/P Exps. Sel f-i ns . Rev. Pyble. Pybl e. OPEB Taxes Stock Earn. OCI Stock
Ba lance 12/31/13 59,351 20,068 45,318 187,433 5,085 86,003 417,954 646,427 136,589 (775,860) 15,722 4,124 (95,128) (28,173) (23,344) (6,920) (738) 0 (12,454) (20,357) (9,949) (795,473) (4,560) 148,882
Net i ncome 62,231 (62,231)
Deprecia ti on 47,201 (47,201)
Amorti zation 6,207 (6,207)
Loss on e qui pme nt sa l e 60 (60)
Ga i n on MS s a l e (208) 208
Deferred ta xes 2,163 (2,163)
Cha nge i n A/R (7,160) 7,160
Inventori e s (35,582) 35,582
A/P 32,737 (32,737)
Taxes pa yabl e (254) 254
Accrued exps . 2,054 (2,054)
Accrd. Se l f-i ns. (1,346) 1,346
Prepai d exps . (1,169) 1,169
Deferred revenue (189) 189
Cas h flow from opera ti on
106,745
Purcha s e land and equip. (10,190) 190 20,000 (10,000)
Sa le of MS 2,197 (2,197)
Sa le of equi pment 991 (8,992) 8,001
Acquis i ti on (34,890) 5,500 16,195 2,829 19,440 5,926 (15,000)
Cas h flow from inves ti ng (41,892)
Dividends (31,231) 31,231
Purcha s e trea s ury s hares (1,973) 1,973
Cas h flow from fi na ncing
(33,204)
No effe ct 0 68 (24) (44)
Unreconciled 0 0 0 0 0 0 0 0 0 0 0 0 0 0 0 0 0 0 0 0 0 0 0 0
17–17
P17-5. Preparation and analysis of cash flow statement
Requirement 1:
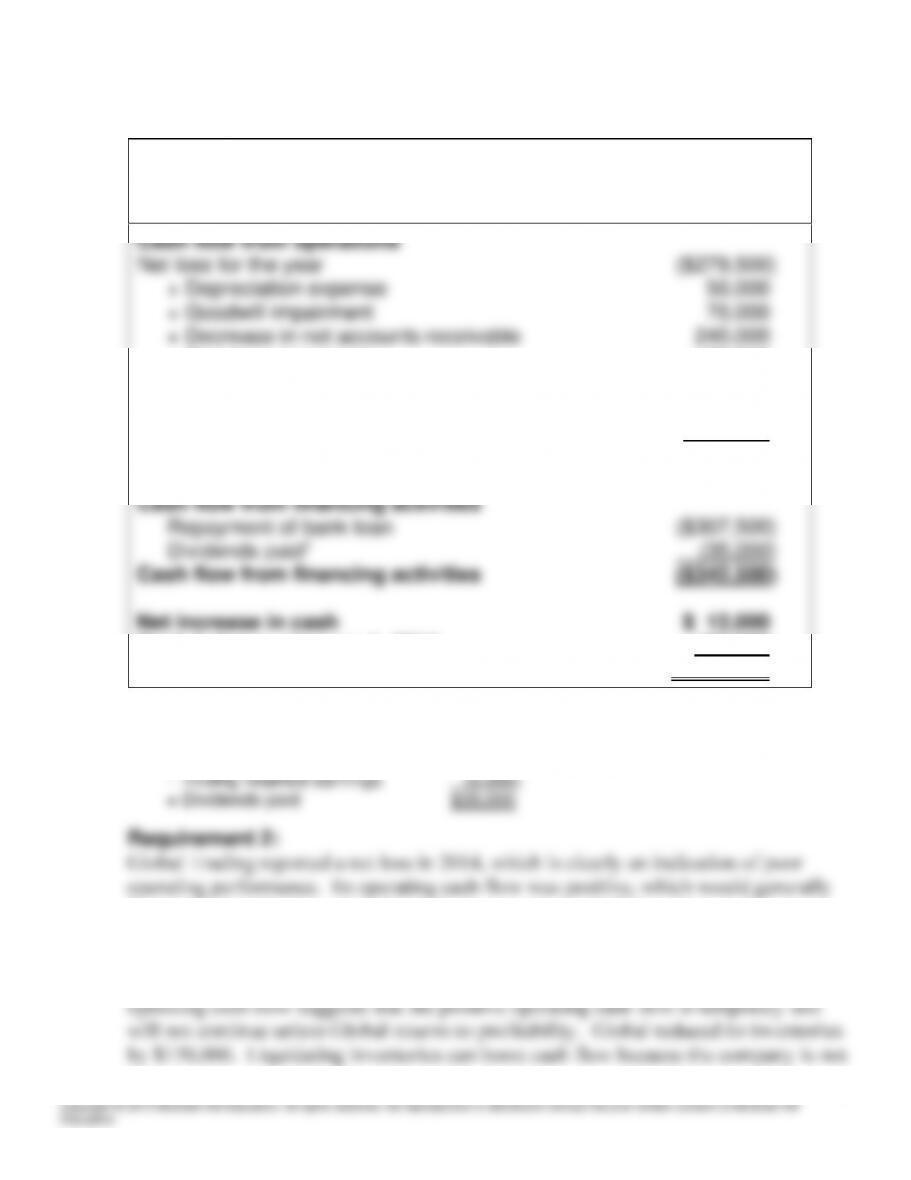
Global Trading Company
Statement of Cash Flows
For the Year Ended December 31, 2014
+ Decrease in inventory 170,000
+ Decrease in prepaid insurance 20,000
+ Increase in accounts payable 78,000
+ Increase in salaries payable 6,000
Cash flow from operations $354,500
Cash balance, January 1, 2014 108,000
Cash balance, December 31, 2014 $ 120,000
1Calculation of dividends
Beginning retained earnings $320,000
– Net loss for the year (279,500)
be a positive indication. Included in the loss was a goodwill impairment charge,
suggesting the business unit to which the goodwill pertained has declined in value.
However, examining the components of the reconciliation between net income and
17–18
incurring a cash outflow to replace inventory as it is sold. However, this strategy is not
sustainable, and inventories may now be at a level below what is needed to service
customers properly. Global also reduced its accounts receivable by $250,000. This is
likely due to poor sales so that receivables are not replenished as existing accounts are
collected. In any event, accounts receivables cannot be reduced below zero, so Global
may have been because it was required to do so, either because the loan matured or
because Global had violated a debt covenant, and not because it was redeploying
unneeded cash. Note that the maximum amount of the loan is 75% of inventories and
receivables, so that Global may have been paying down the debt in an effort to
preserve cash resources. For every dollar of inventory or receivables liquidated,
It is likely Global was not able to find a new source of funding, and so it liquidated
inventory and receivables and paid off whatever portion of the bank loan was
necessary in order to survive, at least in the short term. The financing section of the
cash flow statement also indicates that Global paid dividends in 2014, which, given the
company’s situation, seems rather imprudent.
Requirement 3:
Determination of bad debts written off can be obtained from T-account analysis
of the allowance for doubtful accounts:
Allowance for Doubtful Accounts
$30,000
Beginning balance
55,000
Bad debt expense
Accounts written off
X
$20,000
Ending balance
17–19
Solve for X:
$30,000 + $55,000 – X = $20,000
X = $65,000 = accounts written off in 2014.
Determination of credit sales for the year can be obtained from T-account
misstated. The decrease in inventory (a positive reconciling item) is overstated
and the increase in accounts payable (also a positive reconciling item) is
P17–7. Reconciling changes in balance sheet accounts with amounts reported in
the cash flow statement
Requirement 1:
17–20
Possible explanations for these differences include:
• Foreign exchange translation adjustments whereby the U.S. dollar value of
foreign currency-denominated receivables change even in the absence any
change in the underlying receivable balance.
17–21
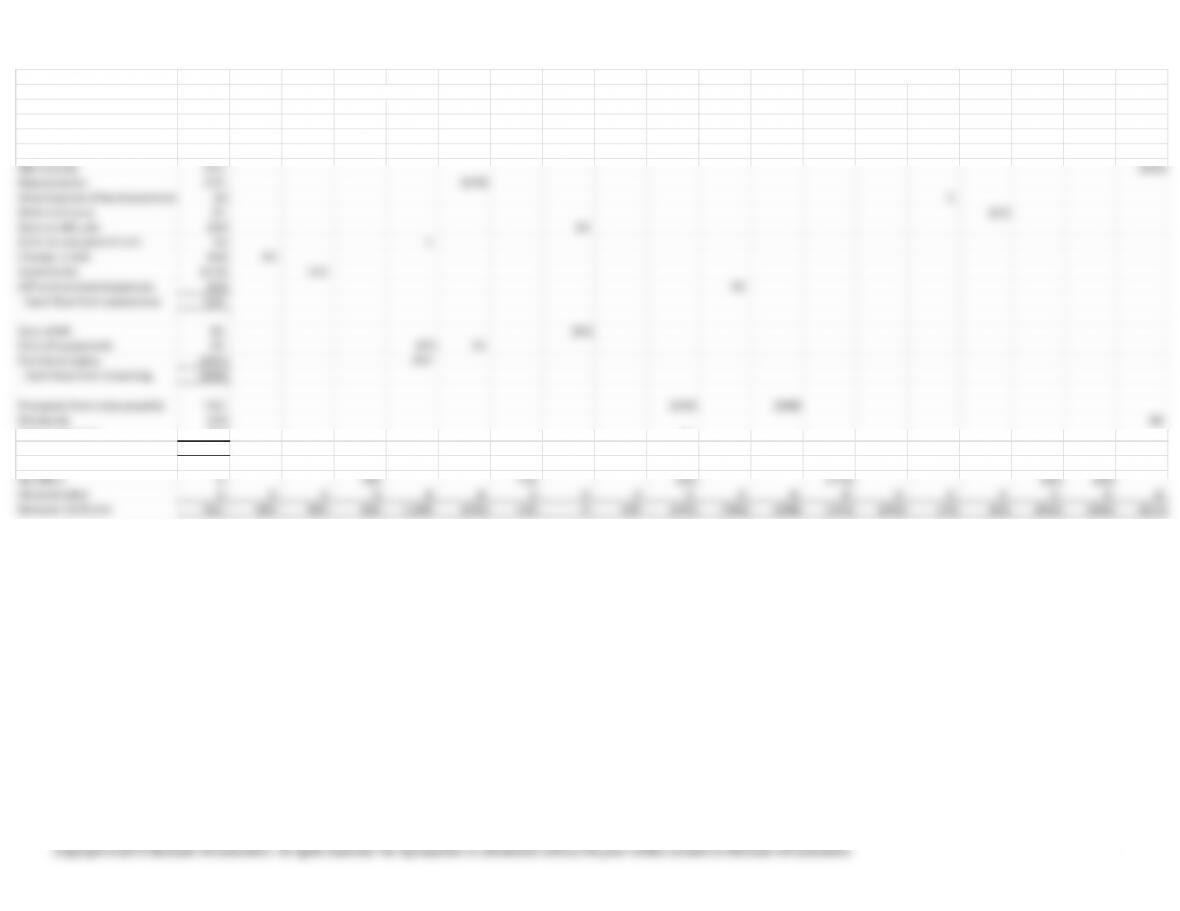
P17-7. Preparation of cash flow statement–indirect method
(AICPA adapted)
Cash flow for 2014 using the indirect method:
Bergen Corporation
Statement of Cash Flows
– Amortization of bond premium (2,000)
+ Increase in deferred income taxes payable 15,000
– Gain on sale of securities (20,000)
– Gain on sale of equipment (5,000)
– Increase in accounts receivable, net (90,000)
Sale of securities 95,000
Sale of equipment 33,000
Purchase of equipment (392,000)
Net cash outflow from investing activities (264,000)
Financing Activities:
17–22
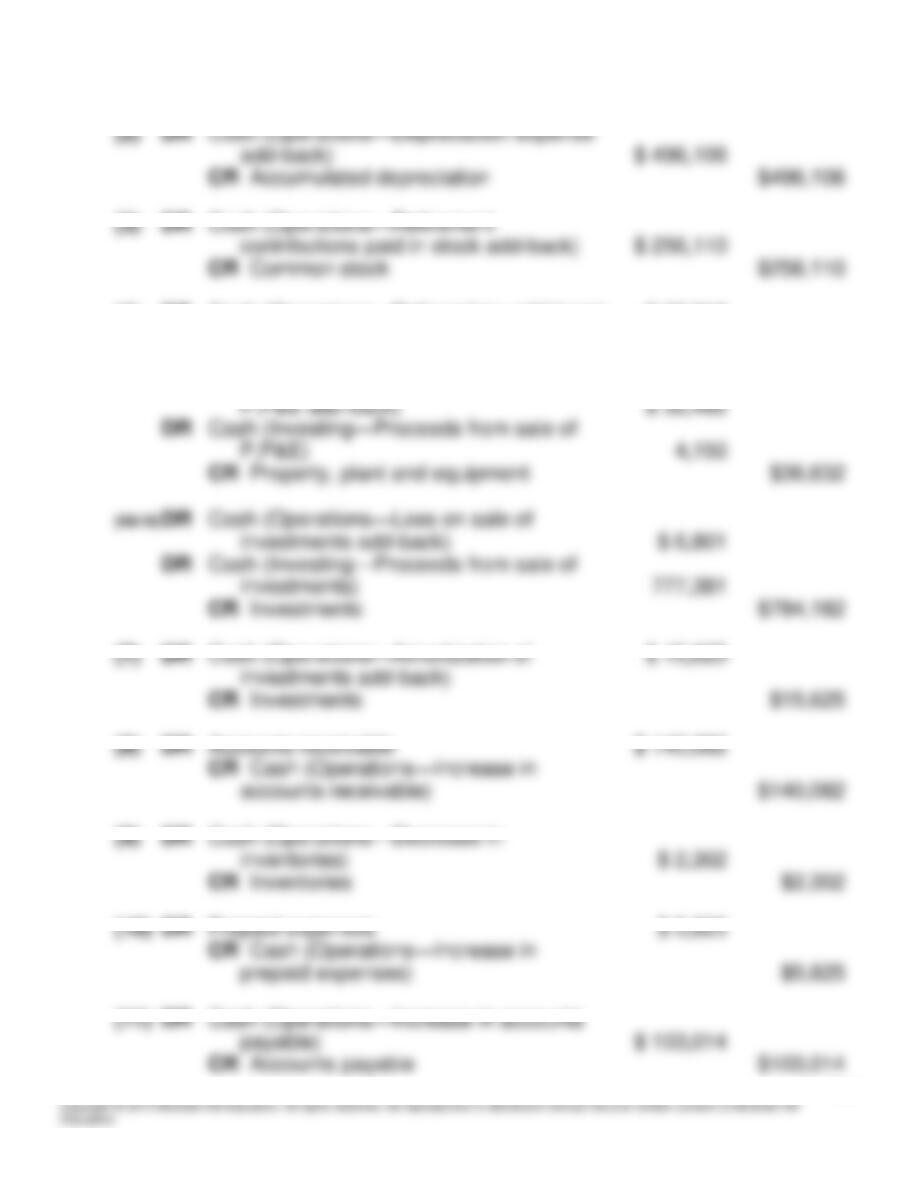
Capital Current A/P and Capital Unamort.
A/R Plant and Acc. Lease Market. Invest in Portion Accrued Lease Bond Bond Def. Com. Ret.
($ in thousands) Cash (net)
Inventory
Land Equipmt. Depr. Assets Secties. Mason LTD Expenses N/P
Obligation
Payable Premium Inc. Tax Stock APIC Earn.
Balance 12/31/13 308 495 780 250 720 (170) 0 75 180 0 (823) 0 0 (500) (18) (45) (600) (244) (408)
Net income 253 (253)
Depreciation 149 (149)
Amortization of bond premium (2) 2
Deferred taxes 15 (15)
Gain on MS sale (20) 20
Gain on equipment sale (5) 5
Change in A/R (90) 90
Inventories (115) 115
A/P and accrued expenses (63) 63
Cash flow from operations 122
Sale of MS 95 (95)
Sale of equipment 33 (57) 24
Purchase equip. (392) 392
Cash flow from investing (264)
Proceeds from note payable 450 (150) (300)
Dividends (50) 50
Lease payment (25) 25
Cash flow from financing 375
No effect 0 100 158 (34) (124) (40) (60)
Unreconciled 0 0 0 0 0 0 0 0 0 0 0 0 0 0 0 0 0 0 0
Balance 12/31/14 541 585 895 350 1,060 (295) 158 0180 (159) (760) (300) (124) (500) (16) (60) (640) (304) (611)
17–23
P17-8. Working backward from the statement of cash flows
(2)
DR
Cash (Operations—Depreciation expense
add-back)
$ 496,106
CR Accumulated depreciation
$496,106
(3)
DR
Cash (Operations—Retirement
contributions paid in stock add-back)
$ 256,110
CR Common stock
$256,110
(4)
DR
Cash (Operations—Deferred tax add-back)
$ 27,018
CR Deferred income taxes
$27,018
(5&16)
DR
Cash (Operations—Loss on disposal of
P,P&E add-back)
$ 32,482
DR
Cash (Investing—Proceeds from sale of
P,P&E)
4,150
CR Property, plant and equipment
$36,632
(6&18)
DR
Cash (Operations—Loss on sale of
investments add-back)
$ 6,801
DR
Cash (Investing—Proceeds from sale of
investments)
777,381
CR Investments
$784,182
(7)
DR
Cash (Operations—Amortization of
investments add-back)
$ 15,625
CR Investments
$15,625
(8)
DR
Accounts receivable
$ 140,082
CR Cash (Operations—Increase in
accounts receivable)
$140,082
(9)
DR
Cash (Operations—Decrease in
inventories)
$ 2,302
CR Inventories
$2,302
(10)
DR
Prepaid expenses
$ 5,825
CR Cash (Operations—Increase in
prepaid expenses)
$5,825
(11)
DR
Cash (Operations—Increase in accounts
payable)
$ 103,014
CR Accounts payable
$103,014
17–24
(12)
DR
Self-insurance reserves
$ 14,381
CR Cash (Operations—Decrease in self-
insurance reserves)
$14,381
(13)
DR
Cash (Operations—Increase in Federal
and state income taxes)
$ 33,186
CR Federal and state income taxes
$33,186
(14)
DR
Cash (Operations—Increase in other
noncurrent liabilities)
$ 24,434
CR Other noncurrent liabilities
$24,434
(15)
DR
Property, plant and equipment
$ 693,489
CR Cash (Investing—acquisition of
P,P&E)
$693,489
(17)
DR
Investments
$ 1,133,449
CR Cash (Investing—acquisition of
investments)
$1,133,449
(19)
DR
Common stock
$ 629,453
CR Cash (Financing—payment for
common stock)
$629,453
(20)
DR
Cash (Financing—proceeds from sale of
common stock)
$ 152,096
CR Common stock
$152,096
(21)
DR
Retained earnings
$ 325,295
CR Cash (Financing—payment of
dividends)
$325,295
(22)
DR
Cash (Financing—proceeds from other,
net)
$ 18,530
CR Other, net
$18,530
17–25
P17-9. Preparing a statement of cash flows—indirect method
(AICPA adapted)
Omega Corporation
Statement of Cash Flows
Loan to Chase Co. (300,000)
Principal payment of loan receivable 30,000
Net cash used in investing activities (230,000)
Cash Flows from Financing Activities:
17–26
1Depreciation
Net increase in accumulated depreciation
for the year ended December 31, 2014 $125,000
Accumulated depreciation on equipment sold:
17–27
Copyright © 2015 McGraw-Hill Education. All rights reserved. No reproduction or distribution without the prior written consent of McGraw-Hill Education.
Property Capital
A/R Plant and Acc. Invest. Loan Inc. Tax Divds. Lease Capital Ret.
($ in thousands) Cash (net) Inventory Equipmt. Depr. in Belle Receiv. A/P Payable Payable
Obligation
Stock APIC Earn.
Balance 12/31/13 700 1,168 1,715 2,967 (1,040) 275 0 (955) (50) (90) 0 (500) (1,500) (2,690)
Net income 360 (360)
Depreciation 150 (150)
Gain on sale of equipment (5) 5
Income from Belle (30) 30
Change in accounts receivable 40 (40)
Change in inventory (135) 135
Change in accounts payable 60 (60)
Change in taxes payable (20) 20
Cash flow from operations 420
Proceeds on equipment sale 40 (65) 25
Investment in Chase debt (300) 300
Principal payments received from Chase 30 (30)
Cash flow from investing (230)
Dividends (90) 10 80
Cash flow from financing (90)
No effect 0 400 (400)
Unreconciled 0 0 0 0 0 0 0 0 0 0 0 0 0 0
Balance 12/31/14 800 1,128 1,850 3,307 (1,165) 305 270 (1,015) (30) (80) (400) (500) (1,500) (2,970)
17–28
P17-10. Operating cash flow impact of securitization
Requirement 1:
Use the data presented in the problem to first determine gross accounts
receivable:
3/3/YR3 3/4/YR2 2/26/YR1
Accounts receivable 404,739 387,285 514,671
Allowance for uncollectible accounts 30,246
32,336
31,216
Accounts receivable, net 374,493 354,949 483,455
SELECTED DATA PERTAINING TO ACCOUNTS RECEIVABLE
Year Ended
Next, determine the amount of accounts receivable written off during Year
3:
Allowance for Doubtful Accounts
during YR3 (plug)
(given)
Ending balance
Accounts Receivable
Beginning balance
$ 387,285
$ 20,000
Securitizations in YR3
Credit sales for YR3
17,507,719
28,693
Accounts written off
during YR3
17,441,572
Collections from
customers during YR3
Ending balance
404,739
Requirement 2:
3/3/YR3 3/4/YR2 2/26/YR1
Net cash provided by operating activities 309,145 417,165 518,446
Less: Net proceeds from securitizations (20,000) (180,000) (150,000)
Operating cash restated without securitization 289,145 237,165 368,446
% increase in operating cash from securitization 6.92% 75.90% 40.71%
Year Ended
$ 32,336
Beginning balance
Accounts written off
28,693
26,603
Bad debts expense for YR3
While the impact of securitization on operating cash flows for fiscal Year 3 might not be
considered material, the increases in the two prior years certainly were.
Requirement 3:
3/3/YR3 3/4/YR2 2/26/YR1
Revenue 17,507,719$ 17,270,968$ 16,816,439$
Cost of Goods Sold 12,791,597 12,571,860 12,202,894
Selling, General & Aadministrative expenses 4,370,481 4,307,421 4,127,536
Interest expense 275,219 277,017 294,871
Pretax Income from continuing operations 70,422$ 114,670$ 191,138$
Year Ended
A healthy business should produce positive operating cash flows and these cash flows