10–16
P10–7. Determining asset impairment
Requirement 1:
Book value:
= $35,000,000 – [($35,000,000/7) x 4]
P10-8. Determining asset impairment
Requirement 1:
Assets should be tested for impairment whenever events or circumstances
indicate that the asset’s carrying value might be impaired. In this case, due to
10–17
Estimated annual future net cash flow
$1,050,000
Remaining life of yacht (years)
x 9
Undiscounted future net cash flow
$9,450,000
10–18
P10-9. Determining asset impairment under IFRS
Requirement 2:
The following impairment test indicates that Yachting in Paradise’s yacht is
impaired:
$6.6 million.
The yacht is impaired since its recoverable value is below its carrying value.
An asset’s impairment is measured by reference to its recoverable value (see
requirement 2).
10–19
= ($6,600,000 − $0 salvage) ÷ 9 = $733,333/year depreciation
= $733,333 x 2 years [2014 through 2015 inclusive] = $1,466,666
= $6,600,000 − $1,466,666 = $5,133,334 book value in early 2016
10–20
P10–10. Accounting for computer software costs
Requirement 1:
Until the technological feasibility of the product is proven, all costs are
expensed as R&D. After technological feasibility is proven, the costs are
supposed to be capitalized up to the point the product is made available for
determine the costs incurred after technological feasibility has been shown
(see Requirement 3), we cannot know how much IBM expended up to the
point that technological feasibility was reached on the various projects.
Requirement 3:
$2,419 + $11,276 = $13,695
Y = $3,541, where Y is the credit to accumulated amortization. The offsetting
DR of $3,541 is the estimate of IBM’s amortization in Year 2.
Requirement 5:
Total capitalized software at the end of Year 2/software amortization for Year
2:
($2,419 + $11,276)/$3,058 = 4.48 (about 4-1/2 years).
10–21
P10–11. Recognizing asset impairment
The $140 million accumulated depreciation is determined as follows (in
millions):
Cost 300$
Less: Expected
salvage value
– (60)
Cost to recover 240$
Economic life ÷ 12
Depreciation per year 20$
Years in use × 7
Accumulated
depreciation
140
Consequently, the book value is $160 million ($300 million Cost less $140
million Accumulated depreciation).
Requirement 1:
The asset is not impaired, and no loss needs to be recognized. The
undiscounted present value of the future cash flows from the Supersweet
patent are:
[($58.7 + 64.3 + 70.7 + 77.8 + 85.6) x 0.50] + $25.0 = $203.55
Since $203.55 is greater than the book value of the patent, no impairment of
the asset has occurred.
Requirement 2:
The asset is impaired, and a loss needs to be recognized. The undiscounted
present value of the future cash flows from the Supersweet patent are:
$160.0 – $68.0 = $92.0 million
10–22
Copyright © 2015 McGraw-Hill Education. All rights reserved. No reproduction or distribution without the prior written consent of McGraw-Hill Education.
The loss would be recognized in National Sweetener’s 2014 income
statement, and the patent would be reported at $68.0 million in the firm’s 2014
ending balance sheet.
P10-12. Capitalizing interest
Requirement 1:
($80,000,000 x 0.13) + ($200,000,000 x 0.115) = $33,400,000.
Requirement 2:
($80,000,000 x 0.13) + ($70,000,000 x 0.115) = $18,450,000.
($33,400,000 interest divided by $280,000,000 total debt). This approach
yields capitalized interest of $17,895,000 ($150,000,000 x 0.1193). A firm
would have to use one of the approaches consistently. We use $18,450,000 in
subsequent calculations.
Requirement 3:
progress account.
Requirement 5:
$33,400,000 – 18,450,000 = $14,950,000.
Requirement 6:
The amount of capitalized interest will reduce future earnings over the useful
= 3.34 times
10–23
Copyright © 2015 McGraw-Hill Education. All rights reserved. No reproduction or distribution without the prior written consent of McGraw-Hill Education.
Interest coverage ratio without interest capitalization:
= $50,000,000/$33,400,000
= 1.50 times
P10-13. Accounting for internally developed patents versus purchased patents
Note to Instructor: Although the specific case relates internally developed
versus purchased patents, the case can be used to illustrate why firms in
different industries have different ratios, how an acquisition could change
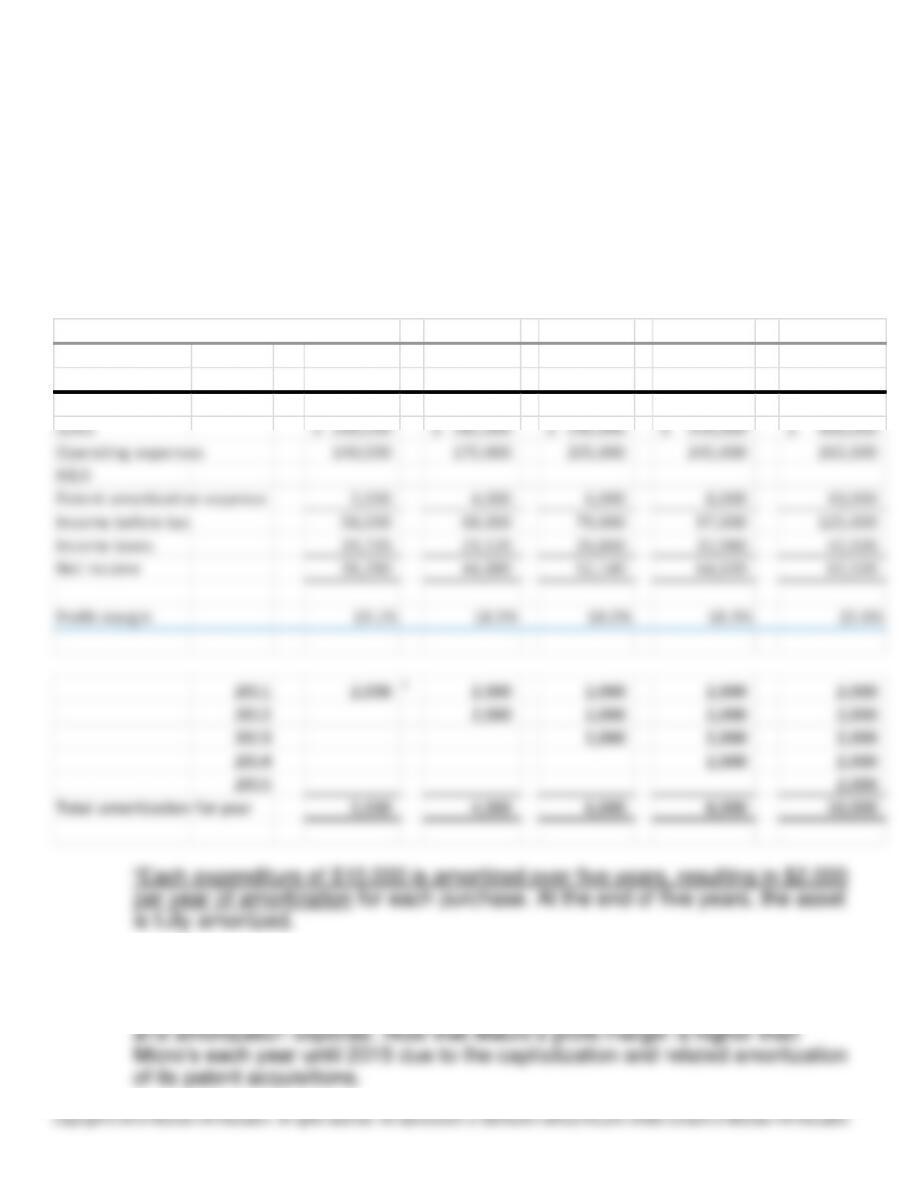
a$17,000 income taxes = 34% tax rate x $50,000 income before tax.
b16.5% profit margin = $33,000 net income ÷ $200,000 sales.
10–24
Macro Systems Inc.
Macro Systems Inc. – purchased patents
($ in thousands) 2011 2012 2013 2014 2015
Sales 200,000$ 242,000$ 290,000$ 350,000$ 400,000$
Operating expenses 140,000 170,000 205,000 245,000 265,000
R&D
Patent amortization expense 2,000 4,000 6,000 8,000 10,000
Income before tax 58,000 68,000 79,000 97,000 125,000
Income taxes 19,720 23,120 26,860 32,980 42,500
Net income 38,280 44,880 52,140 64,020 82,500
Profit margin 19.1% 18.5% 18.0% 18.3% 20.6%
2011 2,000 c2,000 2,000 2,000 2,000
2012 2,000 2,000 2,000 2,000
2013 2,000 2,000 2,000
2014 2,000 2,000
2015 2,000
Total amortization for year 2,000 4,000 6,000 8,000 10,000
cEach expenditure of $10,000 is amortized over five years, resulting in $2,000
per year of amortization for each purchase. At the end of five years, the asset
is fully amortized.
Macro Systems’s profit margin falls over the first 3 years as the patent
amortization expense increases each year. In 2014 and 2015, it increases as
the increase in sales is enough to offset the increase in operating expenses
10–25
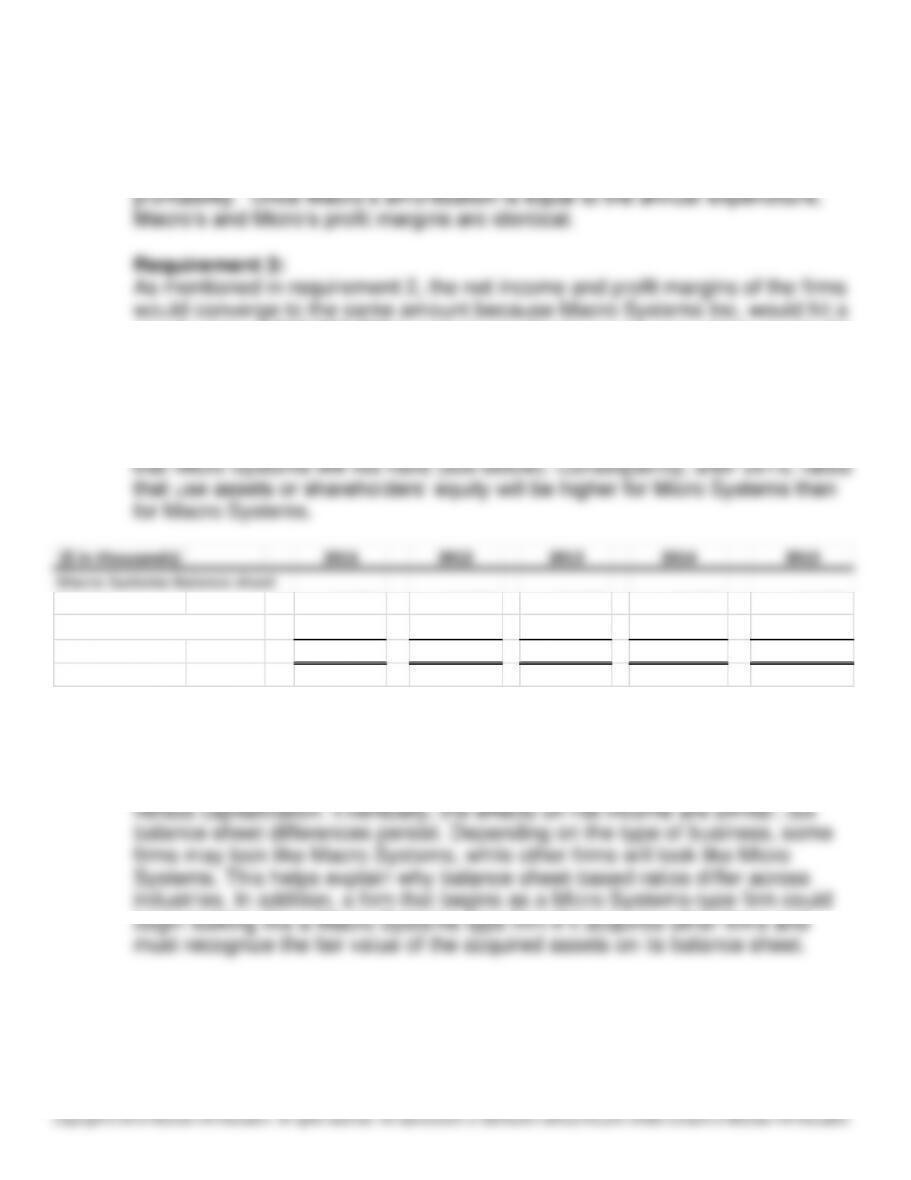
The key aspect of this analysis for the financial analyst is that while the two
firms were otherwise identical (i.e., same sales, operating expenses, and tax
rate), the fact that one firm performed its own R&D while the other purchased
it from other firms led to some important differences in their apparent
steady state of $10,000,000 in patent amortization each year which equals the
$10,000,000 spent on R&D by Micro Systems. Thus, the differences noted in
Requirement 2 become less important over time if R&D expenditures are
stable for the two firms.
However, Macro Systems will have $20,000 in net assets on its balance sheet
10–26
P10–14. Determining earnings effects of changes in useful lives and salvage
values – SL
Requirement 1:
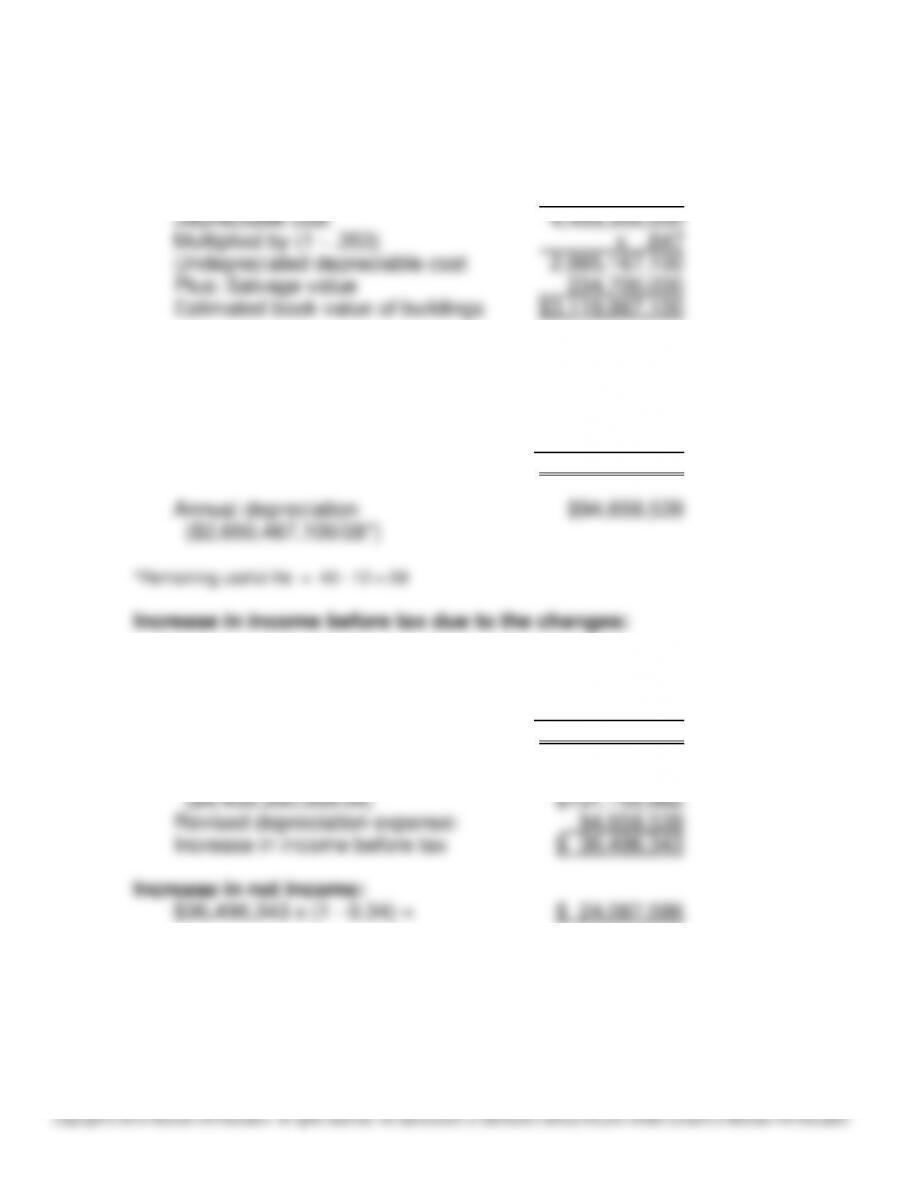
Original cost of buildings $4,694,000,000
Less: Salvage value (5% of costs) 234,700,000
Requirement 2:
Revised depreciation schedule:
Book value after 12 years $3,119,867,100
Less: Salvage value (10% of Cost) 469,400,000
Amount to depreciate $2,650,467,100
Old depreciation expense:
Original cost of buildings $4,694,000,000
Less: salvage value (5% of cost) 234,700,000
Amount to depreciate $4,459,300,000
Annual depreciation
10–27
P10–15. Identifying straight-line versus accelerated depreciation ratio effects –
SL and SYD
Requirement 1:
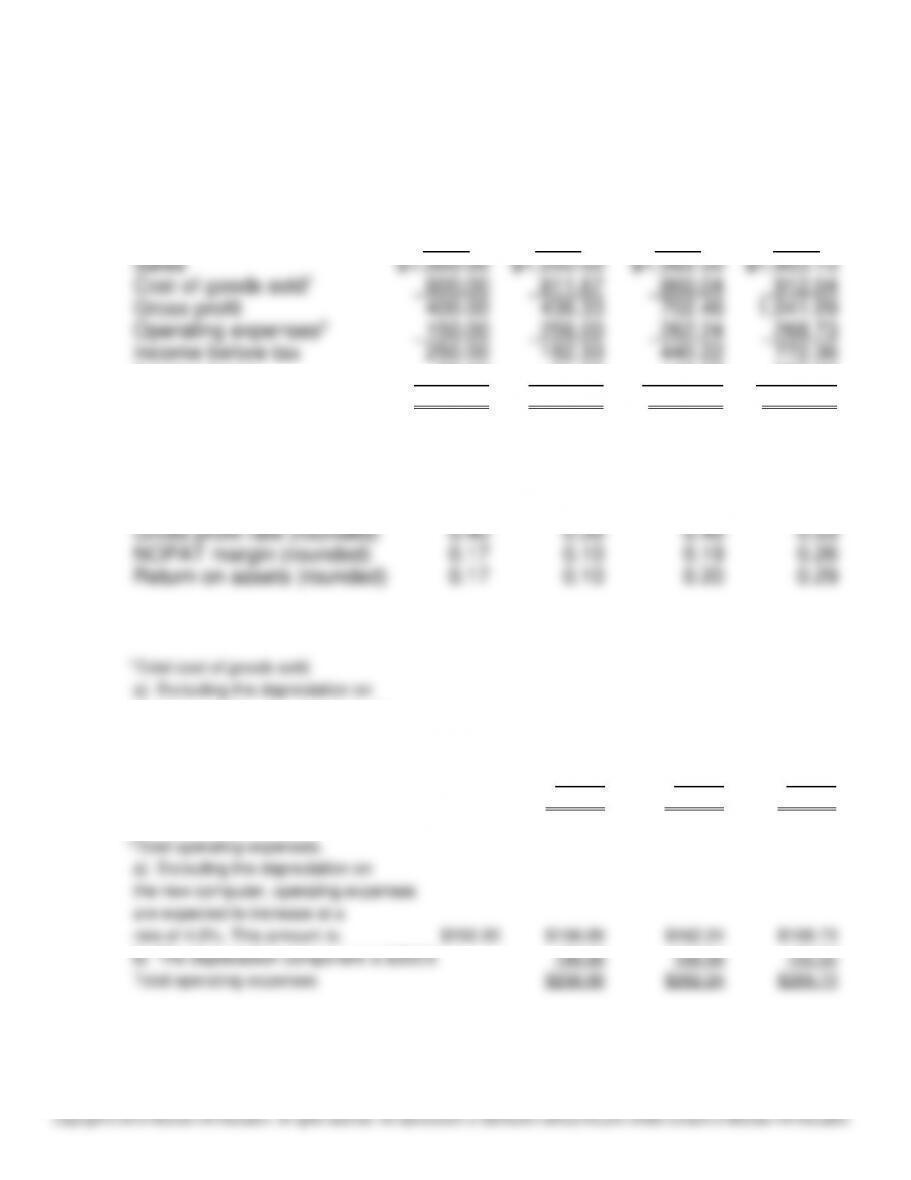
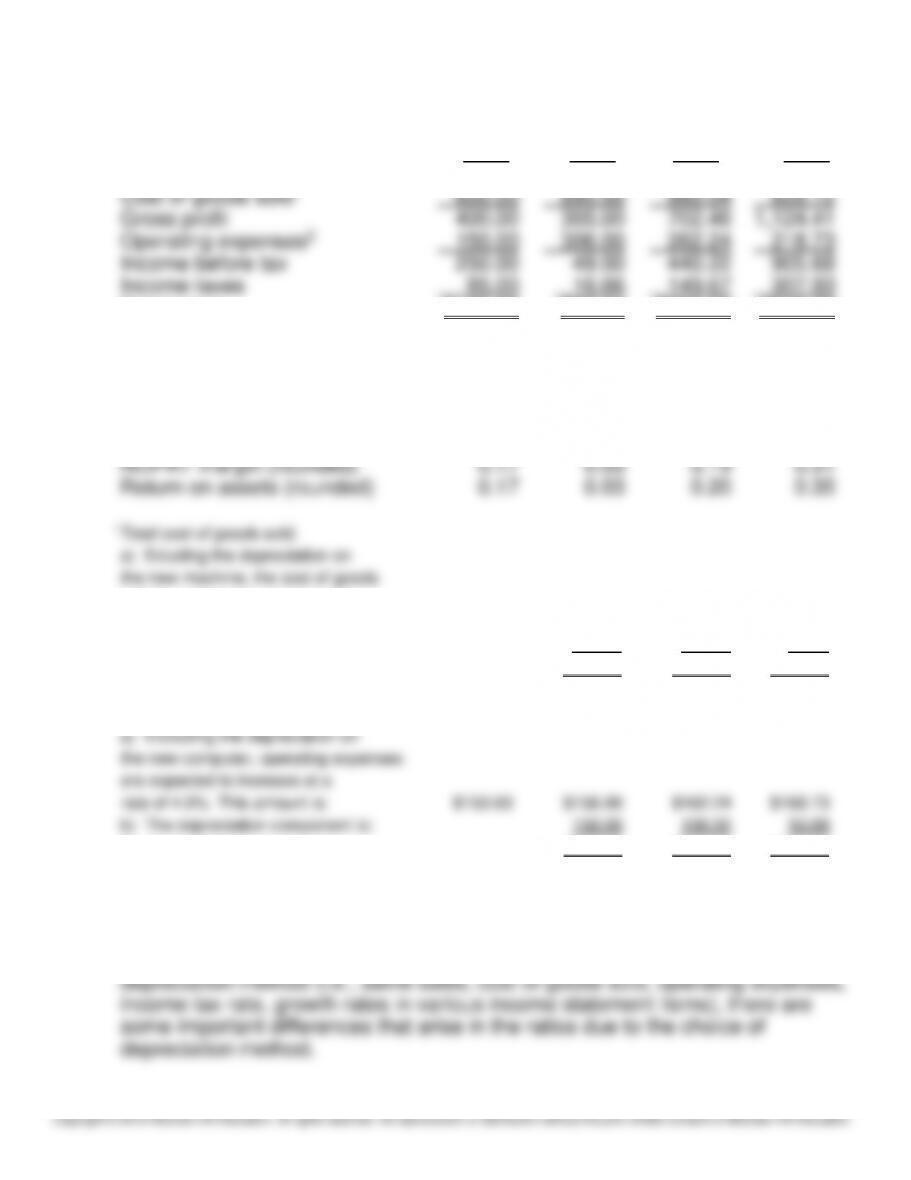
The solution under straight-line depreciation is:
SL Method 2013 2014 2015 2016
Income taxes 85.00 61.99 149.67 262.60
Net income $165.00 $120.34 $290.55 $509.76
Cost of machine $500.00
Cost of new computer $300.00
Average total assets $1,000.00 $1,200.00 $1,440.00 $1,728.00
the new machine, the cost of goods
sold is expected to increase at a
rate of 7.5%. This amount is: $600.00 $645.00 $693.38 $745.38
b) The depreciation component is $500/3 166.67 166.66 166.66
Total cost of goods sold $811.67 $860.04 $912.04
10–28
Requirement 2:
The solution under sum-of–years’ digits is:
SOYD Method 2013 2014 2015 2016
Sales $1,000.00 $1,250.00 $1,562.50 $1,953.13
Net income $165.00 $32.34 $290.55 $597.75
Cost of new machine $500.00
Cost of new computer system $300.00
Average total assets $1,000.00 $1,200.00 $1,440.00 $1,728.00
Gross profit rate (rounded) 0.40 0.28 0.45 0.58
sold is expected to increase at a
rate of 7.5%. This amount is: $600.00 $645.00 $693.38 $745.38
b) The depreciation component is: 250.00 166.66 83.34
Total cost of goods sold $895.00 $860.04 $828.72
2Total operating expenses.
Total operating expenses $306.00 $262.24 $218.73
Requirement 3:
The ratios are shown in the schedules in Requirements 1 and 2. With regard to
the differences between the ratios of the two firms, the following points are
worth noting. While the firms are otherwise identical except for the choice of
10–29
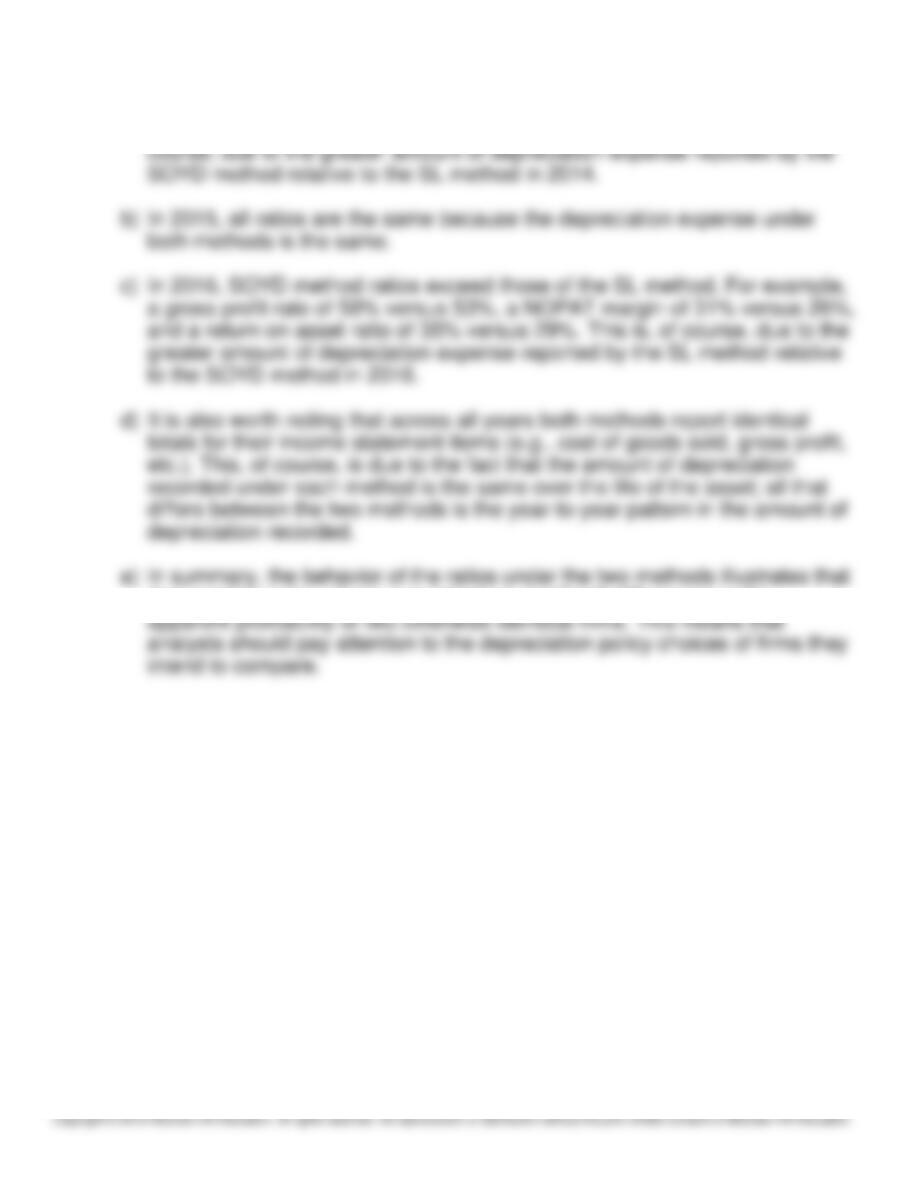
a) In 2014, SL method ratios significantly exceed those of the SOYD method.
For example, a gross profit rate of 35% versus 28%, a NOPAT margin of
10% versus 3%, and a return on asset ratio of 10.0% versus 3%. This is, of
depreciation policy choice can introduce “artificial” differences in the
10–30
Copyright © 2015 McGraw-Hill Education. All rights reserved. No reproduction or distribution without the prior written consent of McGraw-Hill Education.
P10–16. Making asset age and intercompany comparisons
Requirement 1:
ROA for Gardenia Co. (000s omitted):
Jan. 1
Dec. 31
Dec. 31
Dec. 31
Dec. 31
Dec. 31
2014
2014
2015
2016
2017
2018
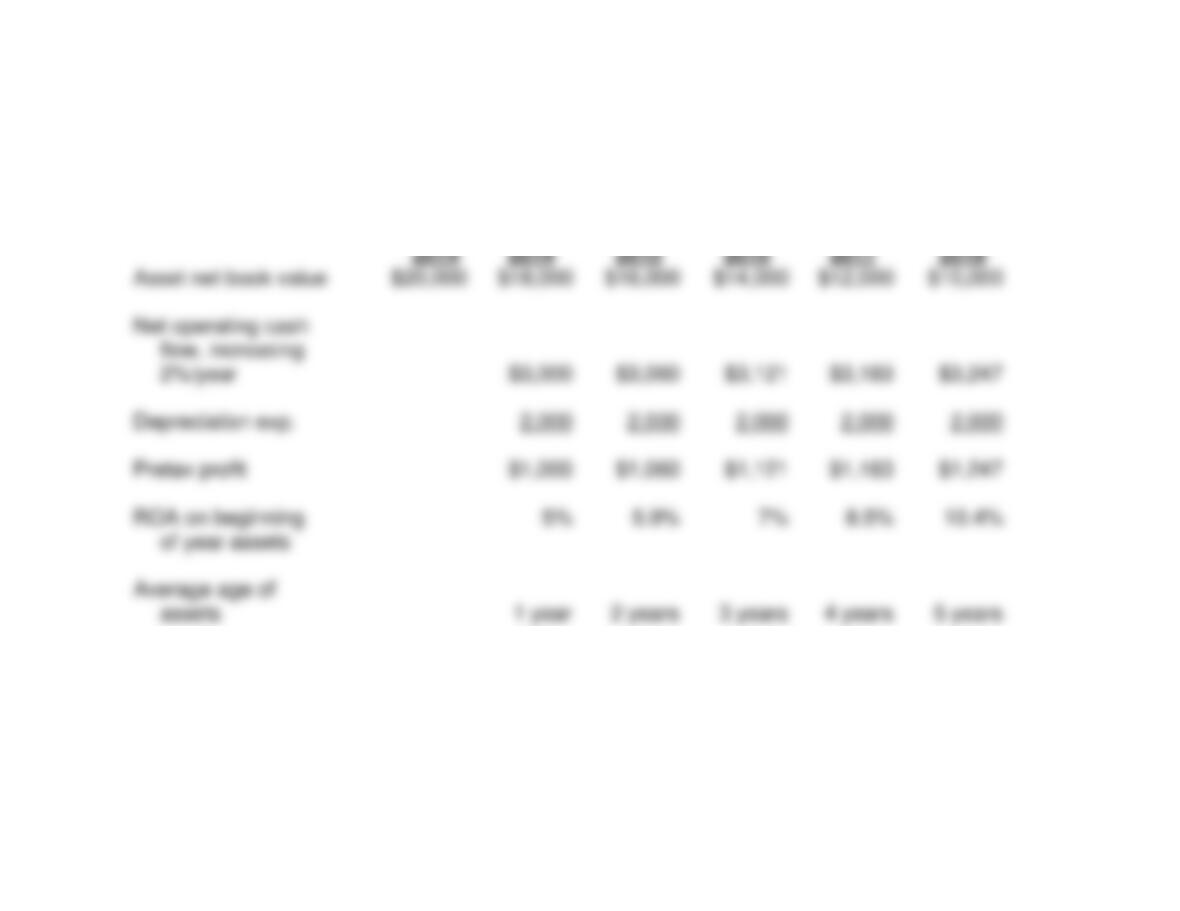
Asset net book value
$20,000
$18,000
$16,000
$14,000
$12,000
$10,000
Net operating cash
flow, increasing
2%/year
$3,000
$3,060
$3,121
$3,183
$3,247
Depreciation exp.
2,000
2,000
2,000
2,000
2,000
Pretax profit
$1,000
$1,060
$1,121
$1,183
$1,247
ROA on beginning
5%
5.9%
7%
8.5%
10.4%
of year assets
Average age of
assets
1 year
2 years
3 years
4 years
5 years