Problem 5-31 (continued)
2.
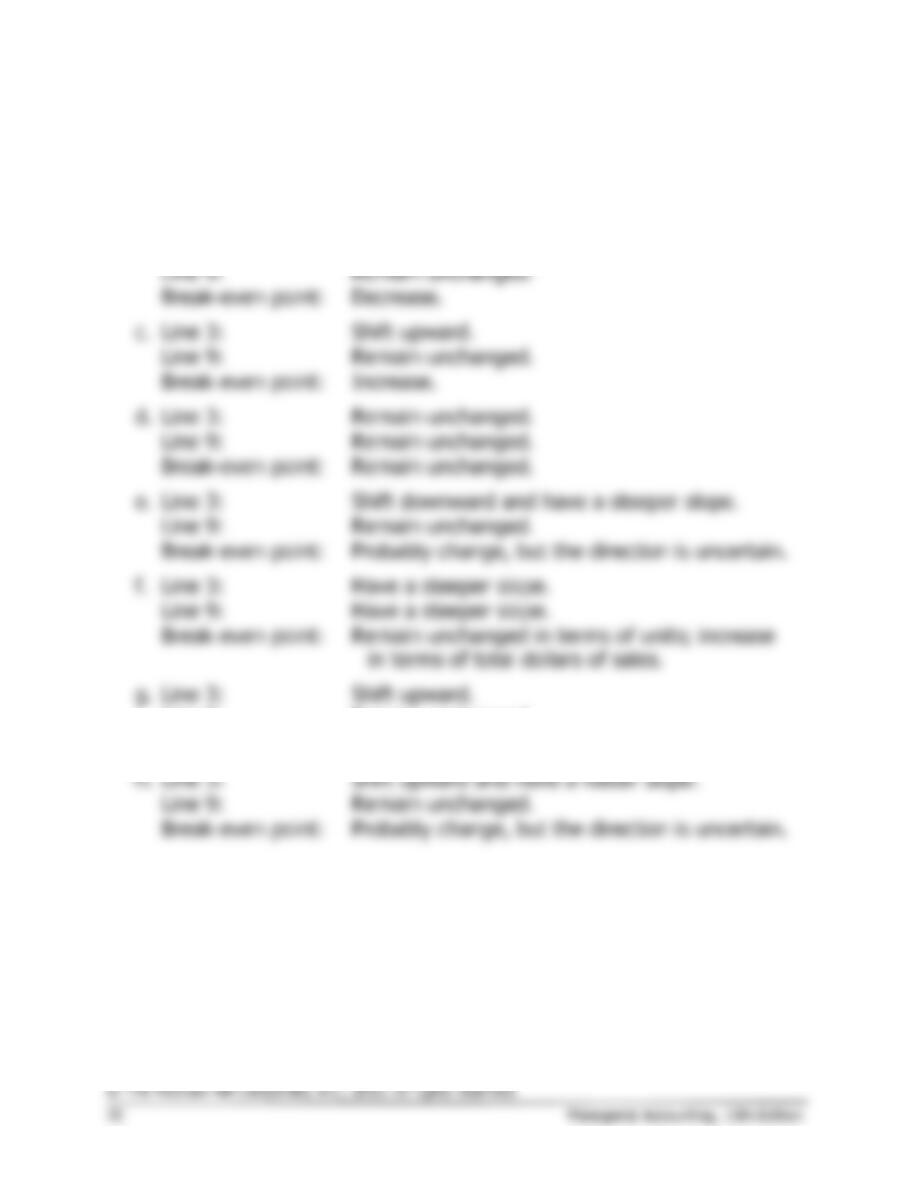
a.
Line 3:
Remain unchanged.
Line 9:
Have a steeper slope.
Break-even point:
Decrease.
b.
Line 3:
Have a flatter slope.
Line 9:
Remain unchanged.
Break-even point:
Decrease.
c.
Line 3:
Shift upward.
Line 9:
Remain unchanged.
Break-even point:
Increase.
d.
Line 3:
Remain unchanged.
Line 9:
Remain unchanged.
Break-even point:
Remain unchanged.
e.
Line 3:
Shift downward and have a steeper slope.
Line 9:
Remain unchanged.
Break-even point:
Probably change, but the direction is uncertain.
f.
Line 3:
Have a steeper slope.
Line 9:
Have a steeper slope.
Break-even point:
Remain unchanged in terms of units; increase
in terms of total dollars of sales.
g.
Line 3:
Shift upward.
Line 9:
Remain unchanged.
Break-even point:
Increase.
h.
Line 3:
Shift upward and have a flatter slope.
Line 9:
Remain unchanged.
Break-even point:
Probably change, but the direction is uncertain.
Case 5-32 (60 minutes)
Note: This is a problem that will challenge the very best students’ conceptual
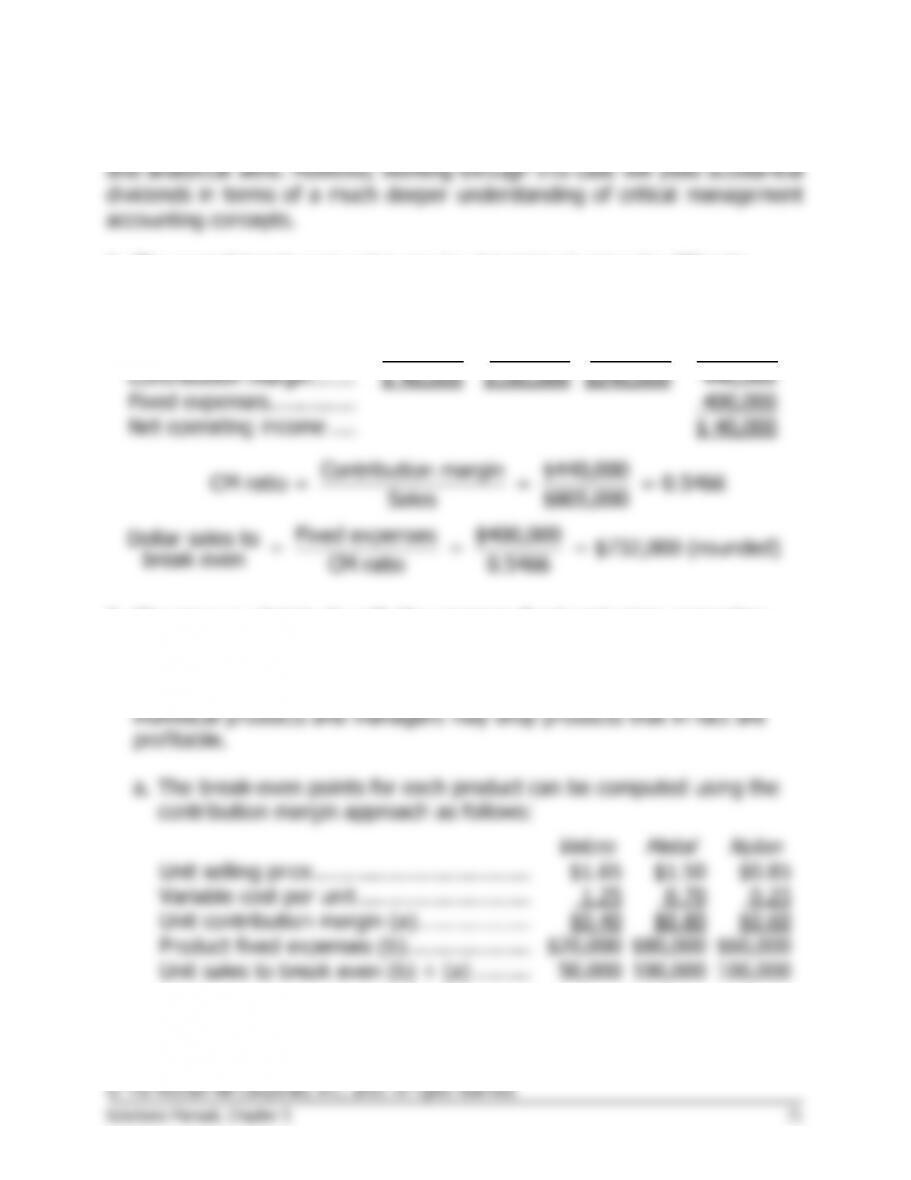
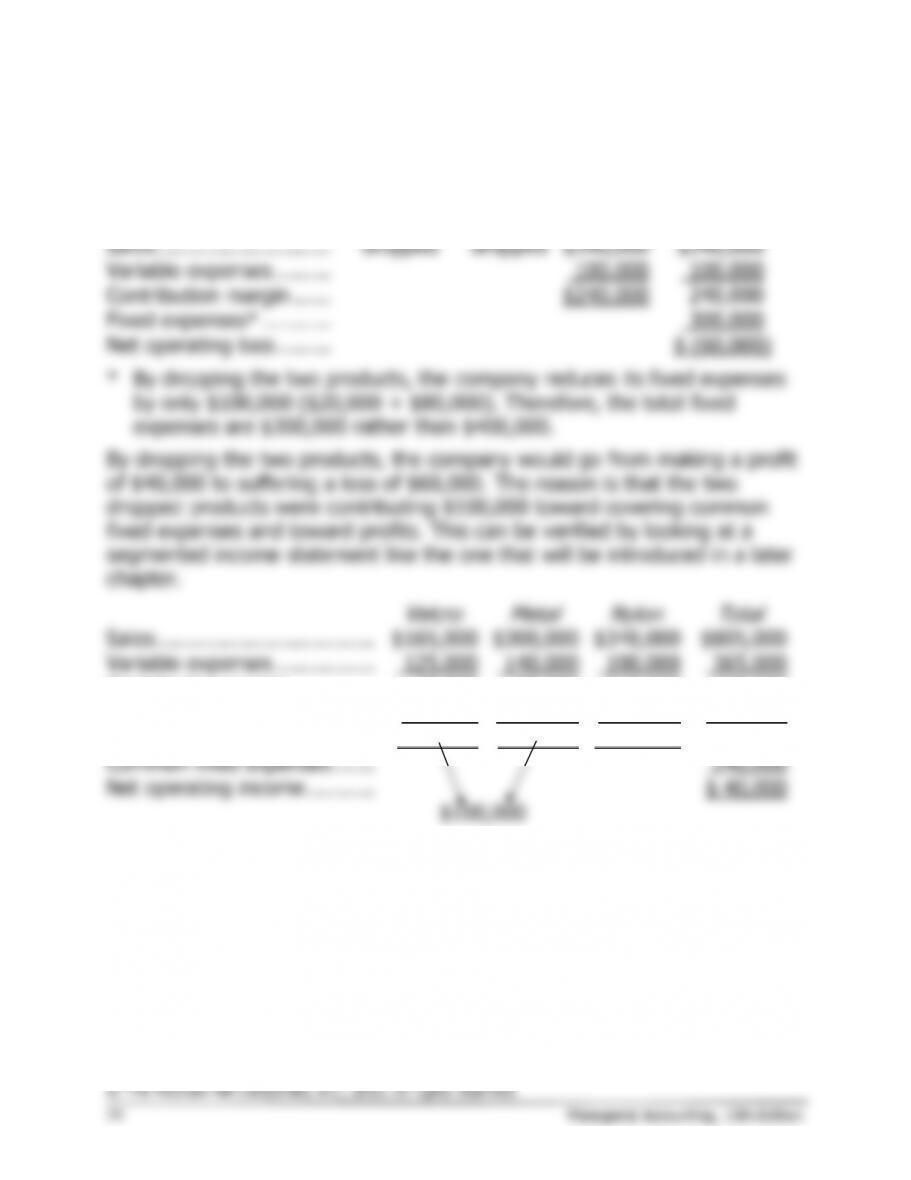
1. The overall break-even sales can be determined using the CM ratio.
Velcro
Metal
Nylon
Total
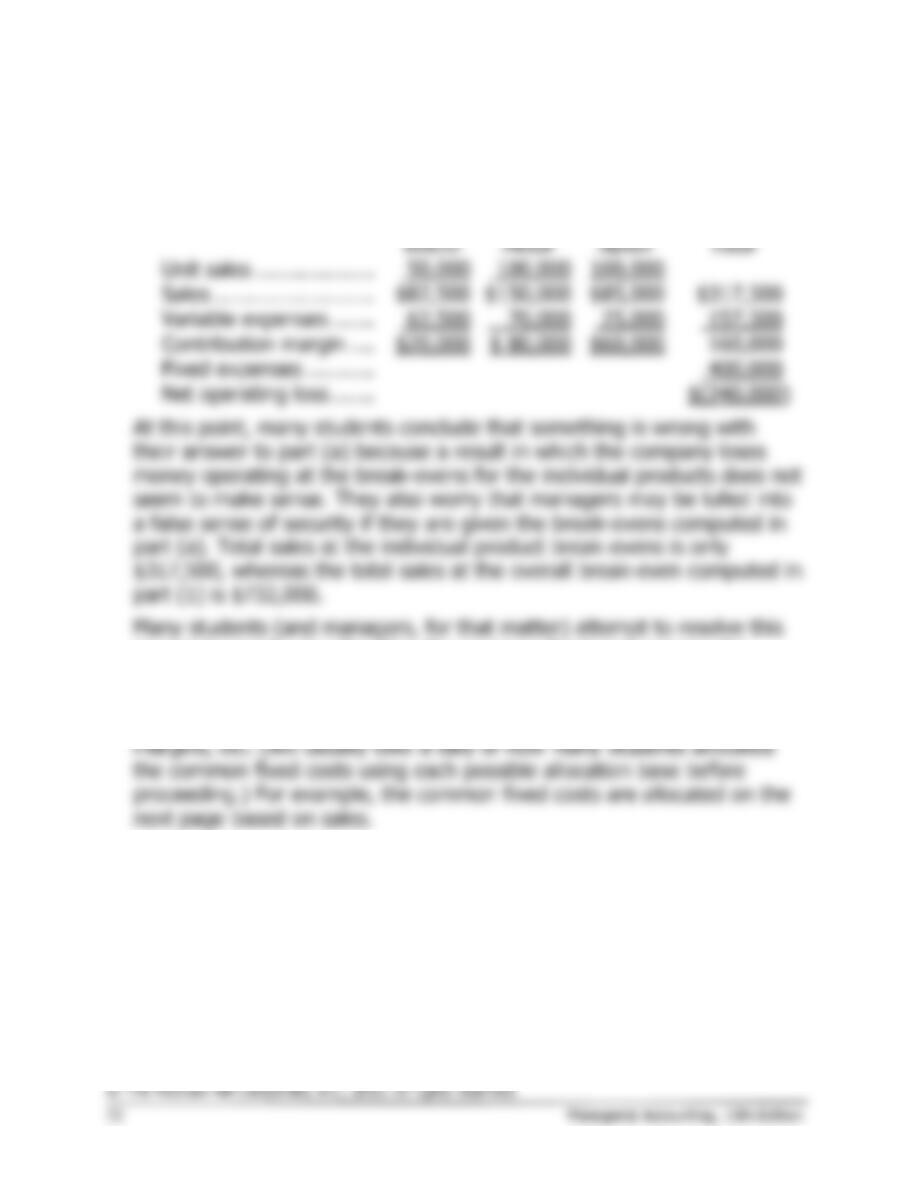
Sales ……………………….
$165,000
$300,000
$340,000
$805,000
Variable expenses ………
125,000
140,000
100,000
365,000
Contribution margin …….
$ 40,000
$160,000
$240,000
440,000
Fixed expenses…………..
400,000
Net operating income ….
$ 40,000
Contribution margin $440,000
CM ratio = = = 0.5466
Sales $805,000
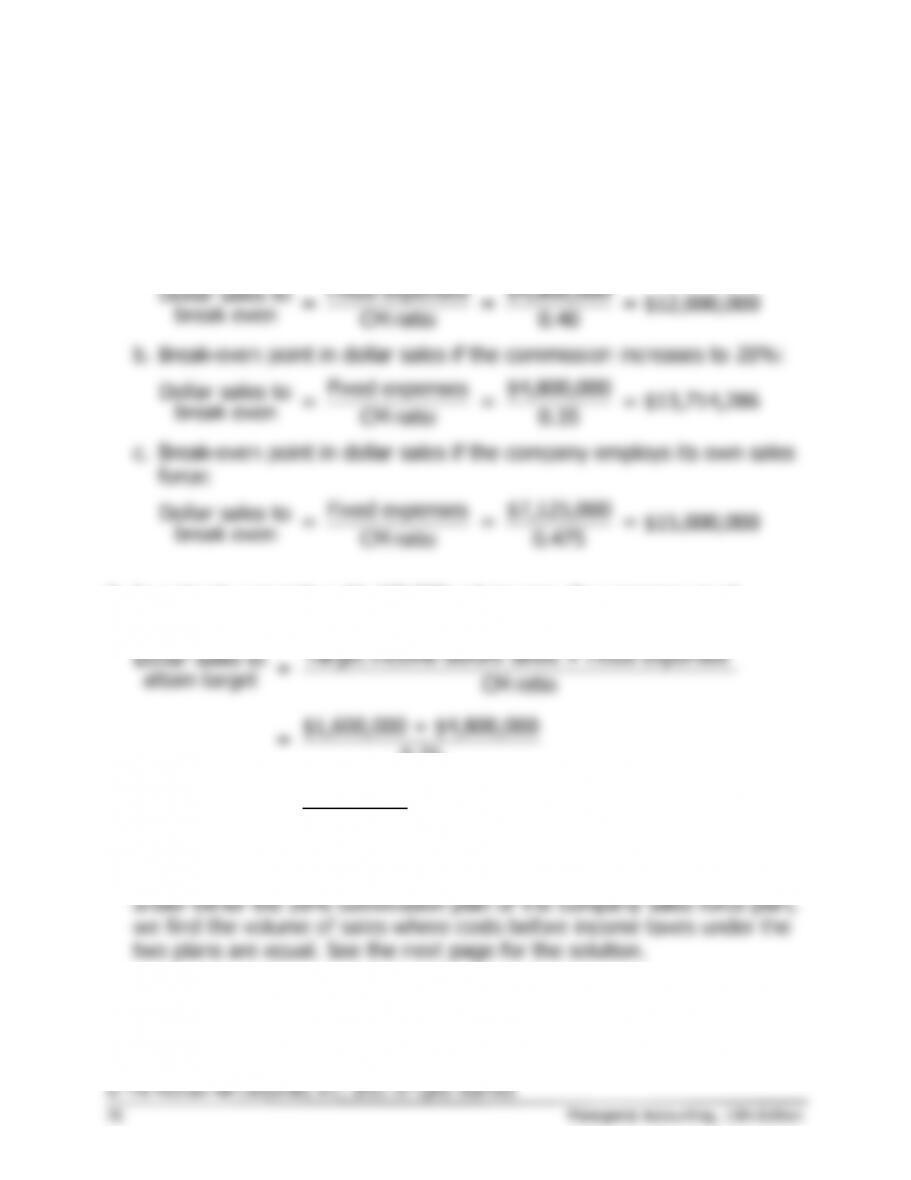
Fixed expenses $400,000
Dollar sales to = = = $732,000 (rounded)
break even CM ratio 0.5466
2. The issue is what to do with the common fixed cost when computing
the break-evens for the individual products. The correct approach is to
ignore the common fixed costs. If the common fixed costs are included
in the computations, the break-even points will be overstated for
Velcro
Metal
Nylon
Unit selling price ……………………………..
$1.65
$1.50
$0.85
Variable cost per unit ……………………….
1.25
0.70
0.25
Unit contribution margin (a) ………………
$0.40
$0.80
$0.60
Product fixed expenses (b)………………..
$20,000
$80,000
$60,000
Unit sales to break even (b) ÷ (a) ………
50,000
100,000
100,000
Case 5-32 (continued)
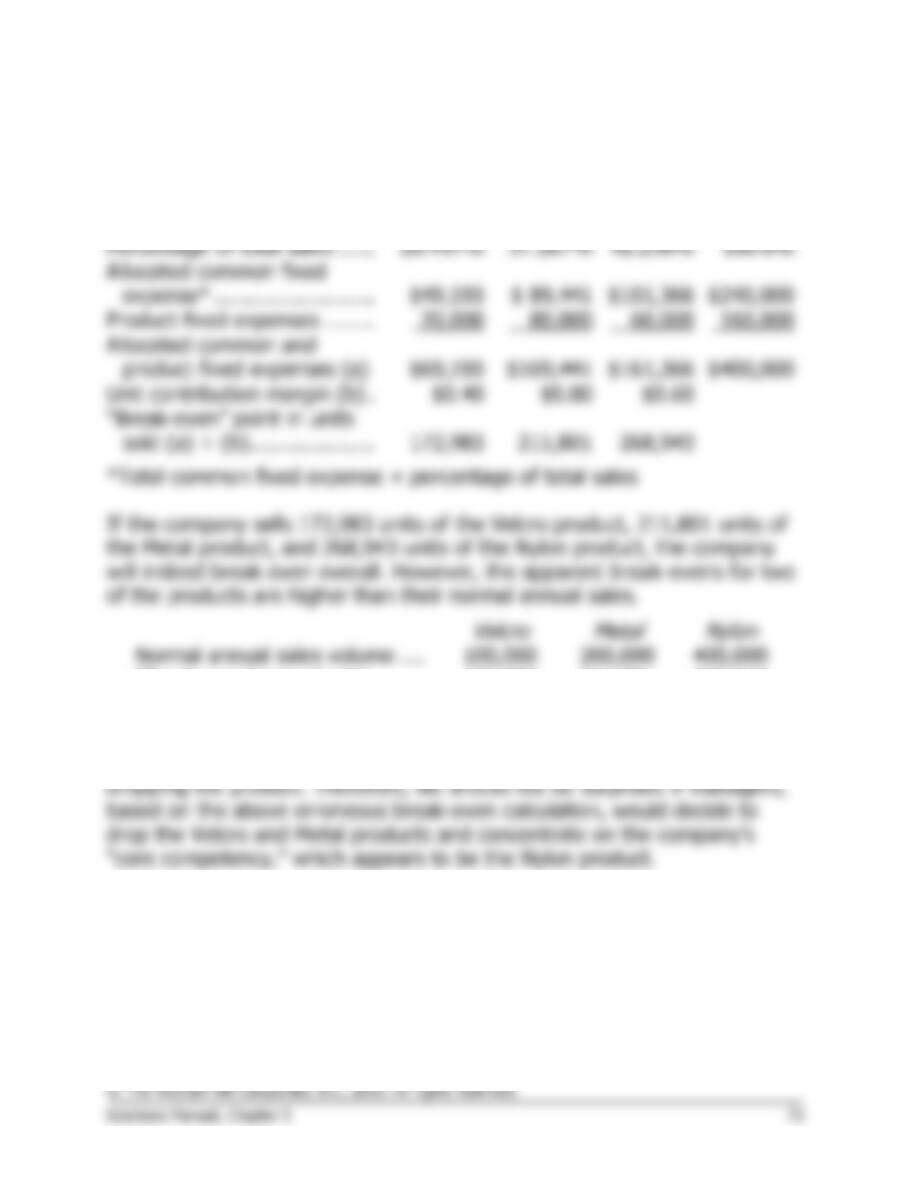
Allocation of common fixed expenses on the basis of sales revenue:
Velcro
Metal
Nylon
Total
Sales ……………………………..
$165,000
$300,000
$340,000
$805,000
Percentage of total sales ……
20.497%
37.267%
42.236%
100.0%
Allocated common fixed
expense* ……………………..
$49,193
$ 89,441
$101,366
$240,000
Product fixed expenses ……..
20,000
80,000
60,000
160,000
Allocated common and
product fixed expenses (a)
$69,193
$169,441
$161,366
$400,000
Unit contribution margin (b) .
$0.40
$0.80
$0.60
“Break–even” point in units
sold (a) ÷ (b) ………………..
172,983
211,801
268,943
*Total common fixed expense × percentage of total sales
If the company sells 172,983 units of the Velcro product, 211,801 units of
the Metal product, and 268,943 units of the Nylon product, the company
will indeed break even overall. However, the apparent break-evens for two
of the products are higher than their normal annual sales.
Velcro
Metal
Nylon
Normal annual sales volume ….
100,000
200,000
400,000
“Break–even” annual sales …….
172,983
211,801
268,943
“Strategic” decision ……………..
drop
drop
retain
It would be natural for managers to interpret a break-even for a product as
the level of sales below which the company would be financially better off
Case 5-33 (75 minutes)
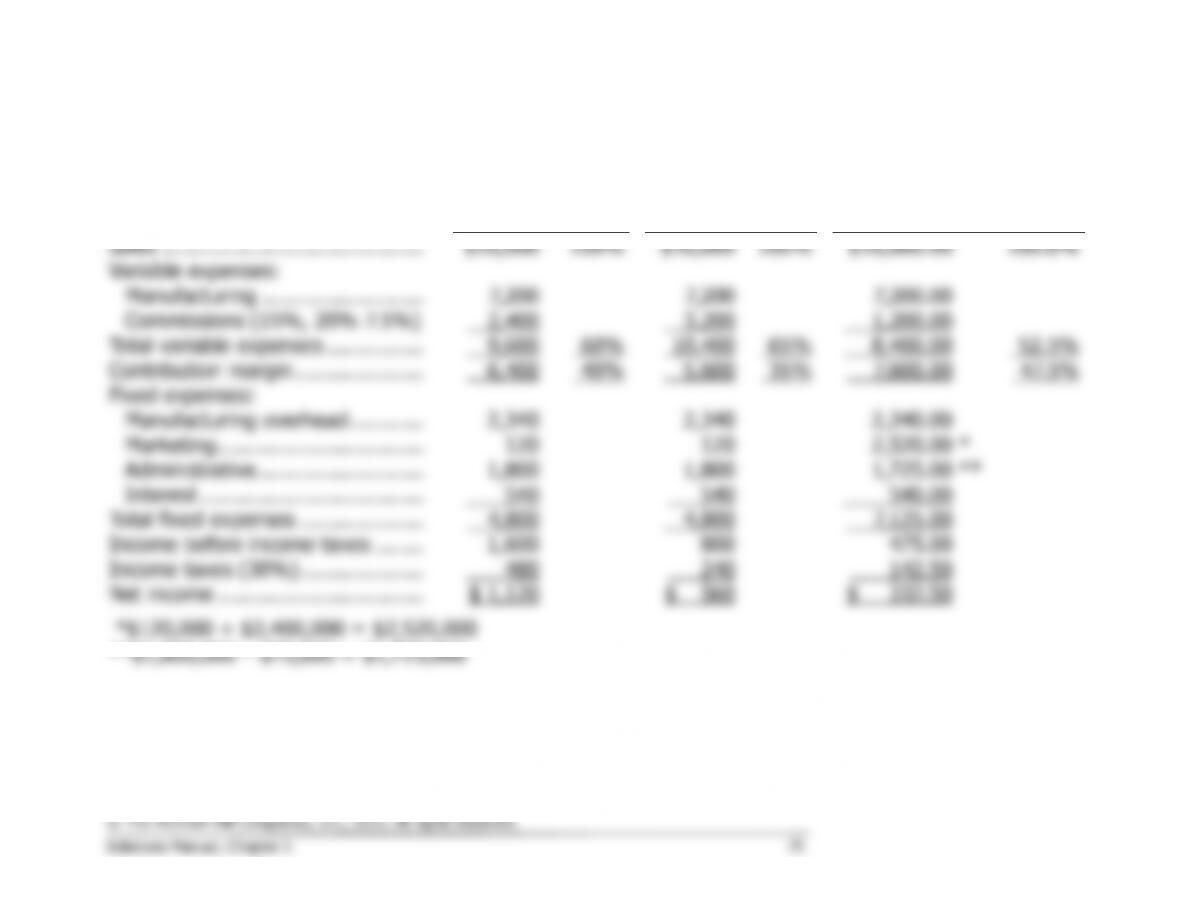
Before proceeding with the solution, it is helpful first to restructure the data into contribution format for
each of the three alternatives. (The data in the statements below are in thousands.)
15% Commission
20% Commission
Own Sales Force
Sales ……………………………………
$16,000
100%
$16,000
100%
$16,000.00
100.0%
Variable expenses:
Manufacturing ……………………..
7,200
7,200
7,200.00
Commissions (15%, 20% 7.5%)
2,400
3,200
1,200.00
Total variable expenses …………….
9,600
60%
10,400
65%
8,400.00
52.5%
Contribution margin …………………
6,400
40%
5,600
35%
7,600.00
47.5%
Fixed expenses:
Manufacturing overhead …………
2,340
2,340
2,340.00
Marketing …………………………...
120
120
2,520.00
*
Administrative ………………………
1,800
1,800
1,725.00
**
Interest ………………………………
540
540
540.00
Total fixed expenses ………………..
4,800
4,800
7,125.00
Income before income taxes ……..
1,600
800
475.00
Income taxes (30%) ………………..
480
240
142.50
Net income …………………………...
$ 1,120
$ 560
$ 332.50
*$120,000 + $2,400,000 = $2,520,000
**$1,800,000 – $75,000 = $1,725,000
Case 5-33 (continued)
X =
Total sales revenue
0.65X + $4,800,000 =
0.525X + $7,125,000
0.125X =
$2,325,000
X =
$2,325,000 ÷ 0.125
X =
$18,600,000
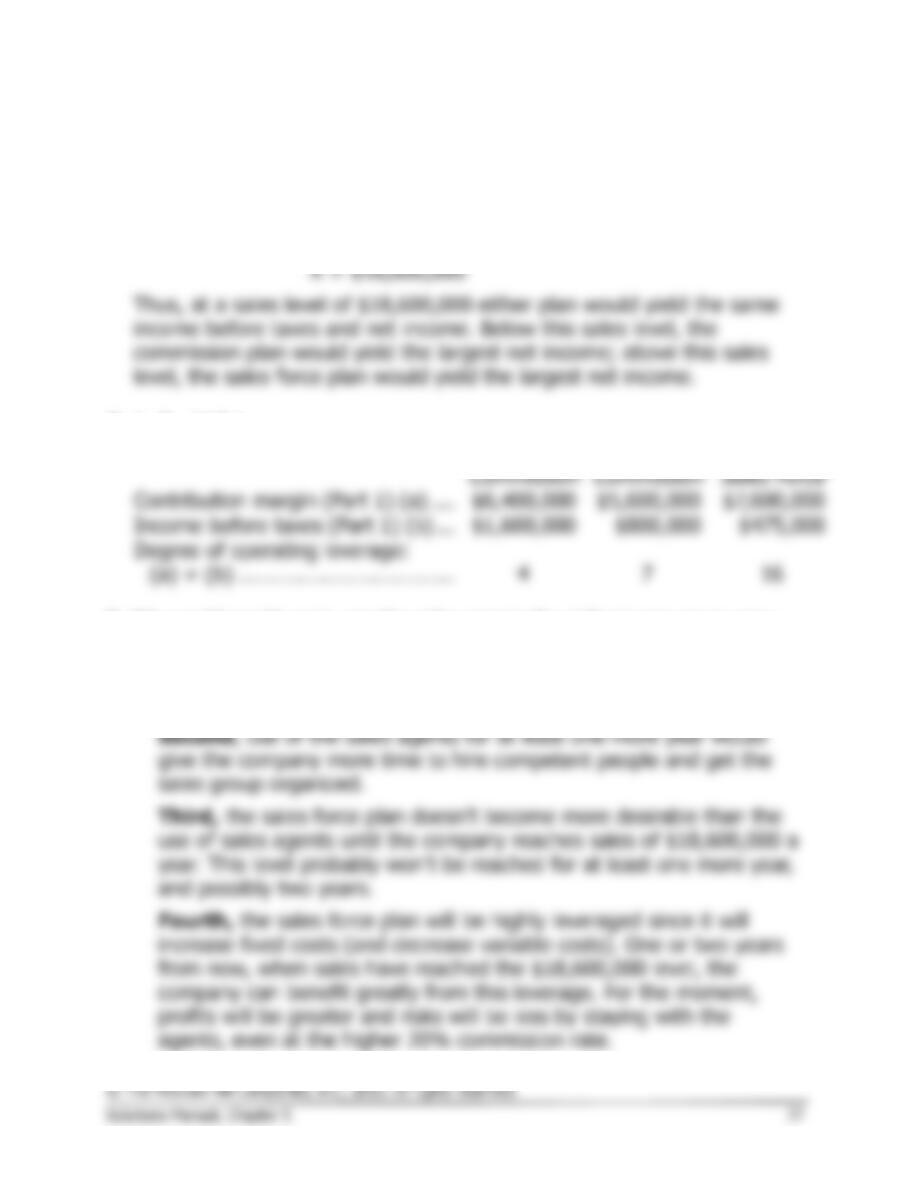
Thus, at a sales level of $18,600,000 either plan would yield the same
income before taxes and net income. Below this sales level, the
commission plan would yield the largest net income; above this sales
level, the sales force plan would yield the largest net income.
4. a., b., and c.
15%
Commission
20%
Commission
Own
Sales Force
Contribution margin (Part 1) (a) ….
$6,400,000
$5,600,000
$7,600,000
Income before taxes (Part 1) (b) …
$1,600,000
$800,000
$475,000
Degree of operating leverage:
(a) ÷ (b) ……………………………..
4
7
16
5. We would continue to use the sales agents for at least one more year,
and possibly for two more years. The reasons are as follows:
First, use of the sales agents would have a less dramatic effect on
net income.