Problem 5-28 (continued)
2. The sales mix has shifted over the last year from Standard sets to
3. Sales commissions could be based on contribution margin rather than
on sales price. A flat rate on total contribution margin, as the text
suggests, might encourage the salespersons to emphasize the product
Problem 5-29 (continued)
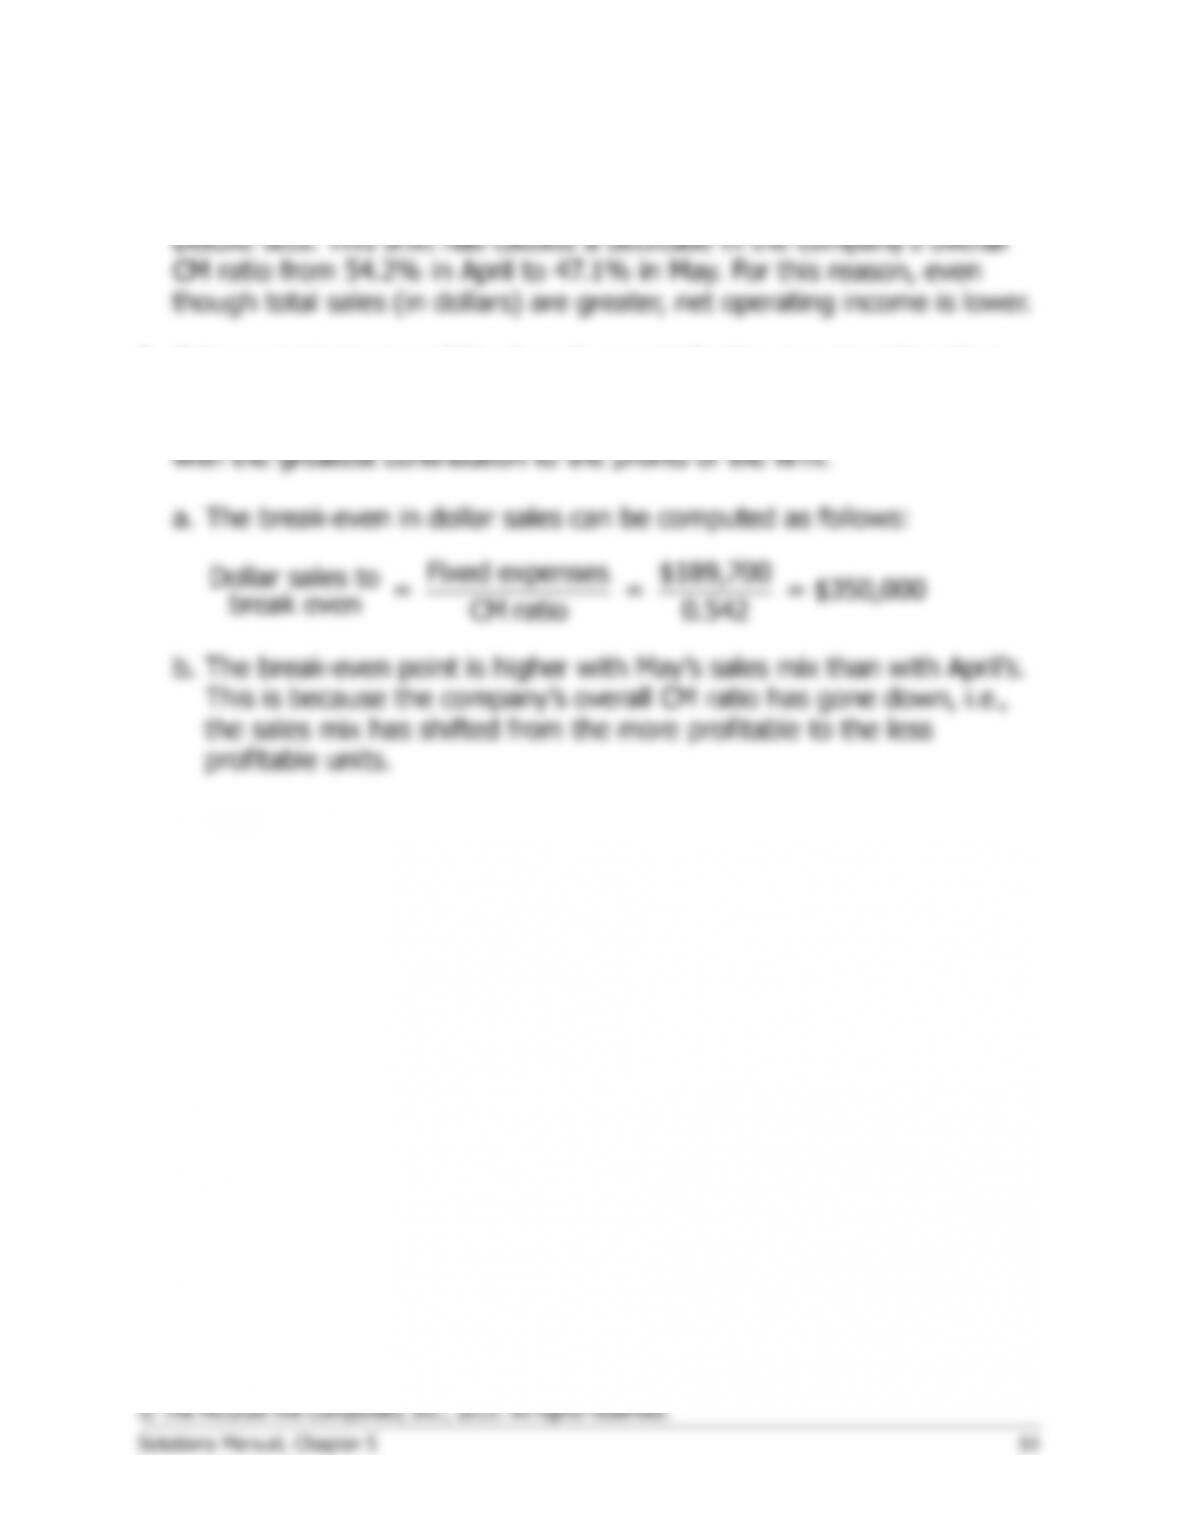
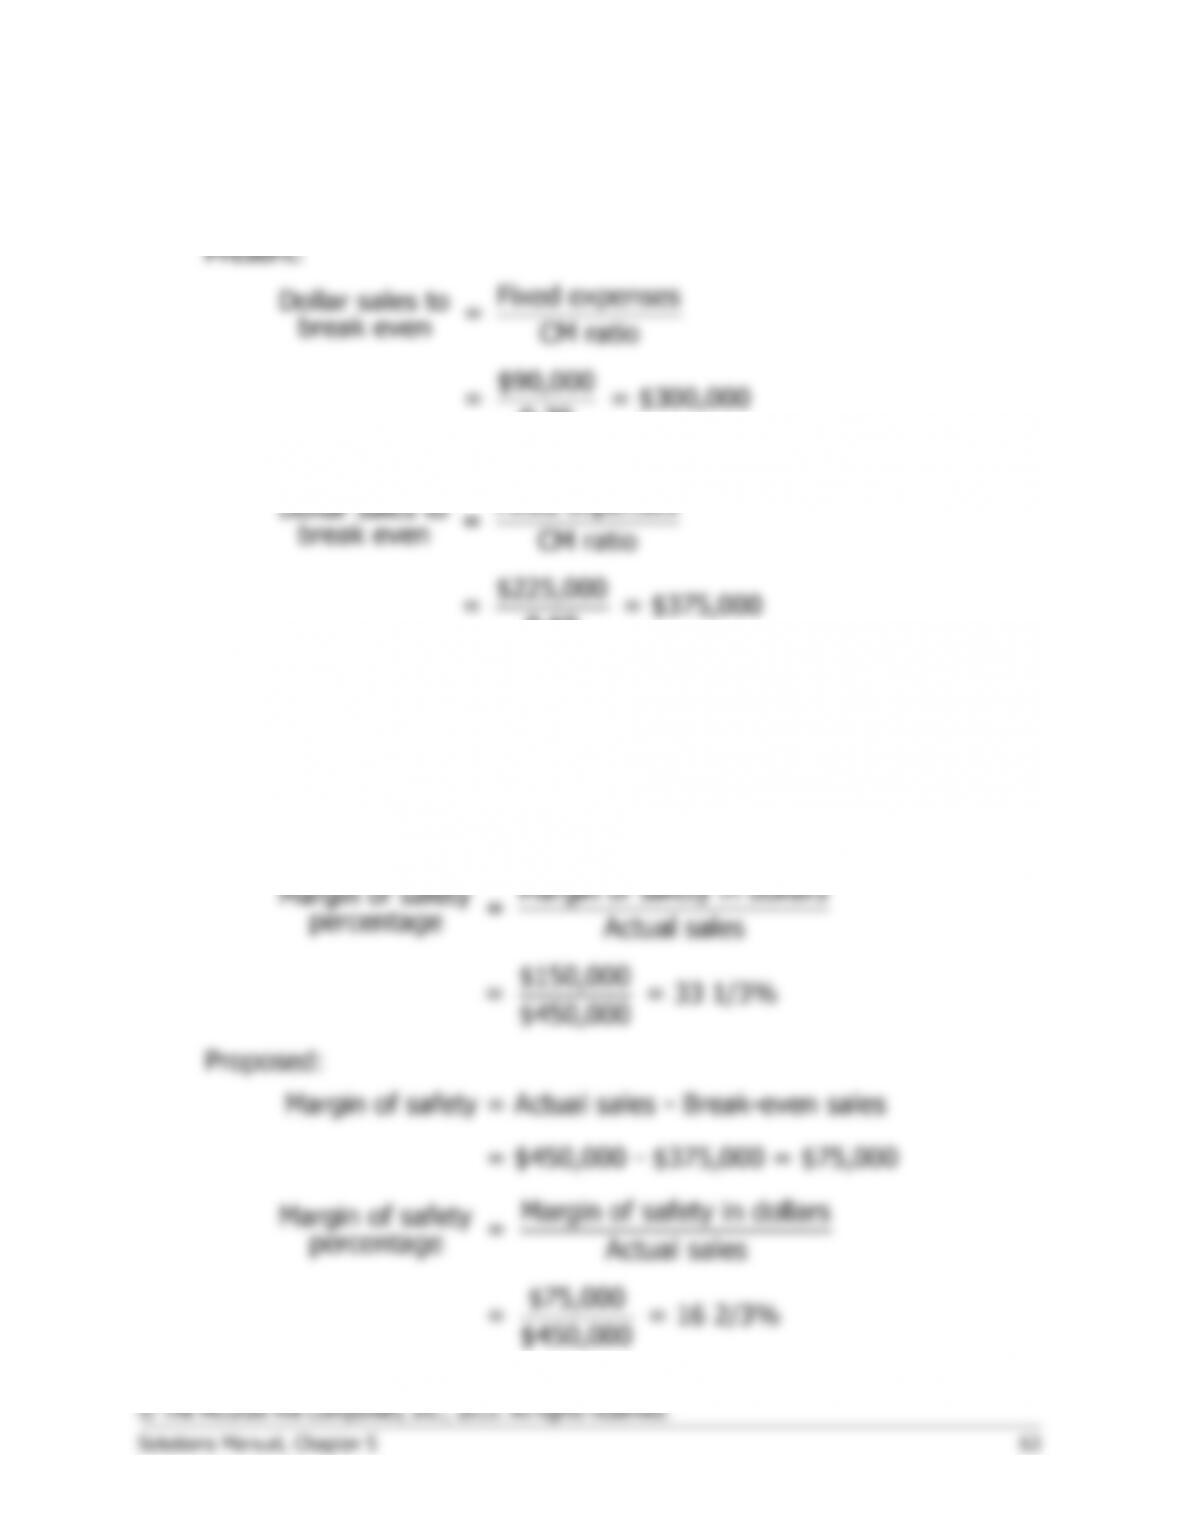
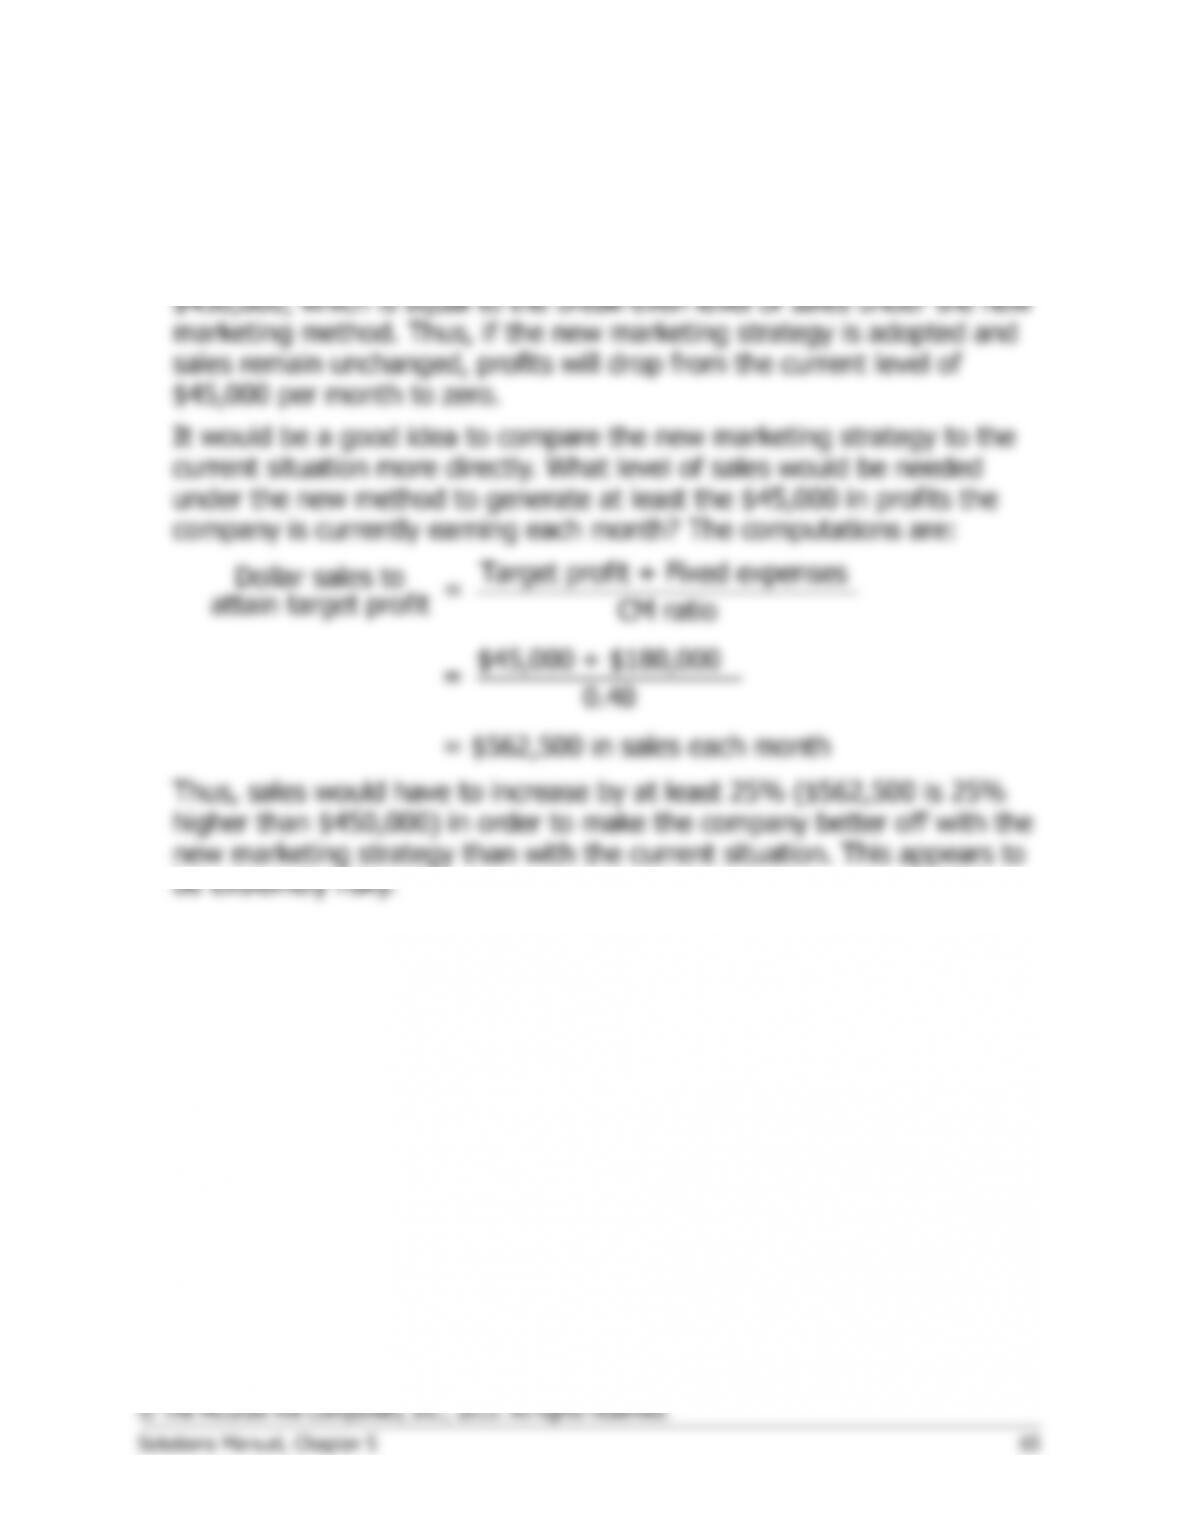
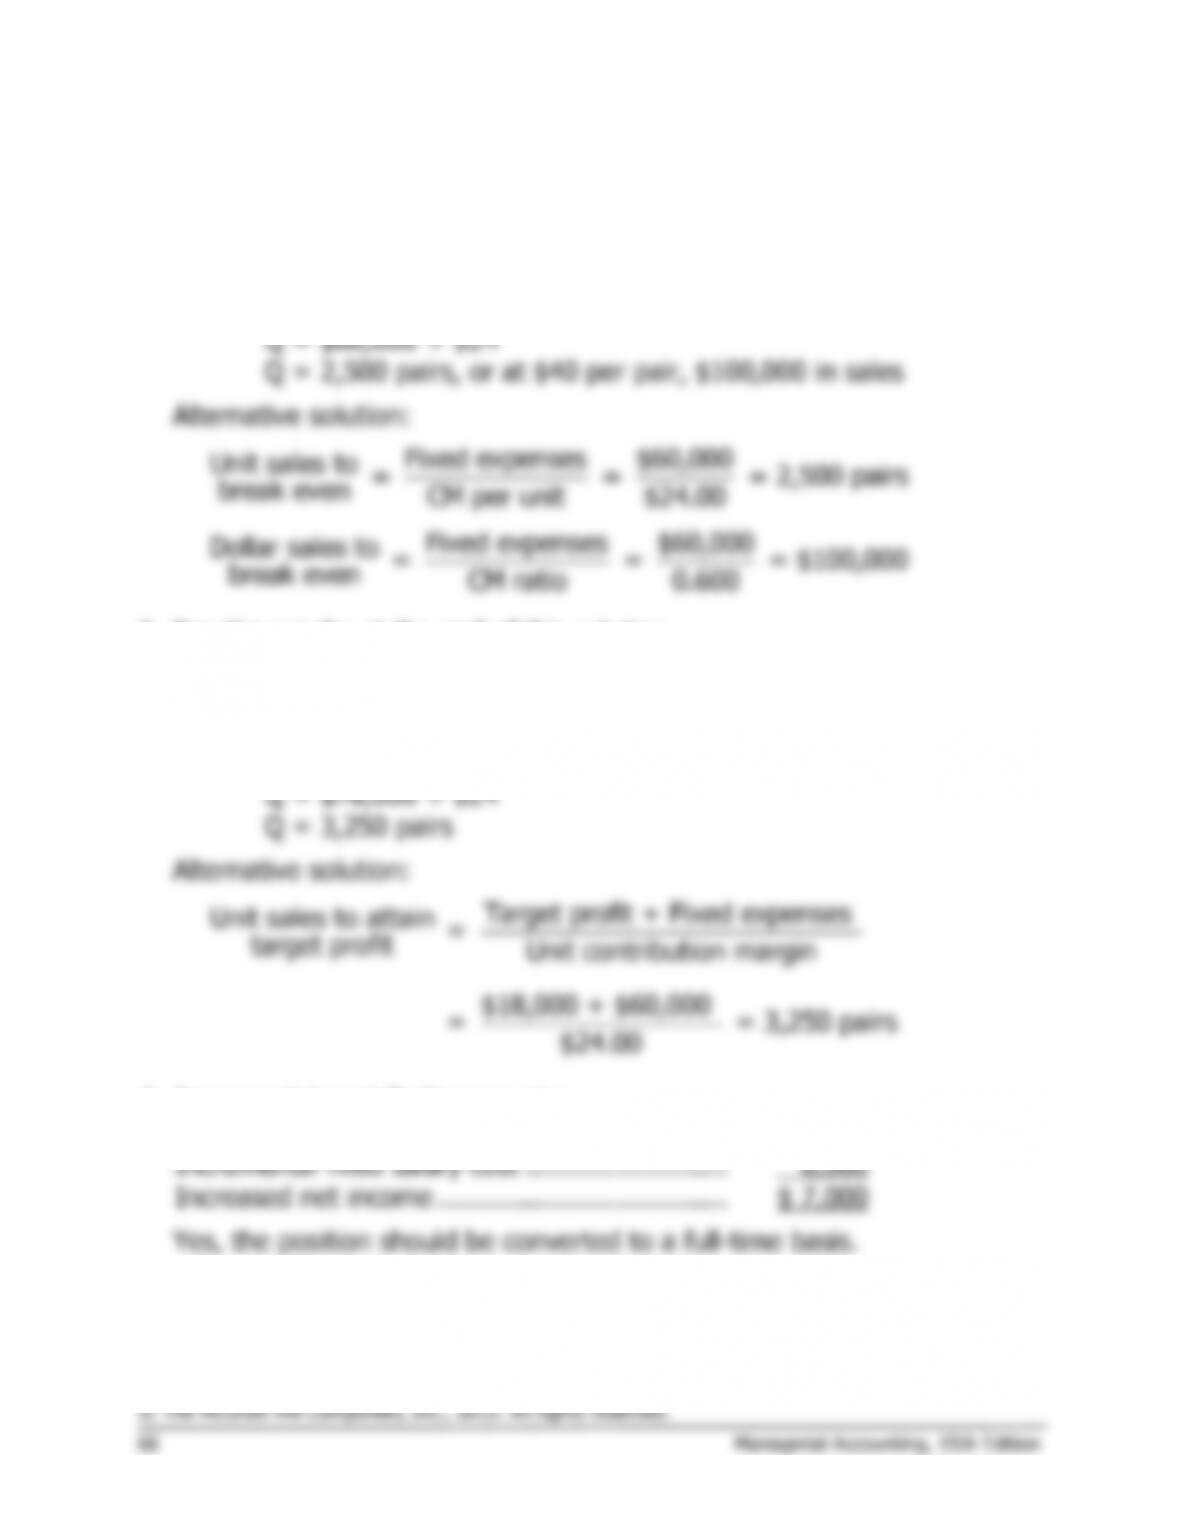
b. Dollar sales to break even:
Problem 5-29 (continued)
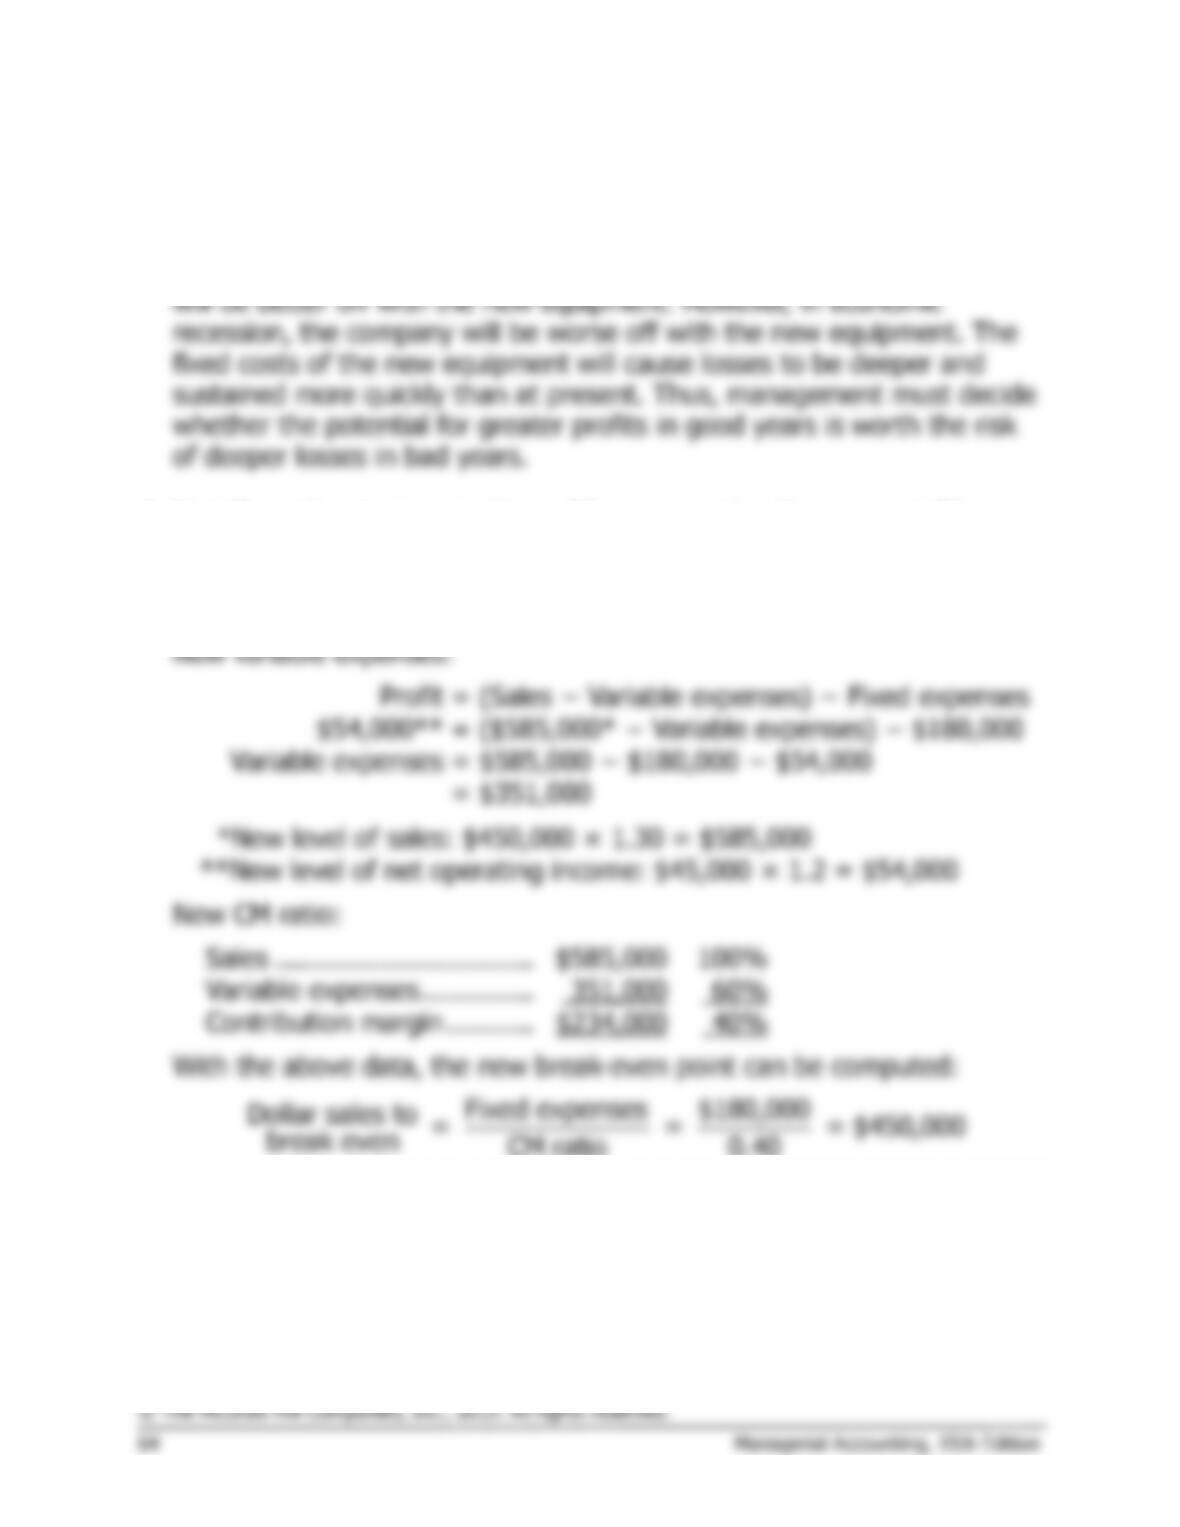
The greatest risk is that the increases in sales and net operating income
predicted by the marketing manager will not happen and that sales will
remain at their present level. Note that the present level of sales is
Problem 5-30 (continued)
5.
a.
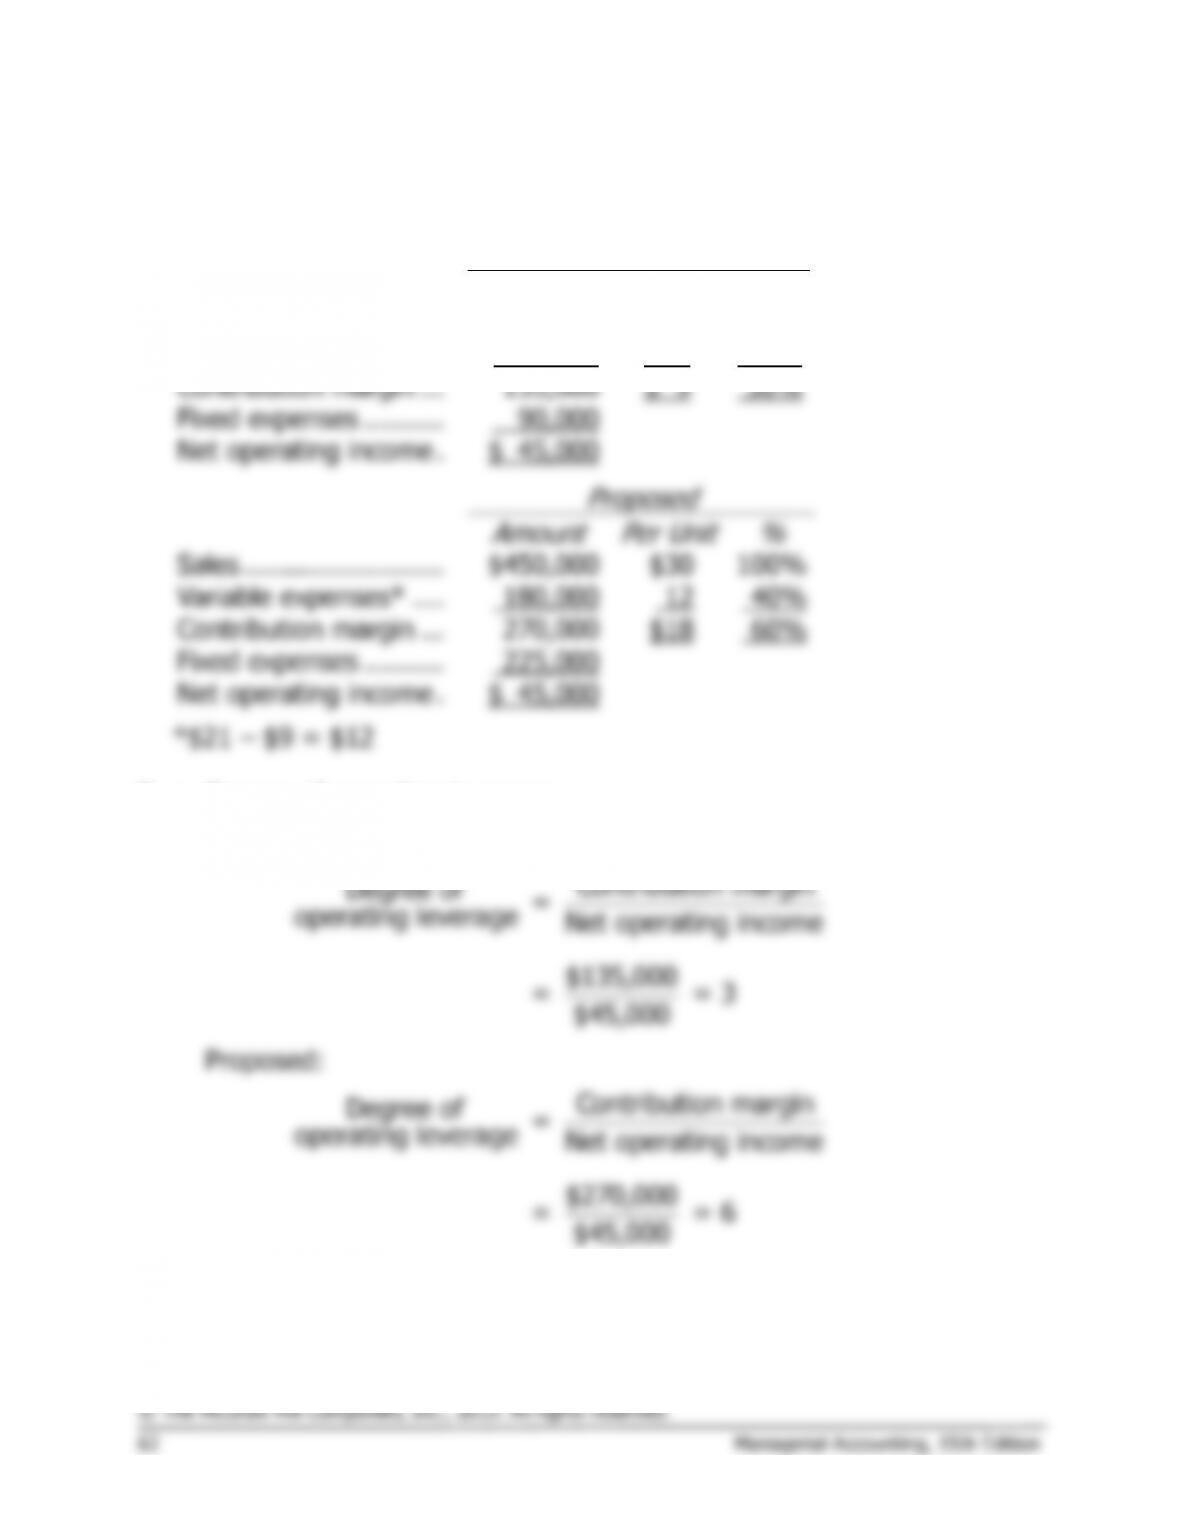
Contribution margin $72,000
Degree of = = = 6
operating leverage Net operating income $12,000
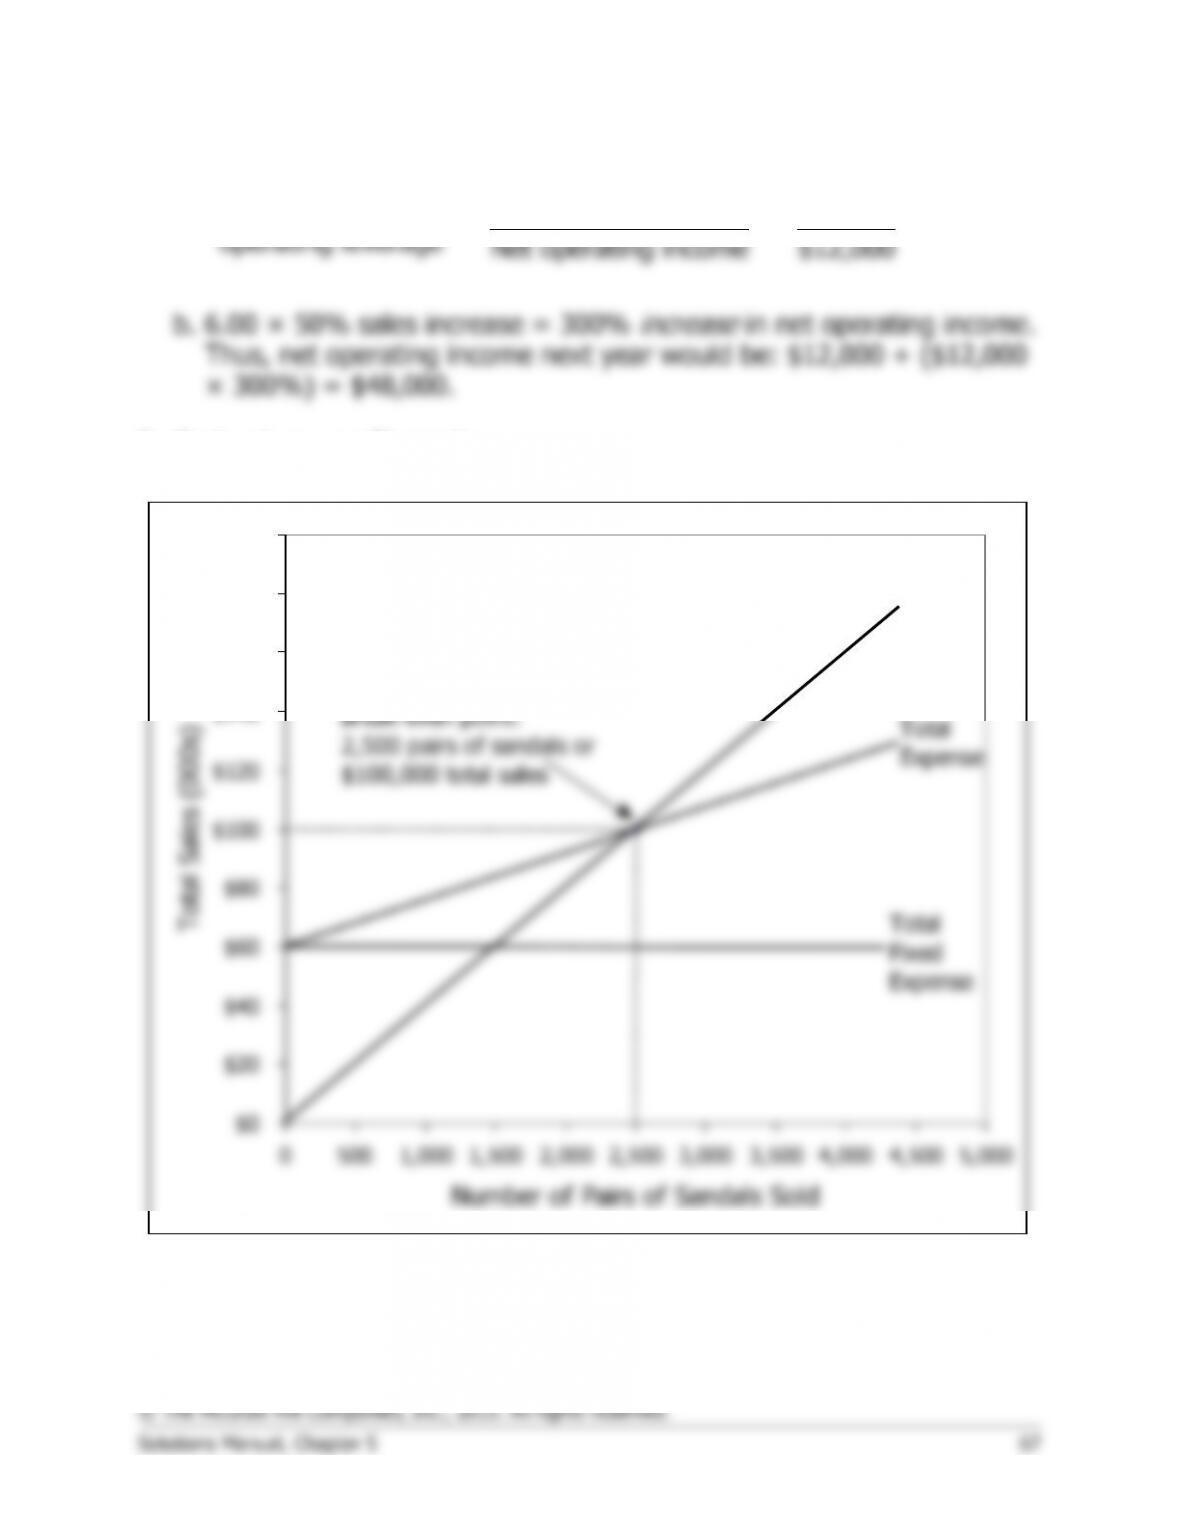
2. Cost-volume-profit graph:
$0
$20
$40
$60
$80
$100
$120
$140
$160
$180
$200
0500 1,000 1,500 2,000 2,500 3,000 3,500 4,000 4,500 5,000
Number of Pairs of Sandals Sold
Total Sales (000s)
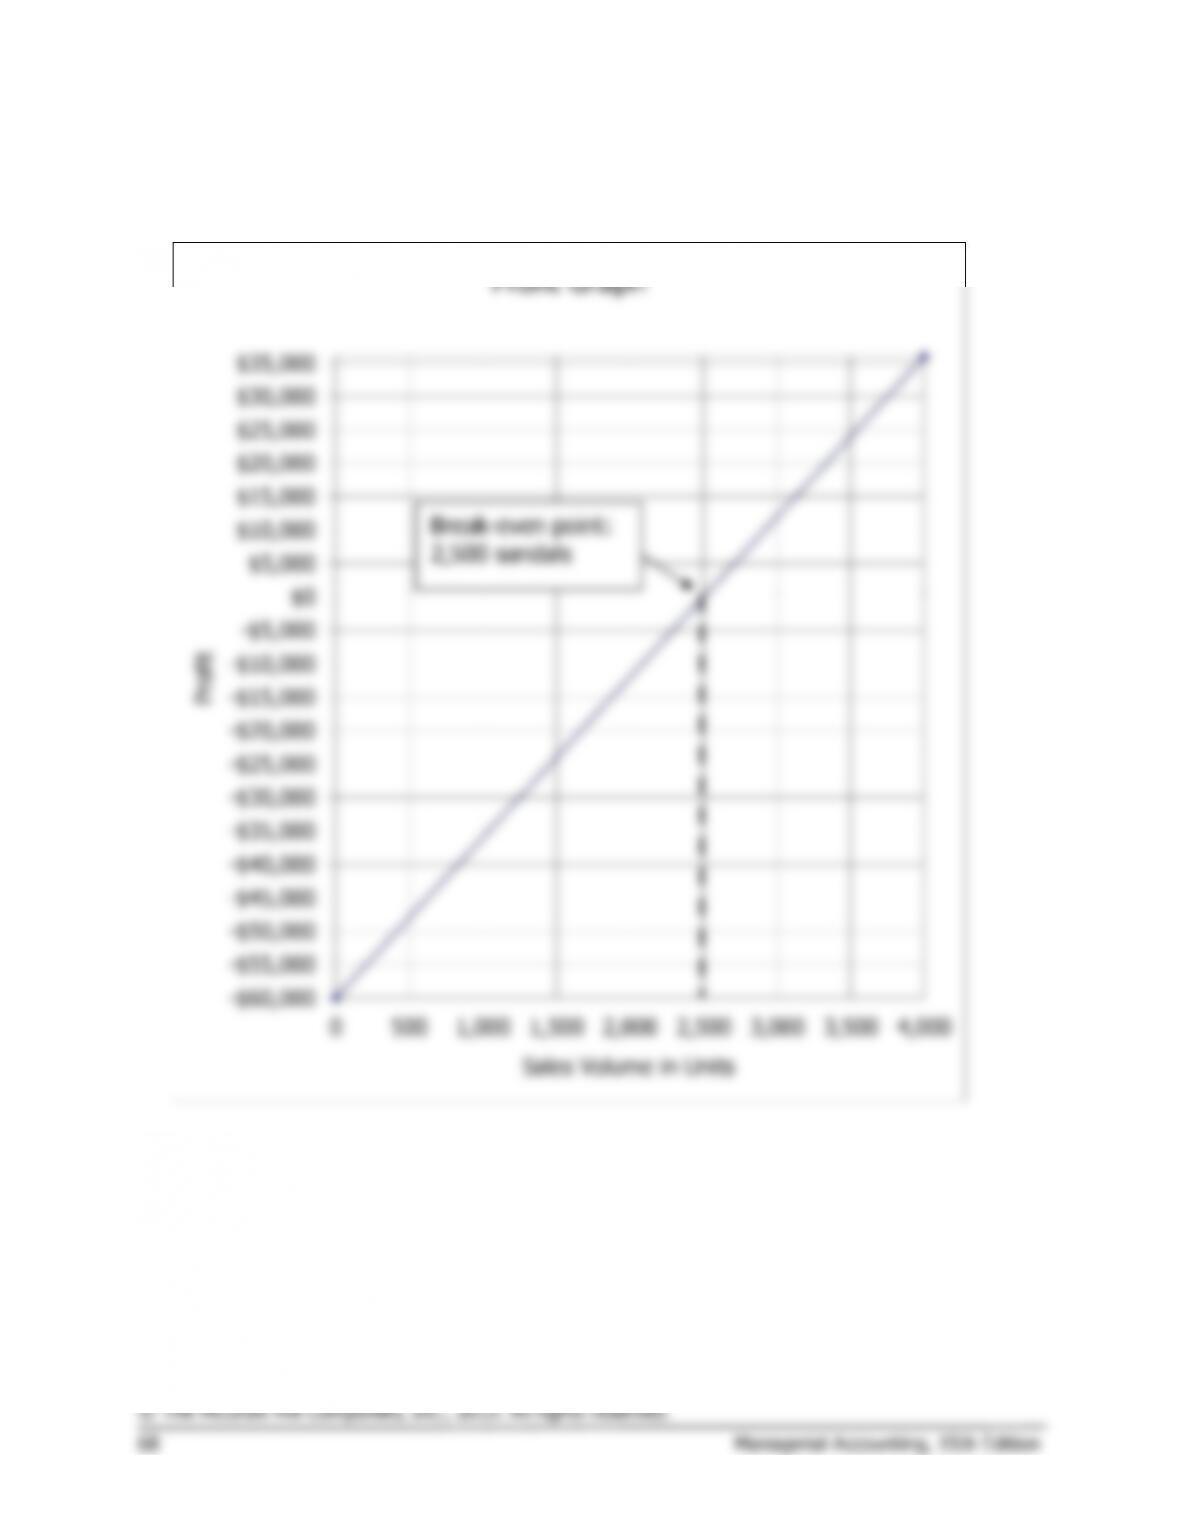
Break-even point:
2,500 pairs of sandals or
$100,000 total sales
Total Sales
Total
Expense
Total
Fixed
Expense
Problem 5-31 (30 minutes)
1.
(1)
Dollars
(2)
Volume of output, expressed in units, % of capacity, sales,
or some other measure
(3)
Total expense line
(4)
Variable expense area
(5)
Fixed expense area
(6)
Break-even point
(7)
Loss area
(8)
Profit area
(9)
Sales line