Unlock document.
This document is partially blurred.
Unlock all pages and 1 million more documents.
Get Access
Chapter 5
Cost-Volume-Profit Relationships
Solutions to Questions
5-1 The contribution margin (CM) ratio is
the ratio of the total contribution margin to total
5-2 Incremental analysis focuses on the
5-3 All other things equal, Company B, with
its higher fixed costs and lower variable costs,
5-4 Operating leverage measures the impact
on net operating income of a given percentage
higher unit volume. (b) If the fixed cost
increased, then both the fixed cost line and the
5-7 The margin of safety is the excess of
budgeted (or actual) sales over the break-even
5-8 The sales mix is the relative proportions
in which a company’s products are sold. The
net operating income could result if the sales
mix shifted from high contribution margin
products to low contribution margin products.
The Foundational 15
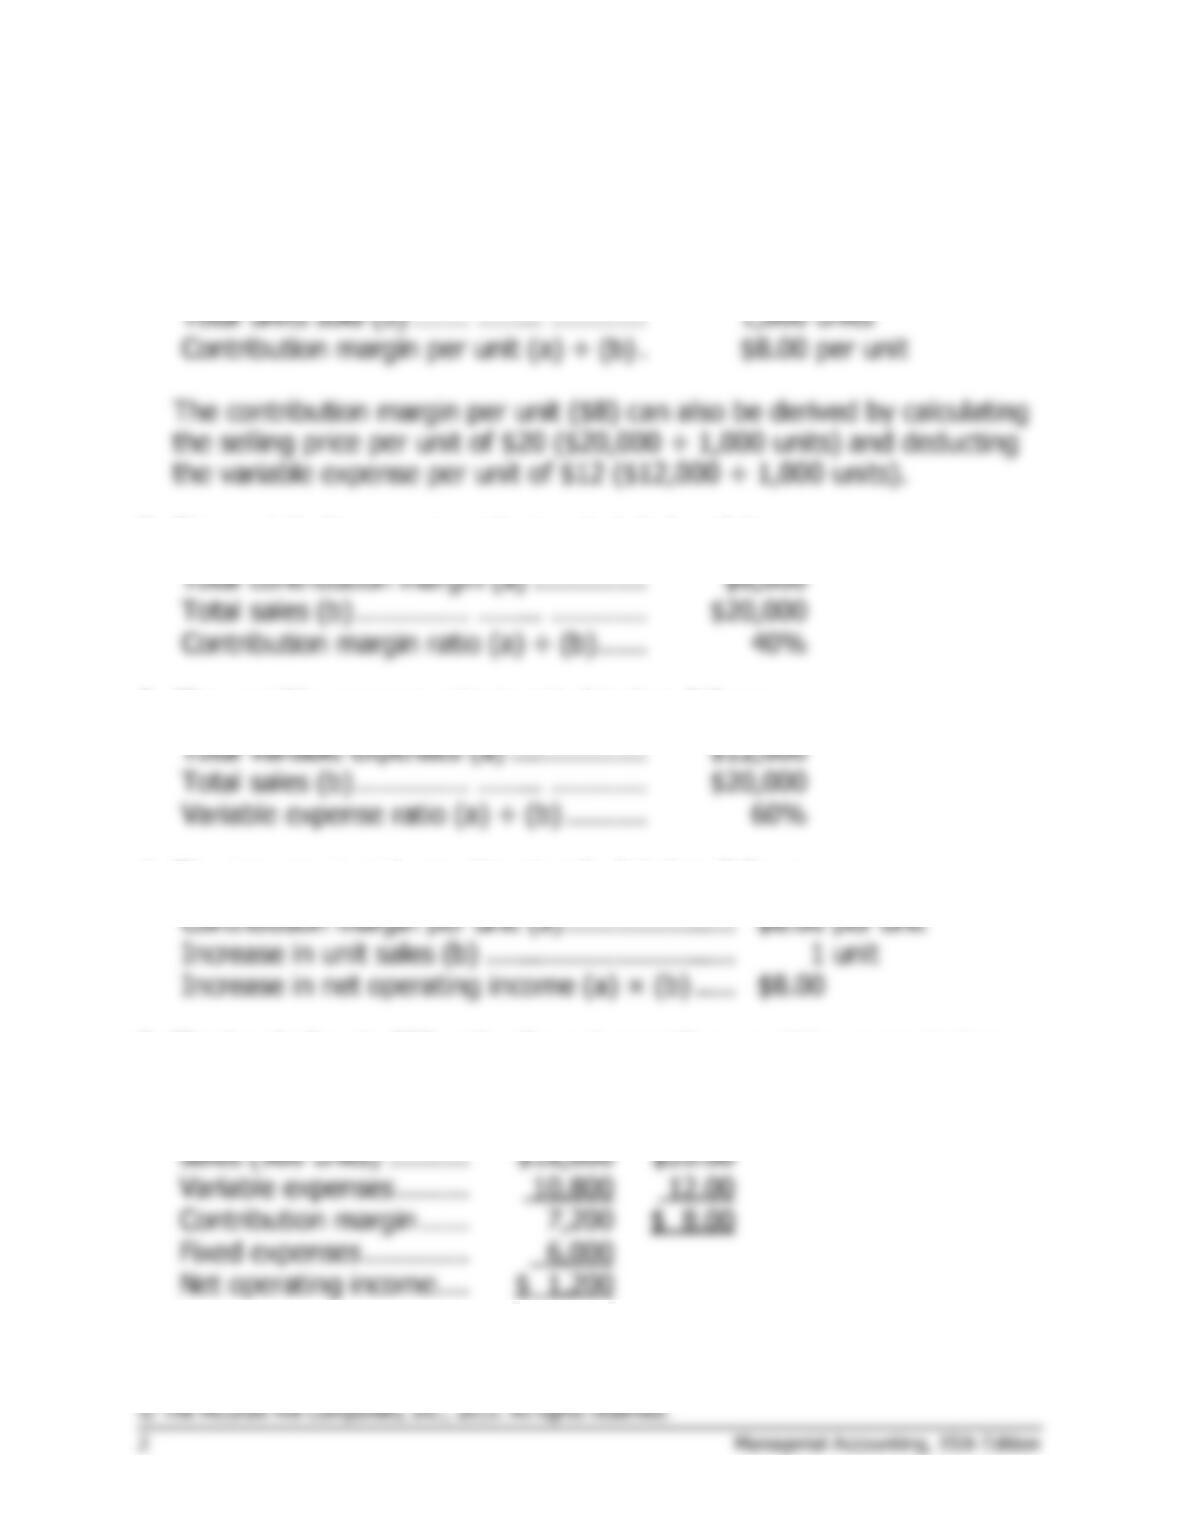
1. The contribution margin per unit is calculated as follows:
Total contribution margin (a) ..............
$8,000
Total units sold (b) ....... ........ ............
1,000
units
Contribution margin per unit (a) ÷ (b) .
$8.00
per unit
The contribution margin per unit ($8) can also be derived by calculating
the selling price per unit of $20 ($20,000 ÷ 1,000 units) and deducting
the variable expense per unit of $12 ($12,000 ÷ 1,000 units).
2. The contribution margin ratio is calculated as follows:
Total contribution margin (a) ..............
$8,000
Total sales (b) .............. ........ ............
$20,000
Contribution margin ratio (a) ÷ (b) ......
40%
3. The variable expense ratio is calculated as follows:
Total variable expenses (a) .................
$12,000
Total sales (b) .............. ........ ............
$20,000
Variable expense ratio (a) ÷ (b) ..........
60%
4. The increase in net operating is calculated as follows:
Contribution margin per unit (a) .....................
$8.00
per unit
Increase in unit sales (b) ...............................
1
unit
Increase in net operating income (a) × (b) .....
$8.00
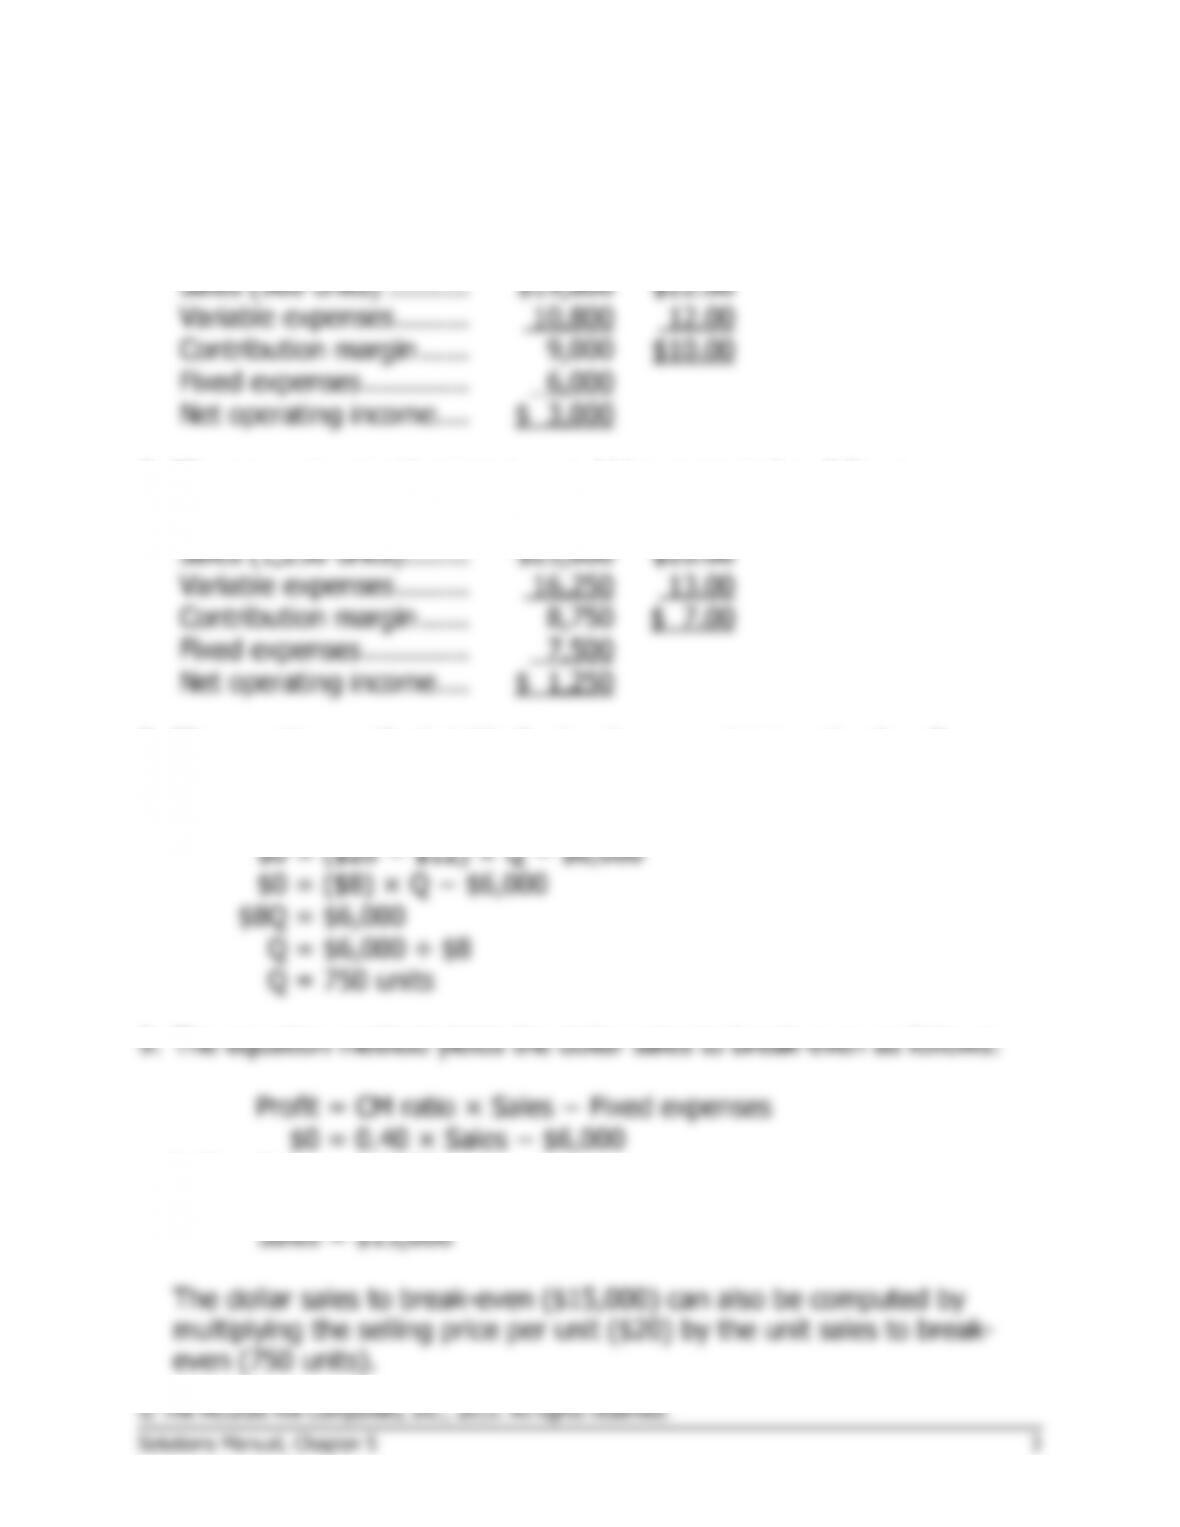
5. If sales decline to 900 units, the net operating would be computed as
follows:
Total
Per Unit
Sales (900 units) ..........
$18,000
$20.00
Variable expenses .........
10,800
12.00
Contribution margin ......
7,200
$ 8.00
Fixed expenses .............
6,000
Net operating income ....
$ 1,200
The Foundational 15 (continued)
6. The new net operating income would be computed as follows:
Total
Per Unit
Sales (900 units) ..........
$19,800
$22.00
Variable expenses .........
10,800
12.00
Contribution margin ......
9,000
$10.00
Fixed expenses .............
6,000
Net operating income ....
$ 3,000
7. The new net operating income would be computed as follows:
Total
Per Unit
Sales (1,250 units) ........
$25,000
$20.00
Variable expenses .........
16,250
13.00
Contribution margin ......
8,750
$ 7.00
Fixed expenses .............
7,500
Net operating income ....
$ 1,250
8. The equation method yields the break-even point in unit sales, Q, as
follows:
Profit
= Unit CM × Q − Fixed expenses
$0
= ($20 − $12) × Q − $6,000
$0
= ($8) × Q − $6,000
$8Q
= $6,000
Q
= $6,000 ÷ $8
Q
= 750 units

The Foundational 15 (continued)
10. The equation method yields the target profit as follows:
Profit
= Unit CM × Q − Fixed expenses
$5,000
= ($20 − $12) × Q − $6,000
$5,000
= ($8) × Q − $6,000
$8Q
= $11,000
Q
= $11,000 ÷ $8
Q
= 1,375 units
11. The margin of safety in dollars is calculated as follows:
Sales ..............................................................
$20,000
Break-even sales (at 750 units) ........................
15,000
Margin of safety (in dollars) .............................
$ 5,000
The margin of safety as a percentage of sales is calculated as follows:
Margin of safety (in dollars) (a) .................
$5,000
Sales (b) ..................................................
$20,000
Margin of safety percentage (a) ÷ (b) .......
25%
12. The degree of operating leverage is calculated as follows:
Contribution margin (a) .......................
$8,000
Net operating income (b) ......................
$2,000
Degree of operating leverage (a) ÷ (b) ..
4.0
13. A 5% increase in sales should result in a 20% increase in net
operating income, computed as follows:
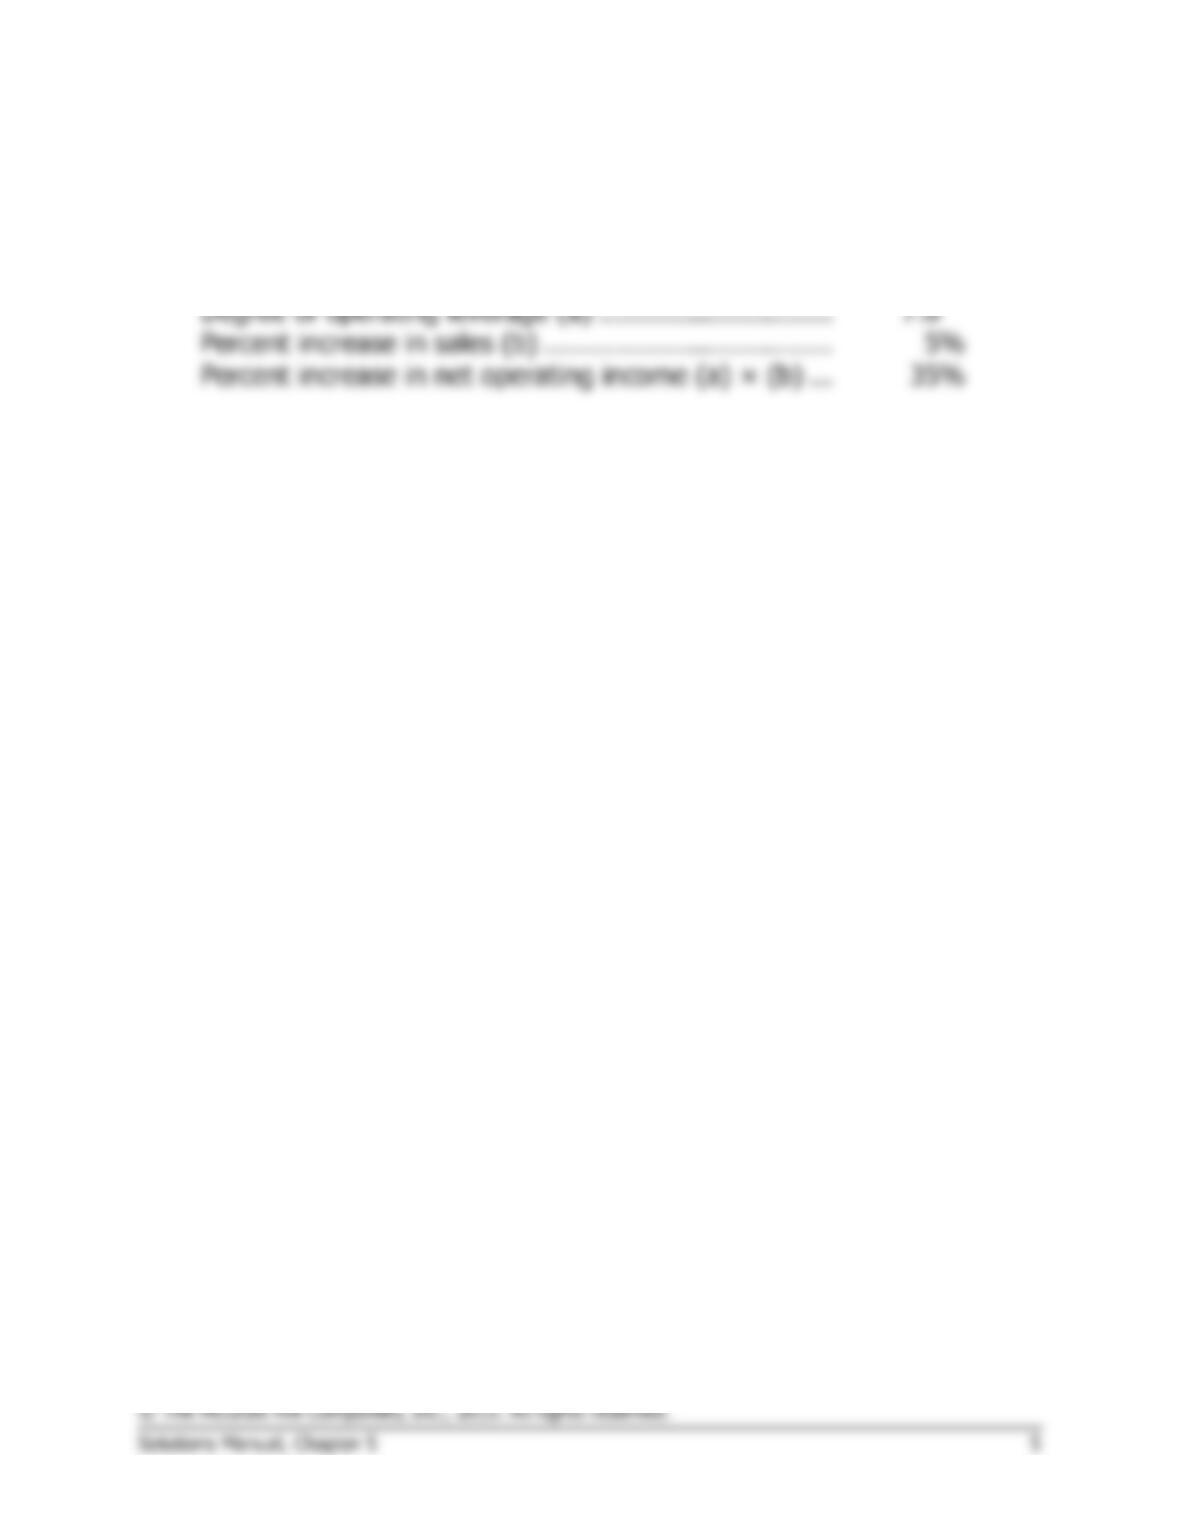
Degree of operating leverage (a) .............................
4.0
Percent increase in sales (b) ....................................
5%
Percent increase in net operating income (a) × (b) ...
20%
14. The degree of operating leverage is calculated as follows:
Contribution margin (a) . ......................
$14,000
Net operating income (b) .....................
$2,000
Degree of operating leverage (a) ÷ (b) .
7.0
The Foundational 15 (continued)
15. A 5% increase in sales should result in 35% increase in net operating
income, computed as follows:
Degree of operating leverage (a) .............................
7.0
Percent increase in sales (b) ....................................
5%
Percent increase in net operating income (a) × (b) ...
35%
Exercise 5-1 (20 minutes)
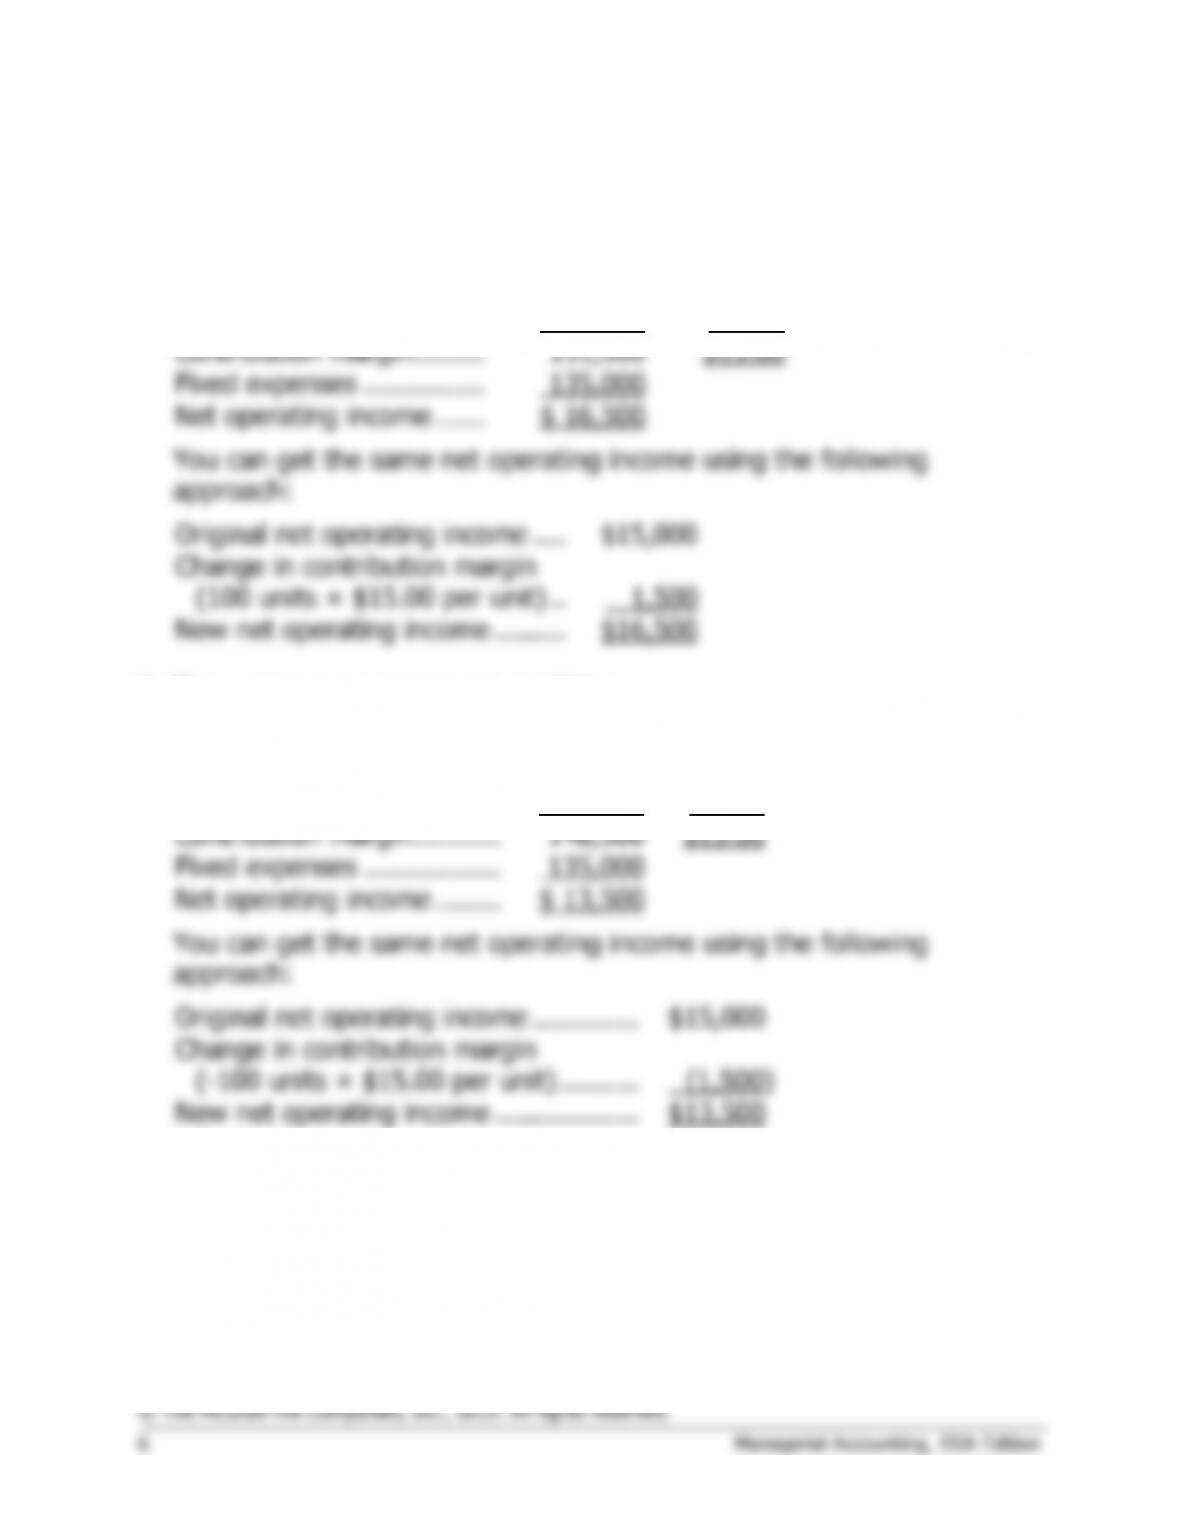
1. The new income statement would be:
Total
Per Unit
Sales (10,100 units) ........
$353,500
$35.00
Variable expenses ...........
202,000
20.00
Contribution margin .........
151,500
$15.00
Fixed expenses ...............
135,000
Net operating income ......
$ 16,500
You can get the same net operating income using the following
approach:
Original net operating income ....
$15,000
Change in contribution margin
(100 units × $15.00 per unit) ..
1,500
New net operating income .........
$16,500
2. The new income statement would be:
Total
Per Unit
Sales (9,900 units) ............
$346,500
$35.00
Variable expenses .............
198,000
20.00
Contribution margin ...........
148,500
$15.00
Fixed expenses .................
135,000
Net operating income ........
$ 13,500
You can get the same net operating income using the following
approach:
Original net operating income .............
$15,000
Change in contribution margin
(-100 units × $15.00 per unit) ..........
(1,500)
New net operating income ..................
$13,500
Exercise 5-1 (continued)
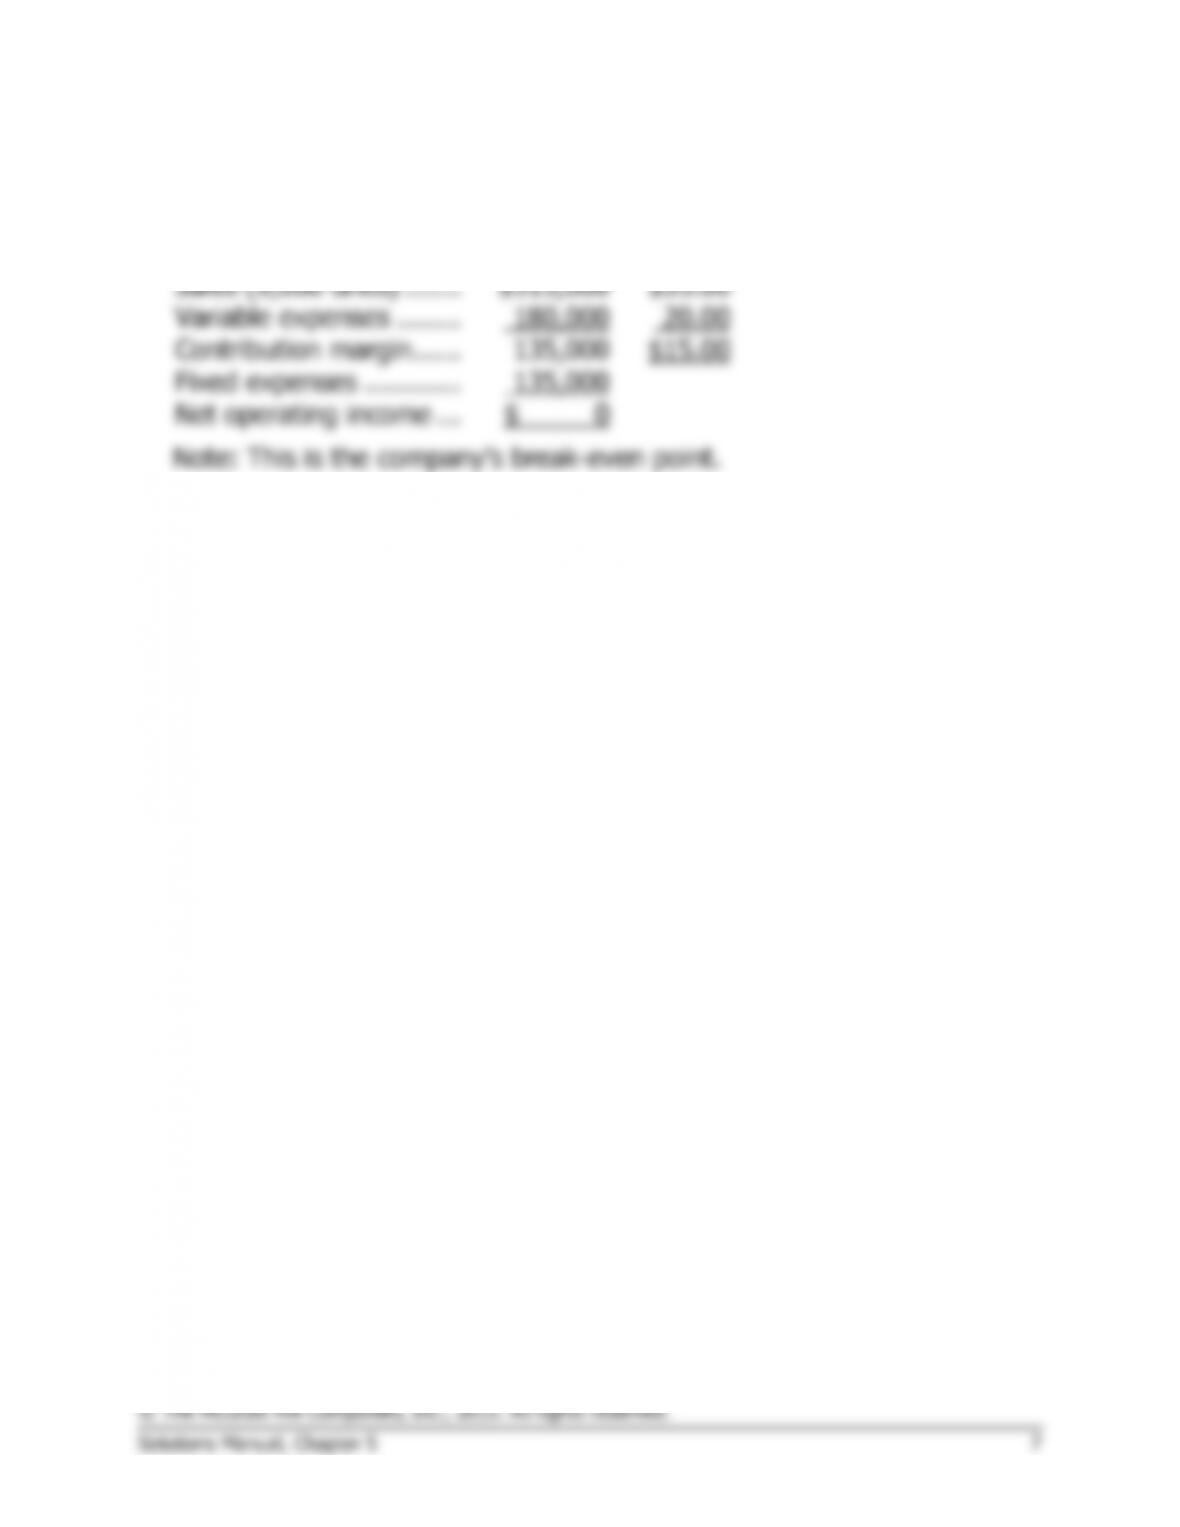
3. The new income statement would be:
Total
Per Unit
Sales (9,000 units) .......
$315,000
$35.00
Variable expenses ........
180,000
20.00
Contribution margin ......
135,000
$15.00
Fixed expenses ............
135,000
Net operating income ...
$ 0
Note: This is the company’s break-even point.
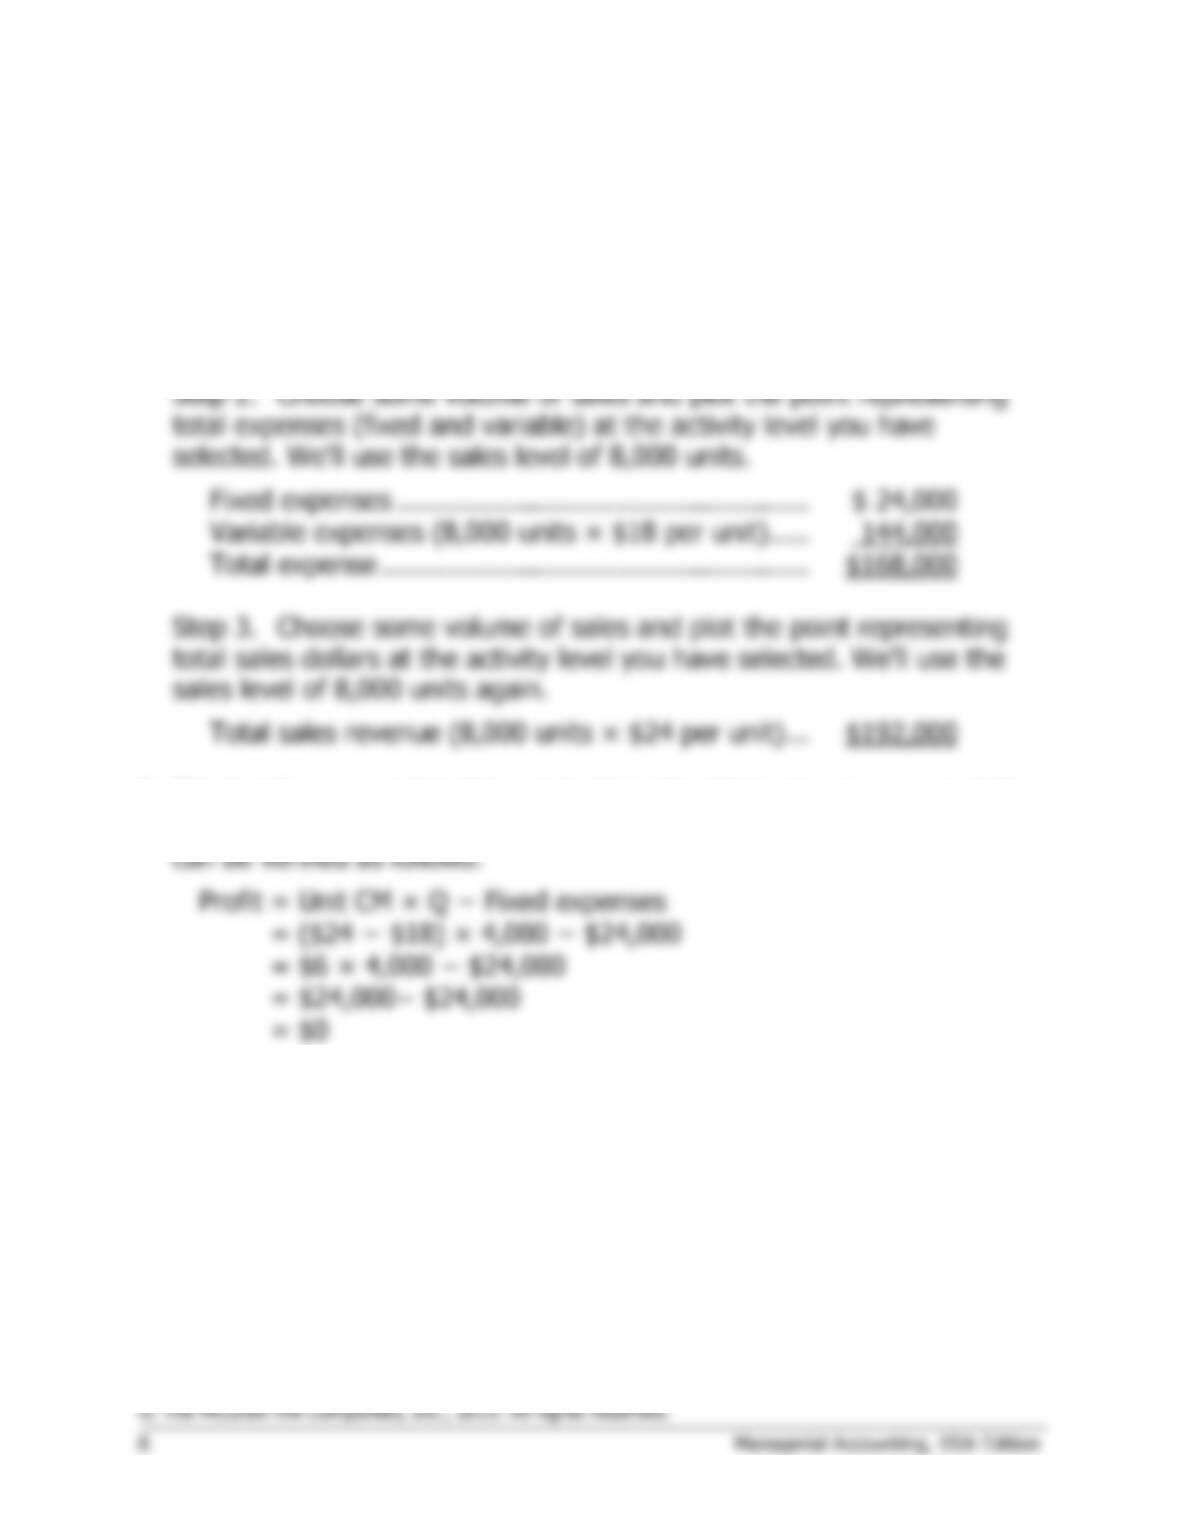
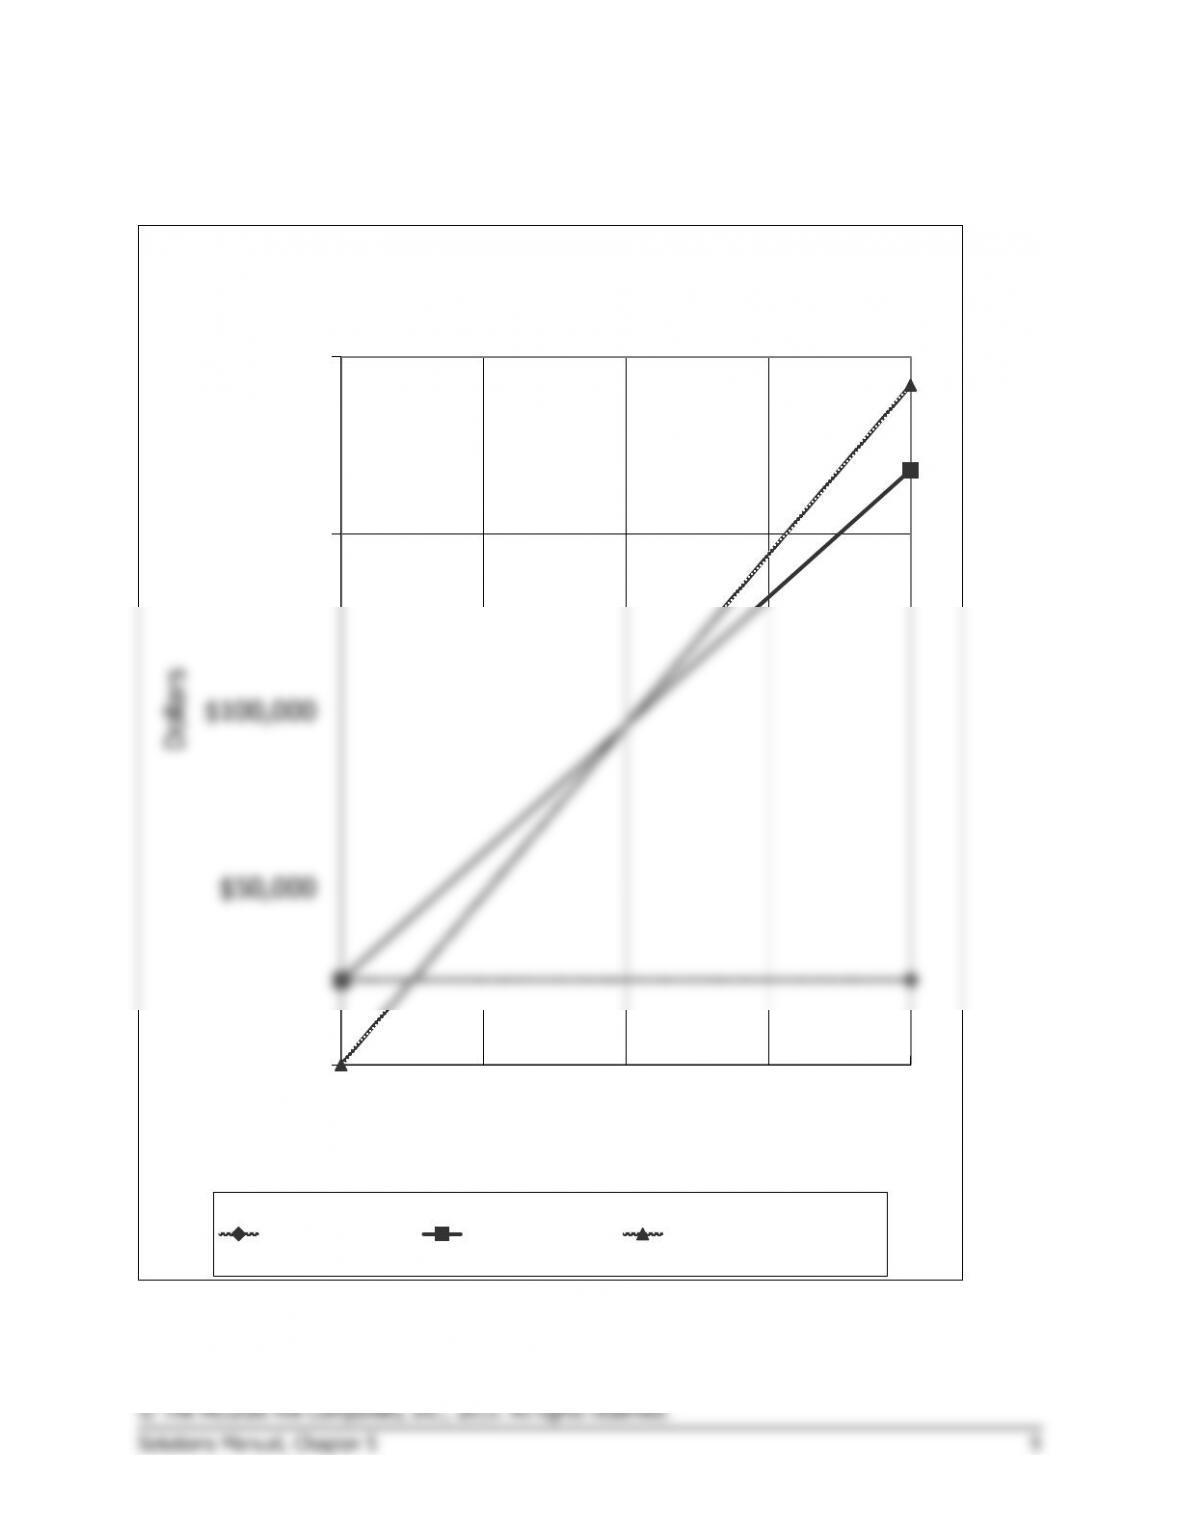
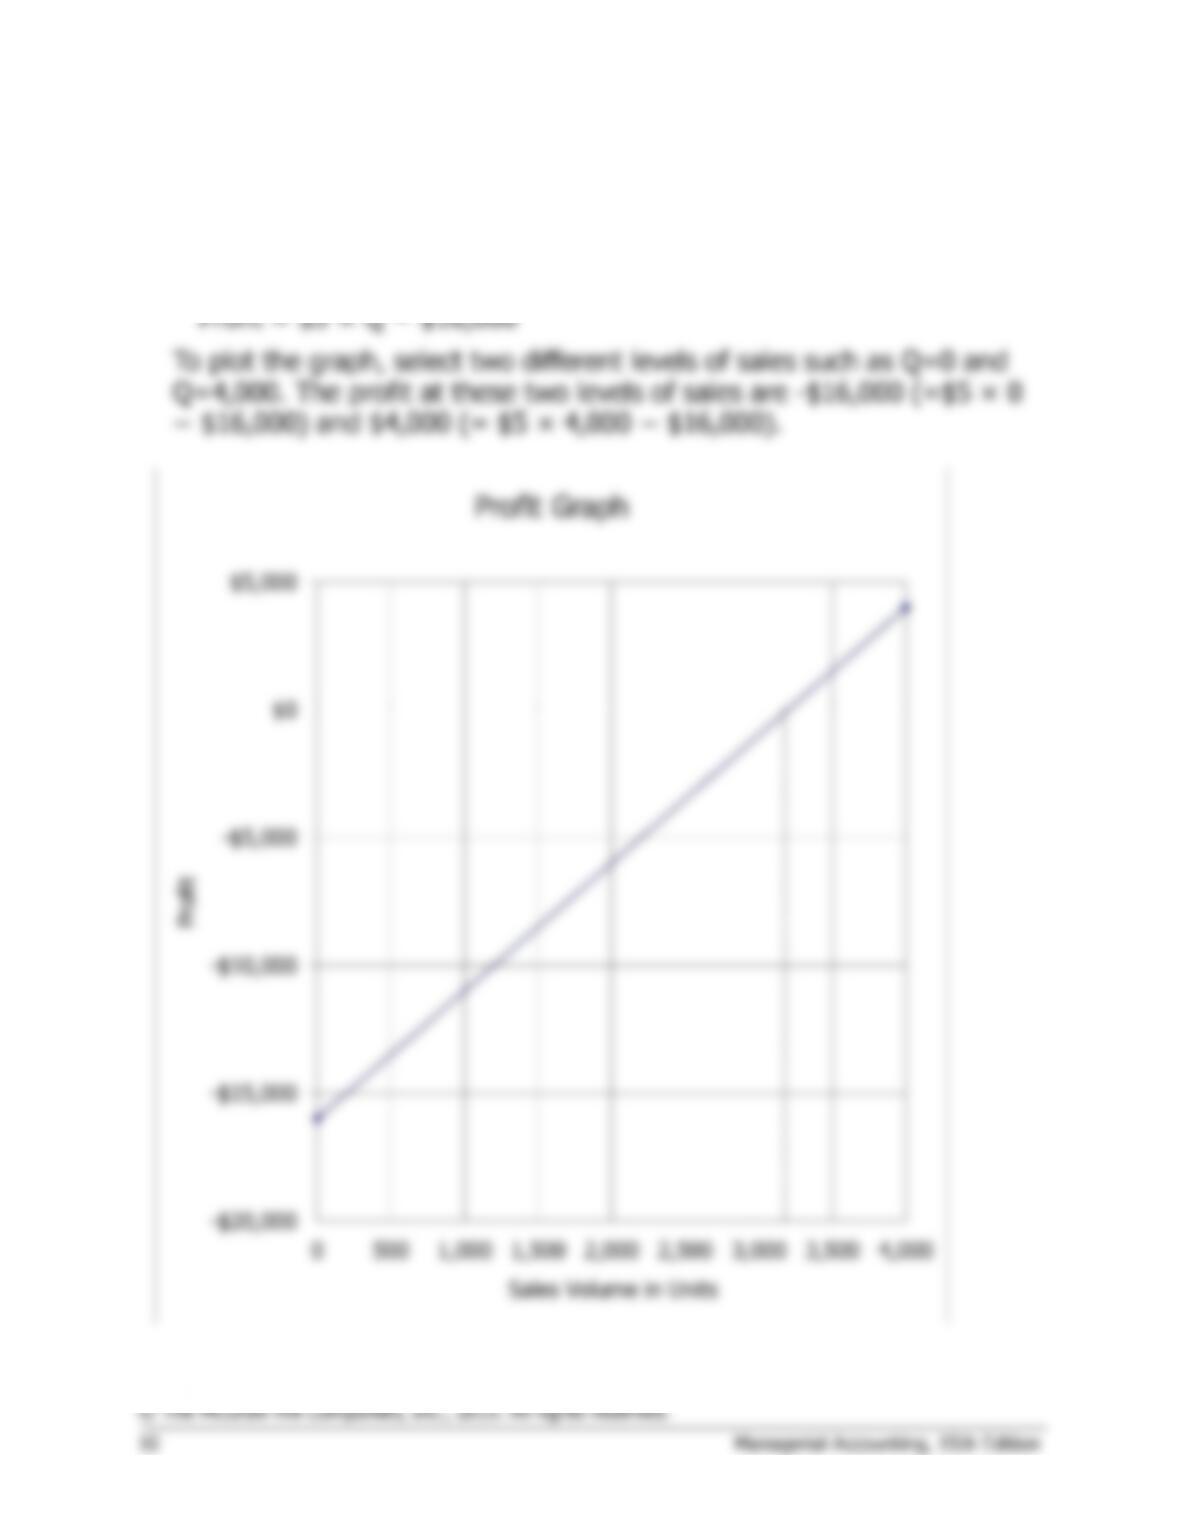
Exercise 5-2 (continued)
$0
$50,000
$100,000
$150,000
$200,000
0 2,000 4,000 6,000 8,000
Dollars
Volume in Units
CVP Graph
Fixed Expense Total Expense Total Sales Revenue