Problem 15-16 (continued)
2.
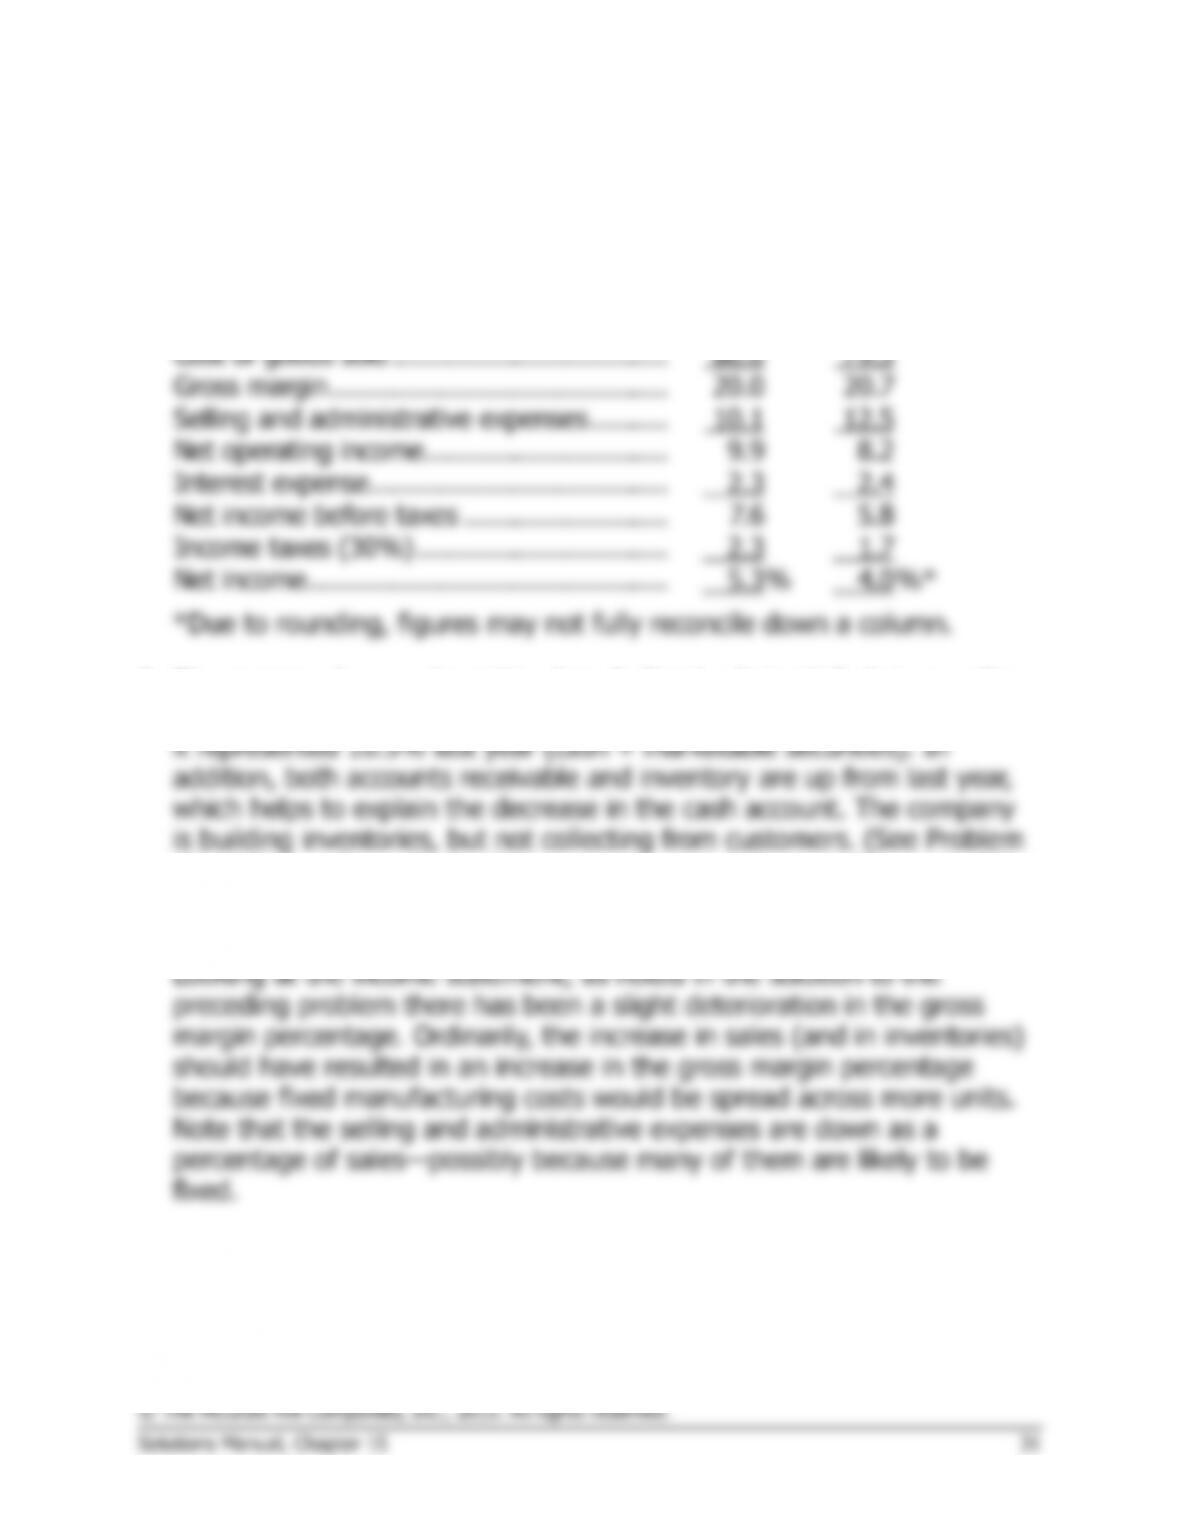
Lydex Company
Comparative Income Statements
This Year
Last Year
Sales ……………………………………………..
100.0
%
100.0
%
Cost of goods sold ……………………………..
80.0
79.3
Gross margin …………………………………….
20.0
20.7
Selling and administrative expenses ……….
10.1
12.5
Net operating income ………………………….
9.9
8.2
Interest expense ………………………………..
2.3
2.4
Net income before taxes ……………………..
7.6
5.8
Income taxes (30%) …………………………..
2.3
1.7
Net income ……………………………………….
5.3
%
4.0
%*
*Due to rounding, figures may not fully reconcile down a column.
3. The company’s current position has declined substantially between the
two years. Cash this year represents only 5.6% of total assets, whereas
15-15 for a ratio analysis of the current assets.) Apparently a part of the
financing required to build inventories was supplied by short-term
creditors, as evidenced by the increase in current liabilities.
Problem 15-18 (60 minutes)
This Year
Last Year
1.
a.
Current assets …………………………………..
$1,520,000
$1,090,000
Current liabilities ………………………………..
800,000
430,000
Working capital ………………………………….
$ 720,000
$ 660,000
b.
Current assets (a) ………………………………
$1,520,000
$1,090,000
Current liabilities (b) …………………………..
$800,000
$430,000
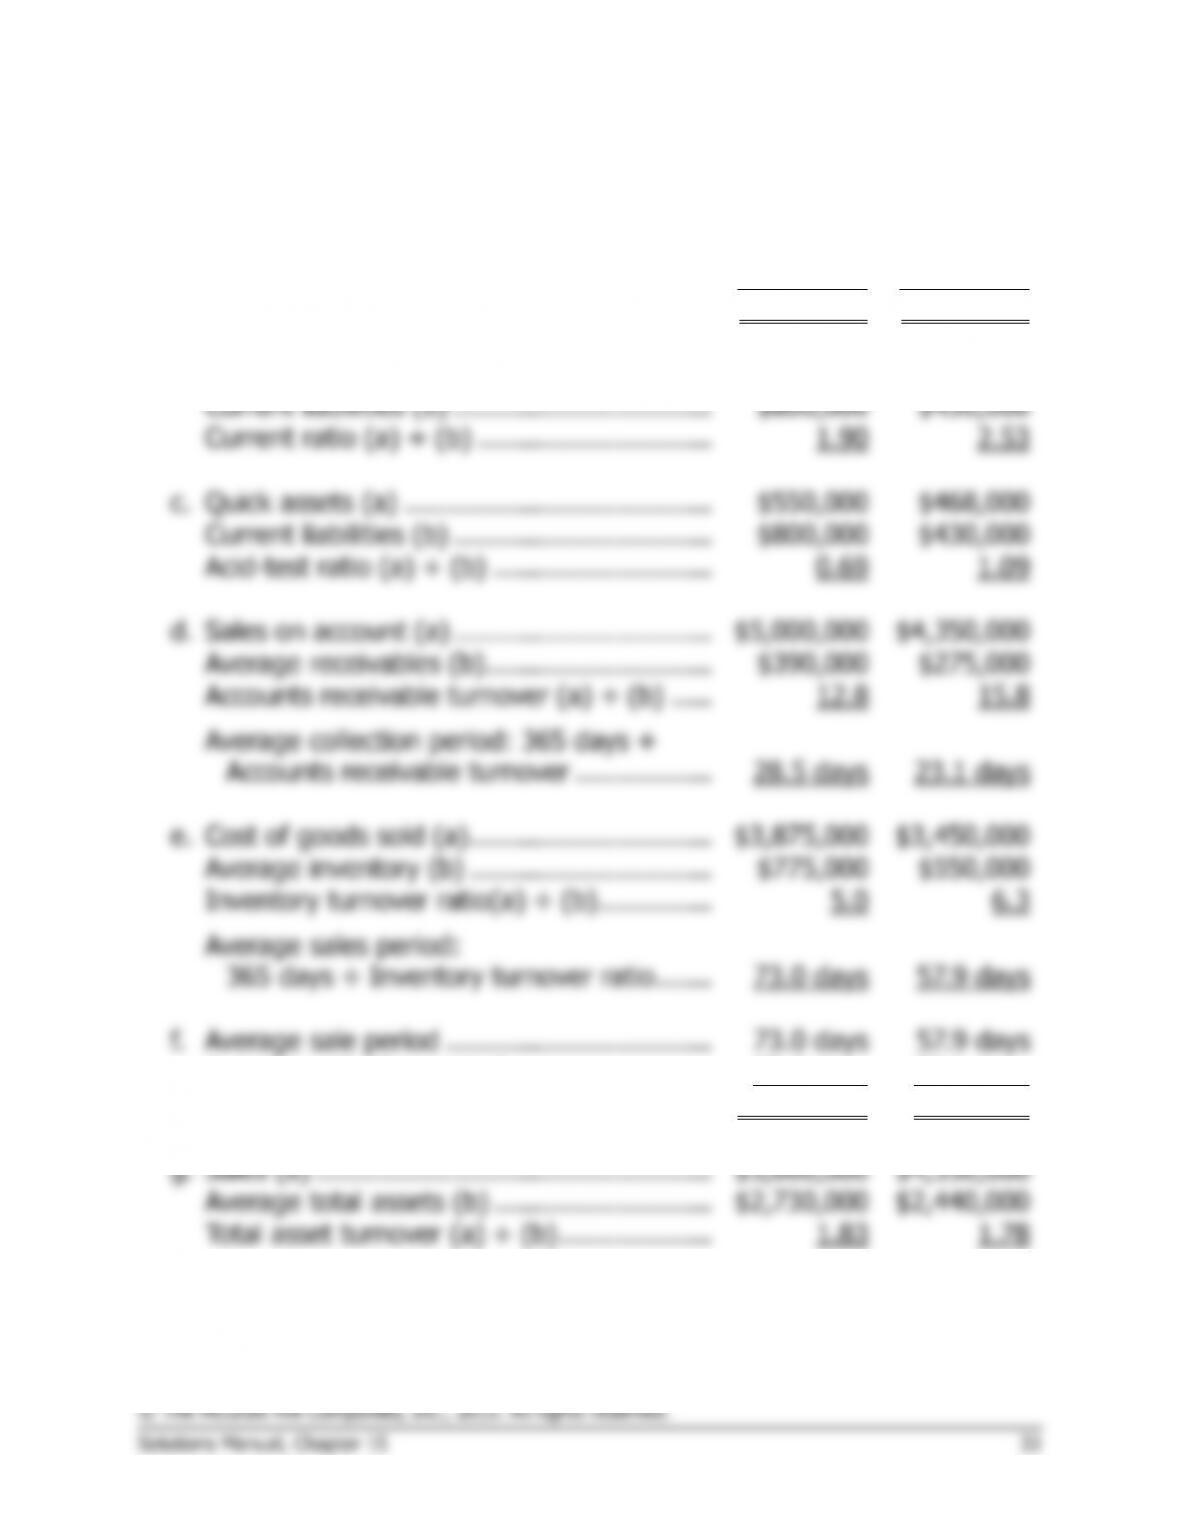
Current ratio (a) ÷ (b) ………………………..
1.90
2.53
c.
Quick assets (a) ………………………………..
$550,000
$468,000
Current liabilities (b) …………………………..
$800,000
$430,000
Acid-test ratio (a) ÷ (b) ………………………
0.69
1.09
d.
Sales on account (a) …………………………..
$5,000,000
$4,350,000
Average receivables (b) ……………………….
$390,000
$275,000
Accounts receivable turnover (a) ÷ (b) …..
12.8
15.8
Average collection period: 365 days ÷
Accounts receivable turnover ……………..
28.5 days
23.1 days
e.
Cost of goods sold (a) …………………………
$3,875,000
$3,450,000
Average inventory (b) …………………………
$775,000
$550,000
Inventory turnover ratio(a) ÷ (b) …………..
5.0
6.3
Average sales period:
365 days ÷ Inventory turnover ratio …….
73.0 days
57.9 days
f.
Average sale period …………………………...
73.0 days
57.9 days
Average collection period …………………….
28.5 days
23.1 days
Operating cycle …………………………………
101.5 days
81.0 days
g.
Sales (a) ………………………………………….
$5,000,000
$4,350,000
Average total assets (b) ………………………
$2,730,000
$2,440,000
Total asset turnover (a) ÷ (b) ……………….
1.83
1.78
Problem 15-18 (continued)
2.
a.
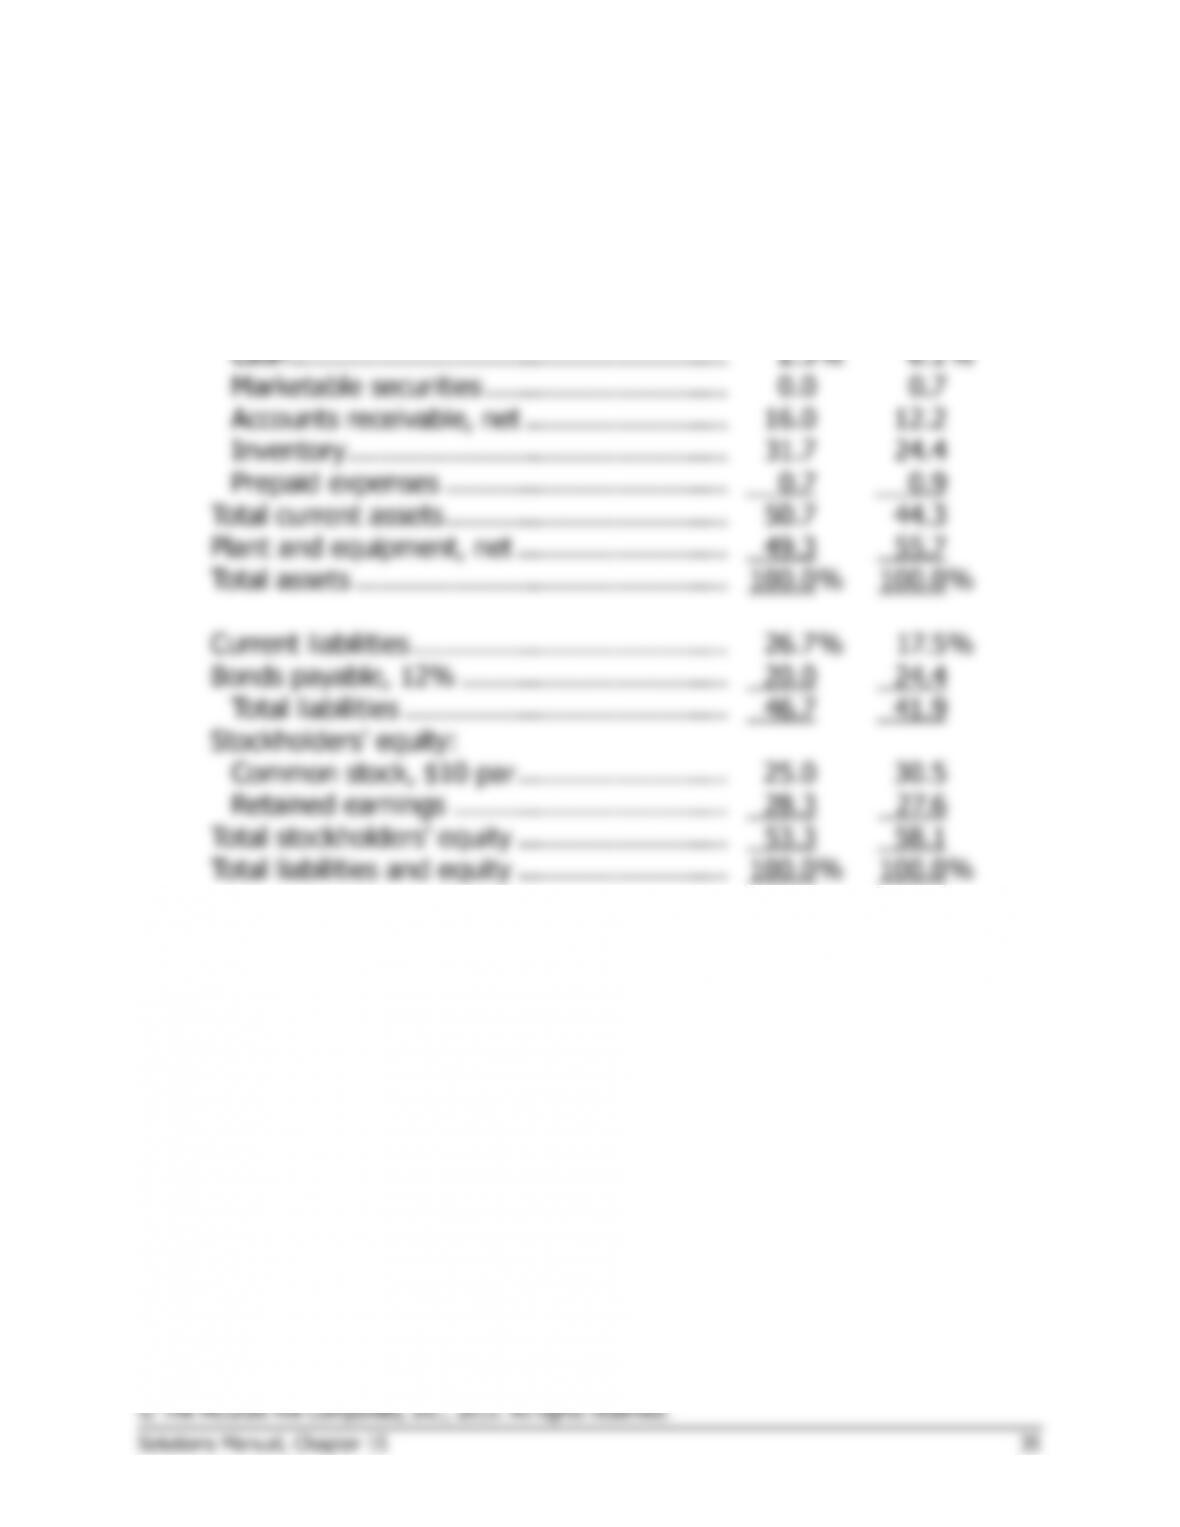
Sabin Electronics
Common-Size Balance Sheets
This Year
Last Year
Current assets:
Cash ………………………………………………
2.3
%
6.1
%
Marketable securities …………………………
0.0
0.7
Accounts receivable, net …………………….
16.0
12.2
Inventory ………………………………………..
31.7
24.4
Prepaid expenses ……………………………..
0.7
0.9
Total current assets ……………………………..
50.7
44.3
Plant and equipment, net ……………………..
49.3
55.7
Total assets …………………………..…………..
100.0
%
100.0
%
Current liabilities …………………………………
26.7
%
17.5
%
Bonds payable, 12% …………………………...
20.0
24.4
Total liabilities ………………………………….
46.7
41.9
Stockholders’ equity:
Common stock, $10 par ……………………..
25.0
30.5
Retained earnings …………………………….
28.3
27.6
Total stockholders’ equity ……………………..
53.3
58.1
Total liabilities and equity ……………………..
100.0
%
100.0
%
Problem 15-18 (continued)
b.
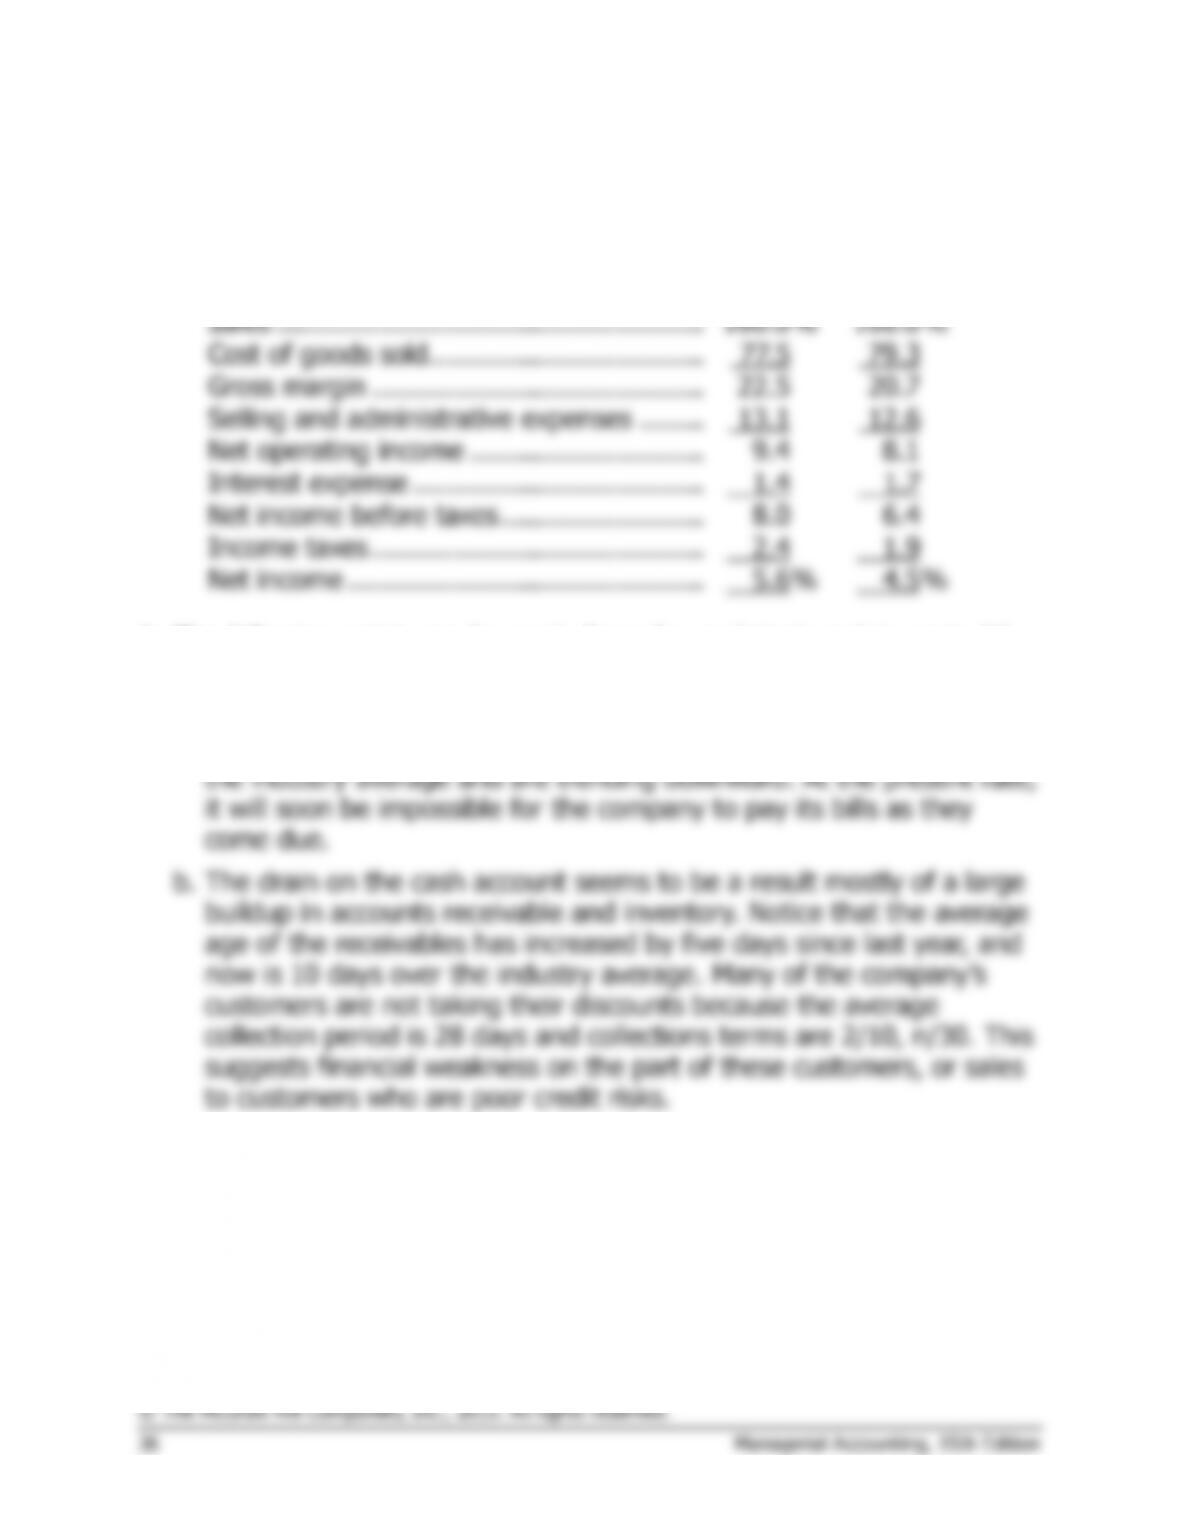
Sabin Electronics
Common-Size Income Statements
This Year
Last Year
Sales ……………………………………………..
100.0
%
100.0
%
Cost of goods sold …………………………….
77.5
79.3
Gross margin …………………………………..
22.5
20.7
Selling and administrative expenses ……..
13.1
12.6
Net operating income ………………………..
9.4
8.1
Interest expense …………………………..….
1.4
1.7
Net income before taxes …………………….
8.0
6.4
Income taxes …………………………………..
2.4
1.9
Net income ……………………………………..
5.6
%
4.5
%
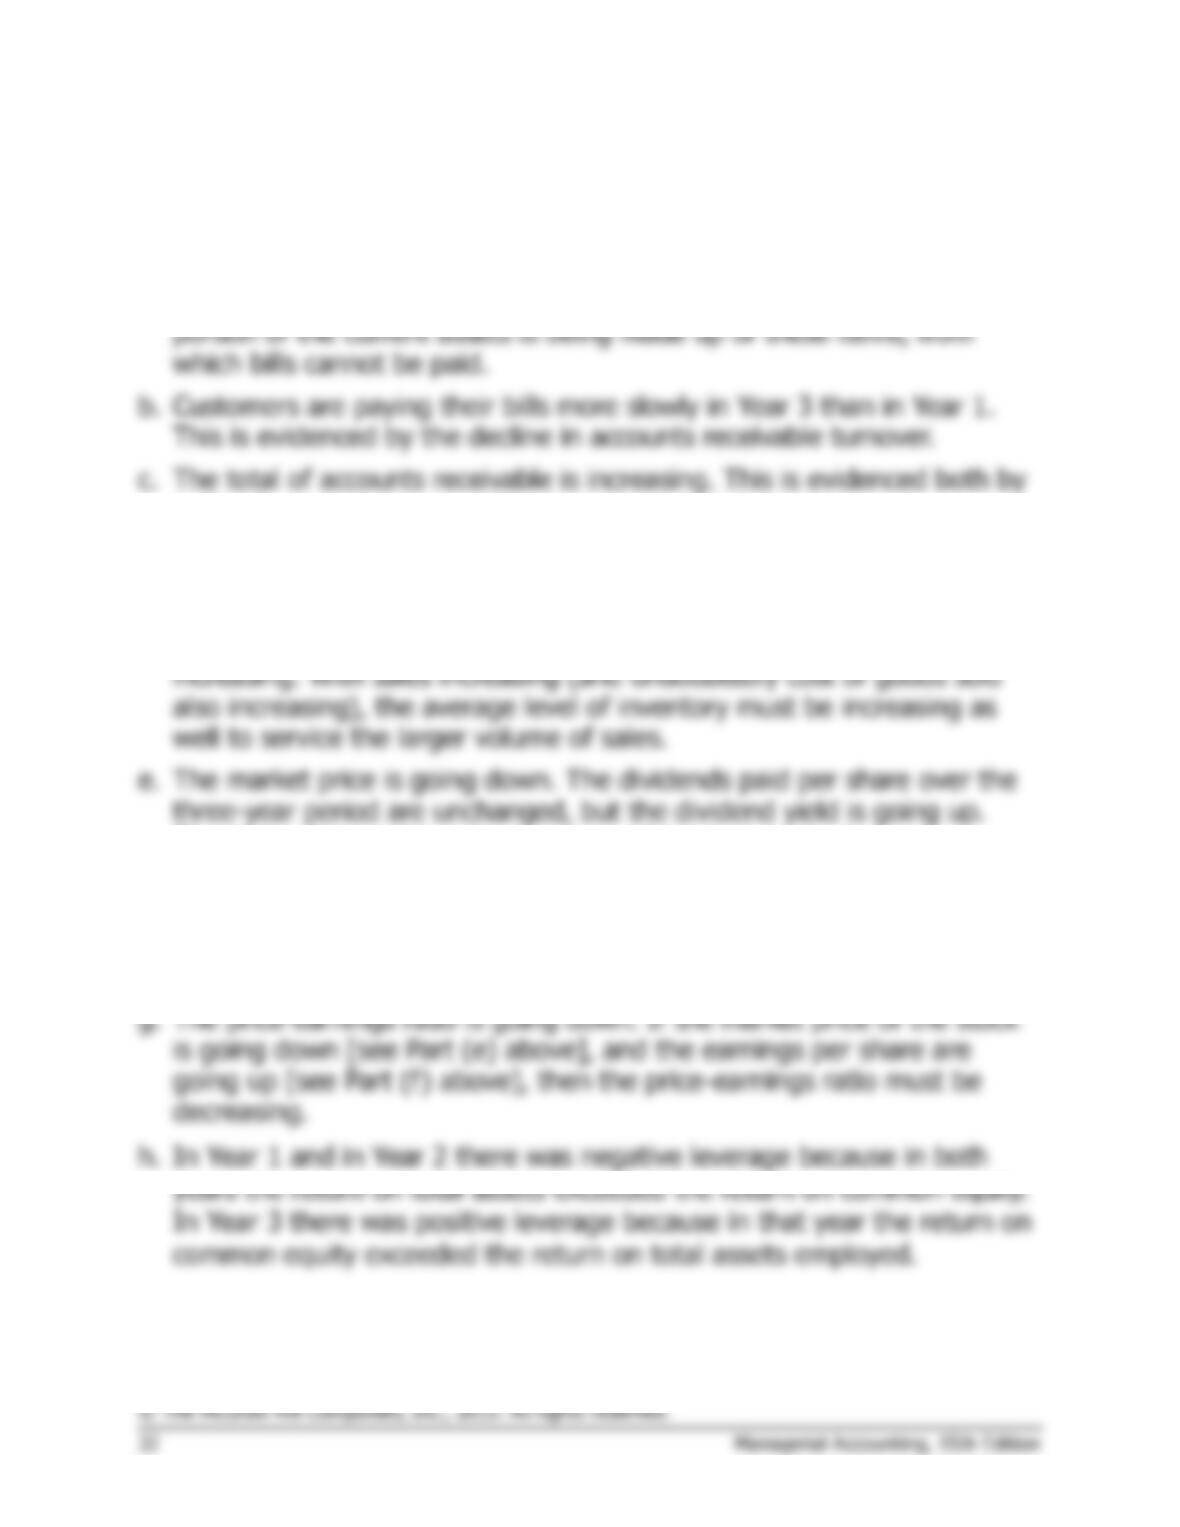
3. The following points can be made from the analytical work in parts (1)
and (2) above:
a. The company’s current position has deteriorated significantly since
last year. Both the current ratio and the acid-test ratio are well below
Problem 15-18 (continued)
c. The inventory turned only five times this year as compared to over six
times last year. It takes nearly two weeks longer for the company to
turn its inventory than the average for the industry (73 days as
Problem 15-19 (continued)
This Year
Last Year
e.
Total stockholders’ equity (a) ………………..
$1,600,000
$1,430,000
Number of common shares outstanding
(b) …………………………..……………………
50,000
50,000
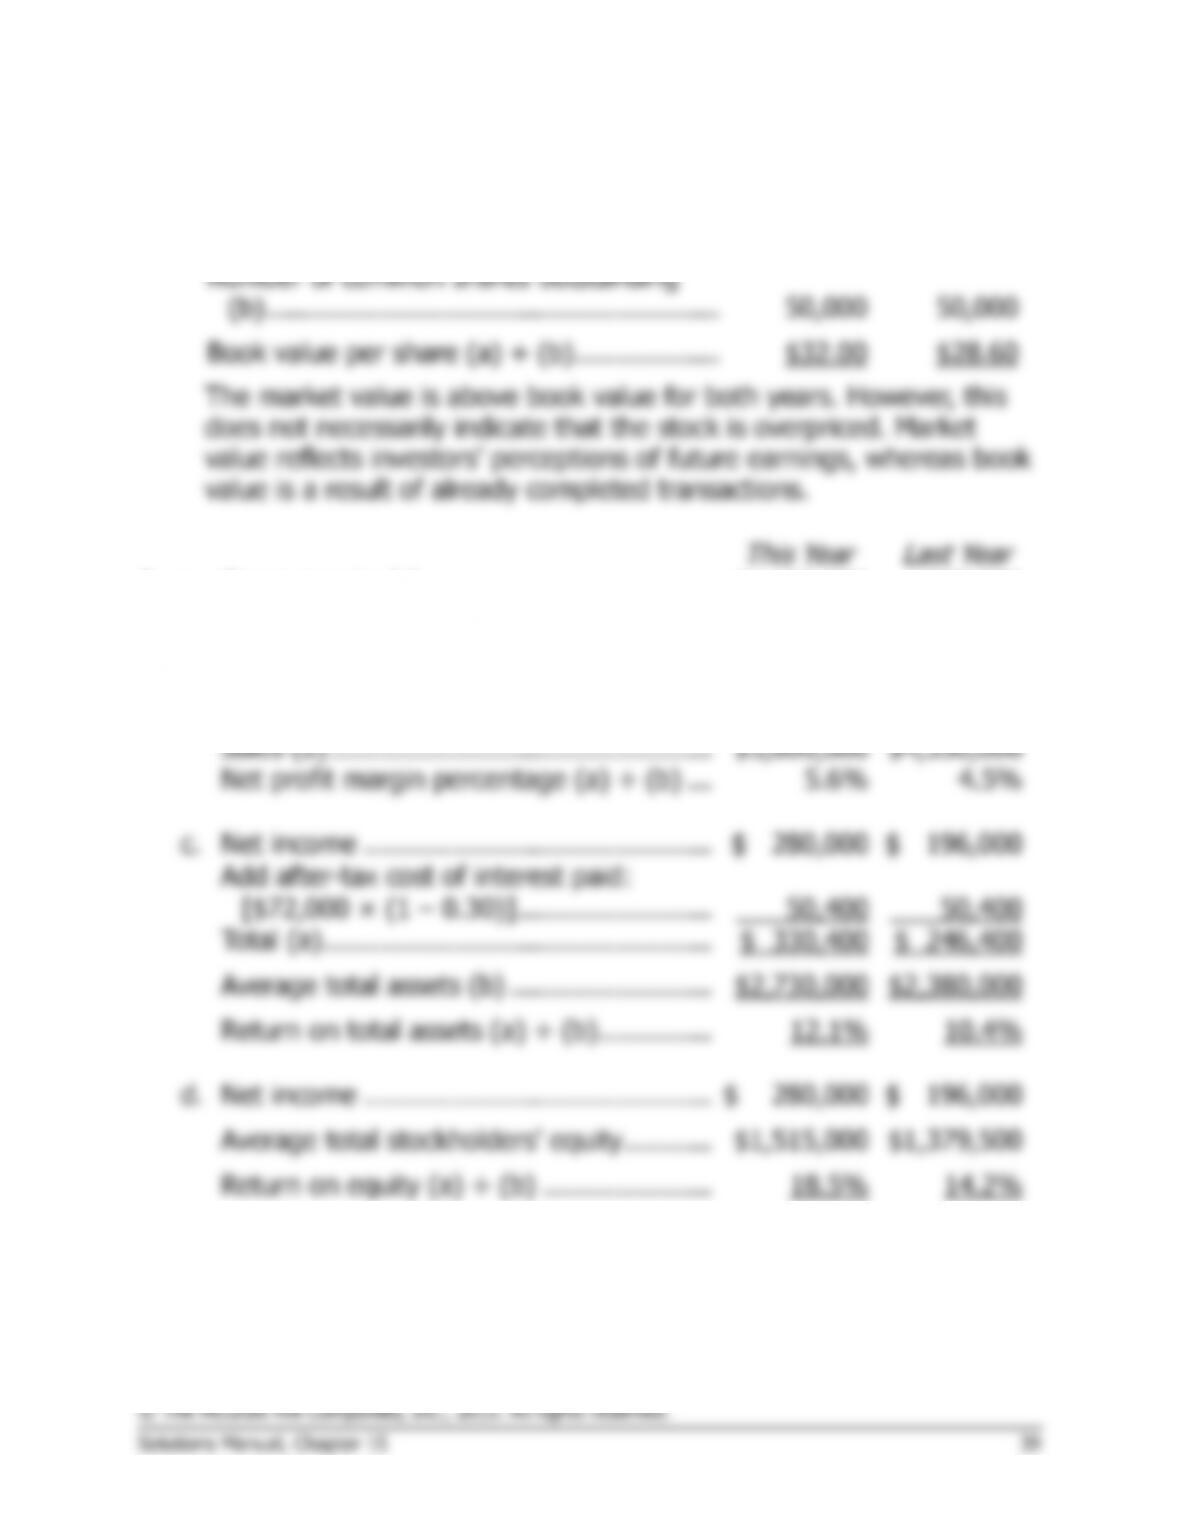
Book value per share (a) ÷ (b) ………………
$32.00
$28.60
The market value is above book value for both years. However, this
does not necessarily indicate that the stock is overpriced. Market
value reflects investors’ perceptions of future earnings, whereas book
value is a result of already completed transactions.
This Year
Last Year
2.
a.
Gross margin (a) ……………………………..
$1,125,000
$900,000
Sales (b) …………………………..……………
$5,000,000
$4,350,000
Gross margin percentage (a) ÷ (b) ………
22.5%
20.7%
b.
Net income (a) ………………………………..
$280,000
$196,000
Sales (b) …………………………..……………
$5,000,000
$4,350,000
Net profit margin percentage (a) ÷ (b) …
5.6%
4.5%
c.
Net income …………………………………….
$ 280,000
$ 196,000
Add after-tax cost of interest paid:
[$72,000 × (1 – 0.30)] ……………………
50,400
50,400
Total (a) …………………………………………
$ 330,400
$ 246,400
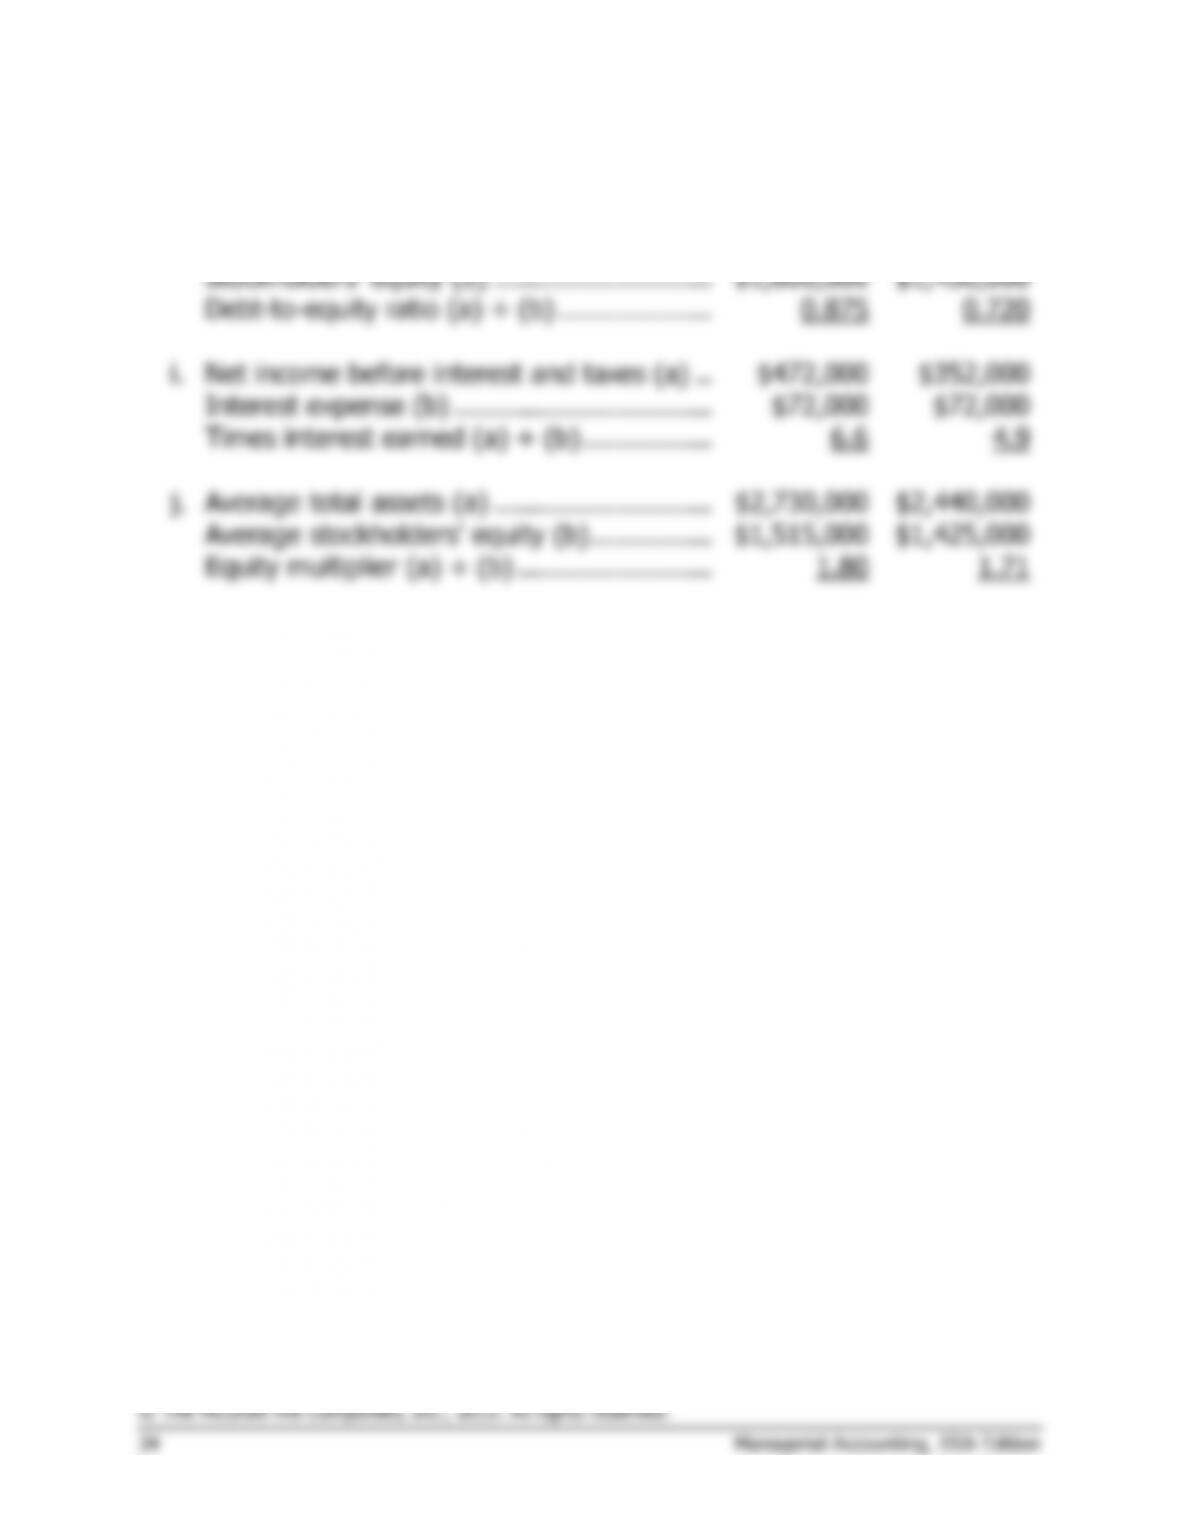
Average total assets (b) …………………….
$2,730,000
$2,380,000
Return on total assets (a) ÷ (b) …………..
12.1%
10.4%
d.
Net income …………………………………….
$ 280,000
$ 196,000
Average total stockholders’ equity ………..
$1,515,000
$1,379,500
Return on equity (a) ÷ (b) …………………
18.5%
14.2%