$ 17,425
27,500
$114,270
$ 41,845
Problem 8-4B (40 minutes)
2012
Jan. 1
Machinery ……………………………………………………….
114,270
Cash ………………………………………………………….…..
114,270
To record costs of machinery ($107,800 +$6,470).
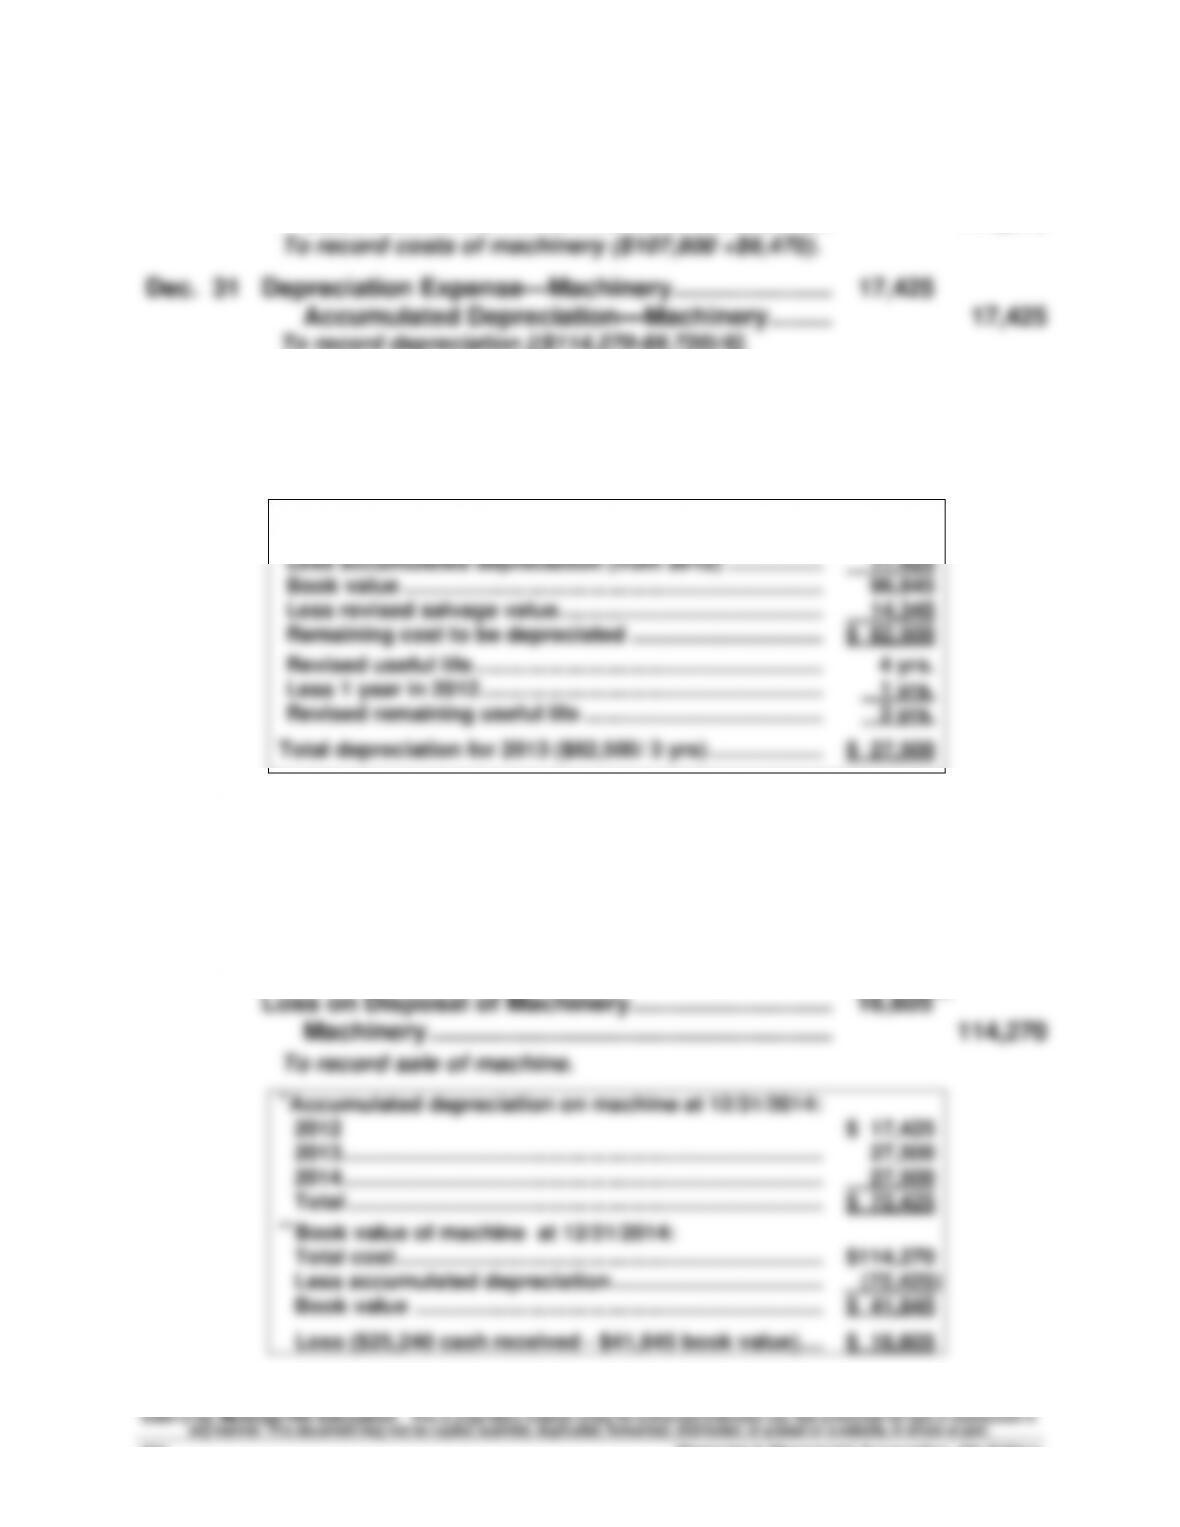
Dec. 31
Depreciation Expense—Machinery …………………..…..
17,425
Accumulated Depreciation—Machinery …………..
17,425
To record depreciation [($114,270-$9,720)/6].
2013
Dec. 31
Depreciation Expense—Machinery …………………..…..
27,500*
Accum. Depreciation—Machinery …………………..
27,500
To record depreciation.
*2013 depreciation:
Total cost ……………………………………………………………………….
$114,270
Less accumulated depreciation (from 2012) …………….……….
17,425
Book value …………………………………………………………….……….
96,845
Less revised salvage value ……………………………………..……….
14,345
Remaining cost to be depreciated …………………………..
$ 82,500
Revised useful life ………………………………………………….……
4 yrs.
Less 1 year in 2012 ……………………………………………………….
1 yrs.
Revised remaining useful life ………………………………….……….
3 yrs.
Total depreciation for 2013 ($82,500/ 3 yrs) ……………….……….
$ 27,500
2014
Dec. 31
Depreciation Expense—Machinery …………………..…..
27,500
Accumulated Depreciation—Machinery …………..
27,500
To record depreciation.
Dec. 31
Cash ……………………………………………………………….…..
25,240
Accumulated Depreciation—Machinery ………………..
72,425**
Loss on Disposal of Machinery ………………………..…
16,605***
Machinery ………………………………………………….…..
114,270
To record sale of machine.
Problem 8-5B (25 minutes)
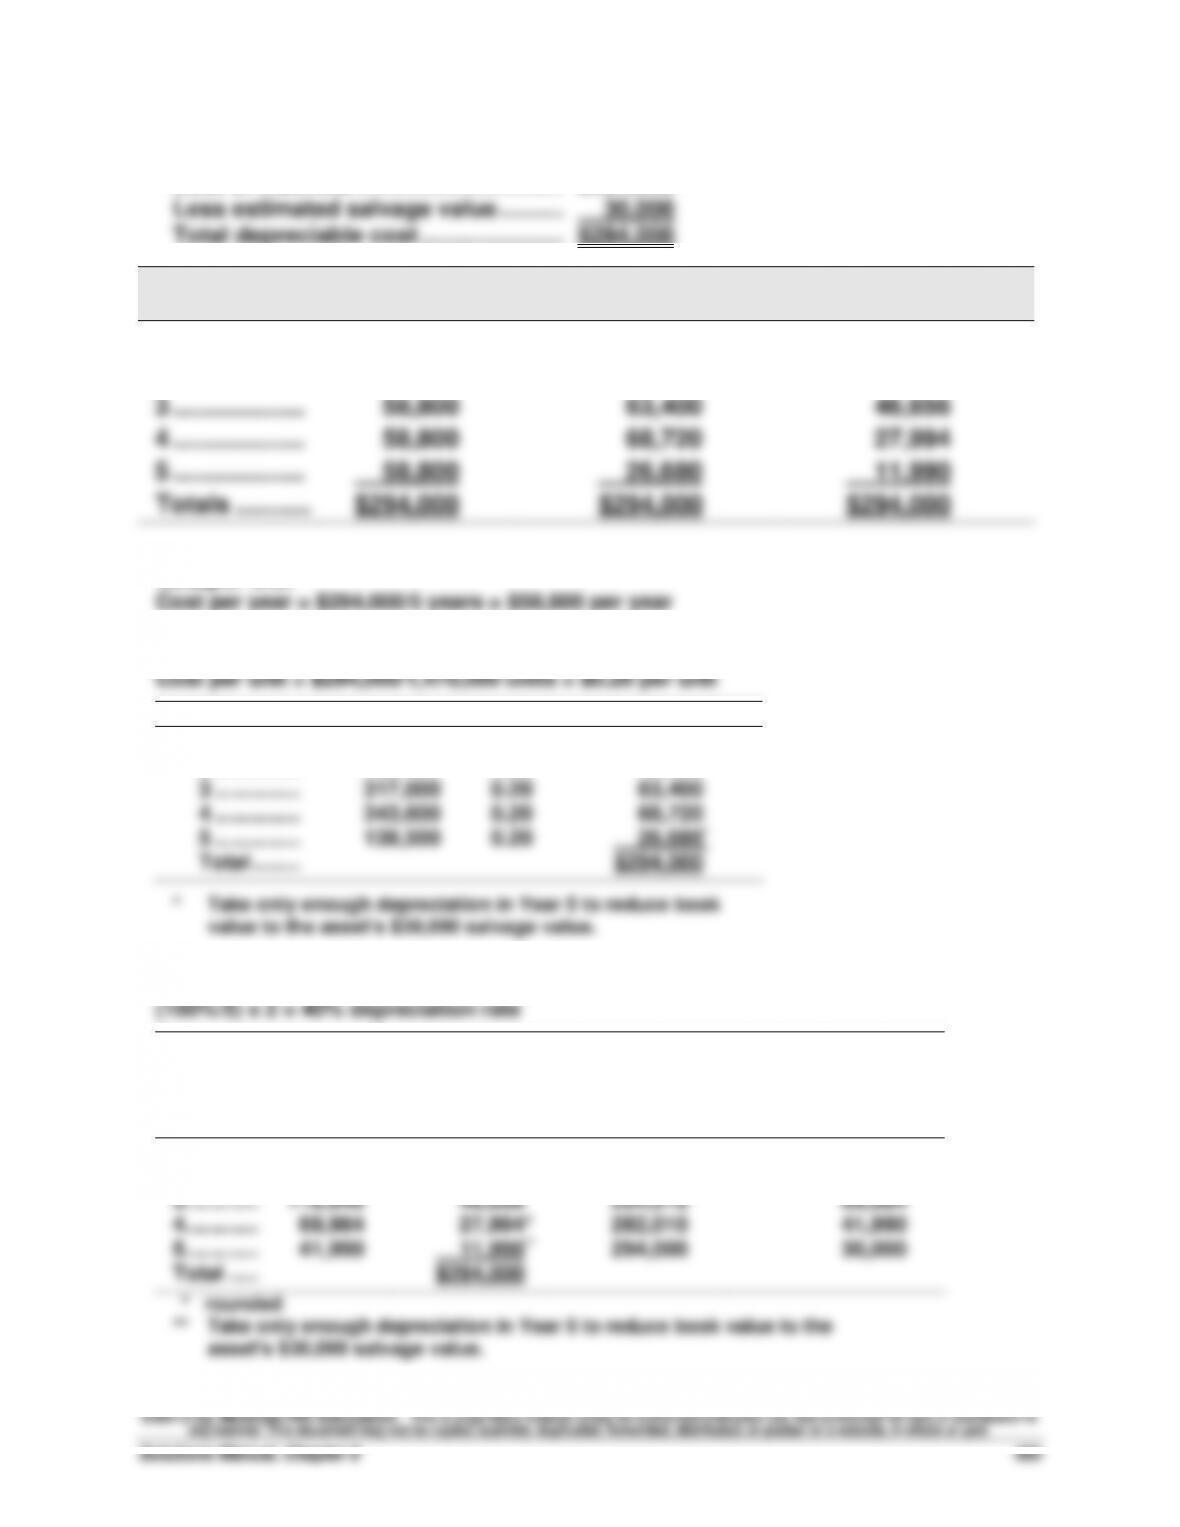
Cost of machine …………………………..
$324,000
Less estimated salvage value ……….………………….
30,000
Total depreciable cost ………………….……….
$294,000
Year
Straight-Linea
Units-of-Productionb
Double-Declining-
Balancec
1 ……………….
$ 58,800
$ 71,120
$129,600
2 ……………….
58,800
64,080
77,760
3 ……………….
58,800
63,400
46,656
4 ……………….
58,800
68,720
27,994
5 ……………….
58,800
26,680
11,990
Totals ………..
$294,000
$294,000
$294,000
aStraight- line:
bUnits-of-production:
Year
Units
Unit Cost
Depreciation
1 …………..
355,600
$0.20
$ 71,120
2 …………..
320,400
0.20
64,080
3 …………..
317,000
0.20
63,400
4 …………..
343,600
0.20
68,720
5 …………..
138,500
0.20
26,680*
Total ……..
$294,000
* Take only enough depreciation in Year 5 to reduce book
value to the asset’s $30,000 salvage value.
cDouble-declining-balance (amounts rounded to the nearest dollar):
Year
Beginning
Book Value
Annual
Depreciation
(40% of
Book Value)
Accumulated
Depreciation
at the End of
the Year
Ending Book Value
($324,000 Cost less
Accumulated
Depreciation)
1 …………
$324,000
$129,600
$129,600
$194,400
2 …………
194,400
77,760
207,360
116,640
3 …………
116,640
46,656
254,016
69,984
4 …………
69,984
27,994*
282,010
41,990
5 …………
41,990
11,990**
294,000
30,000
Total …..
$294,000
* rounded
** Take only enough depreciation in Year 5 to reduce book value to the
asset’s $30,000 salvage value.
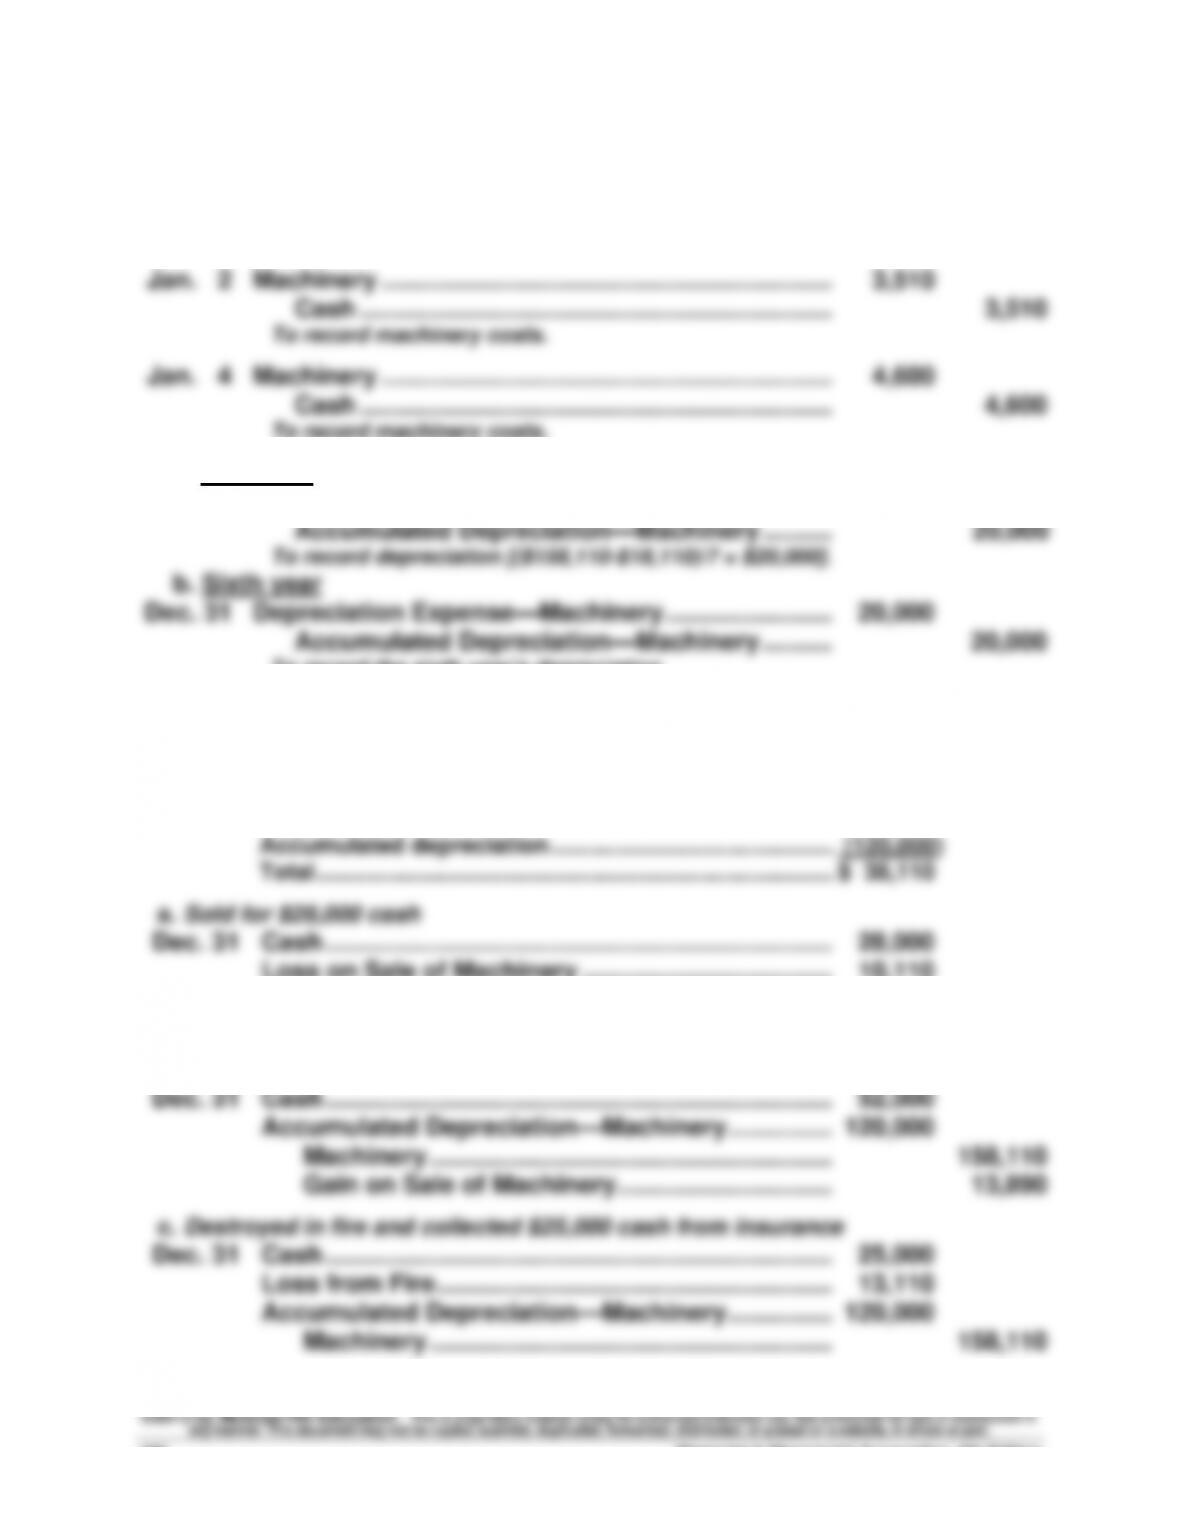
Dec. 31
Cash ……………………………………………………………….…..
25,000
Loss from Fire ……………………………………………………..
13,110
Accumulated Depreciation—Machinery ………………..
120,000
Problem 8-6B (20 minutes)
1.
Jan. 1
Machinery ………………………………………………………...
150,000
Cash …………………………..……………………………….
150,000
To record machinery costs.
Jan. 2
Machinery ………………………………………………………...
3,510
Cash …………………………..……………………………….
3,510
To record machinery costs.
Jan. 4
Machinery ………………………………………………………...
4,600
Cash …………………………..……………………………….
4,600
To record machinery costs.
2. a. First year
Dec. 31
Depreciation Expense—Machinery ……………………….
20,000
Accumulated Depreciation—Machinery ……….….
20,000
To record depreciation [($158,110-$18,110)/7 = $20,000].
b. Sixth year
Dec. 31
Depreciation Expense—Machinery ……………………….
20,000
Accumulated Depreciation—Machinery ……….….
20,000
To record the sixth year’s depreciation.
3. Accumulated depreciation at the date of disposal
First six years’ depreciation (6 x $20,000) ………………...
$120,000
Book value at the date of disposal
Original total cost …………………………………………………...
$158,110
Accumulated depreciation ……………………………………....
(120,000)
Total ……………………………………………………………………....
$ 38,110
a. Sold for $28,000 cash
Dec. 31
Cash ……………………………………………………………….…..
28,000
Loss on Sale of Machinery …………………………..….…..
10,110
Accumulated Depreciation—Machinery ………………..
120,000
Machinery ………………………………………………….…..
158,110
b. Sold for $52,000 cash
Dec. 31
Cash ……………………………………………………………….…..
52,000
Accumulated Depreciation—Machinery ………………..
120,000
Machinery ………………………………………………….…..
158,110
Gain on Sale of Machinery …………………………..
13,890
Problem 8-7B (20 minutes)
a.
Feb. 19
Mineral Deposit ………………………………………….………..
5,400,000
Cash …………………………………………………….…
5,400,000
To record purchase of mineral deposit.
b.
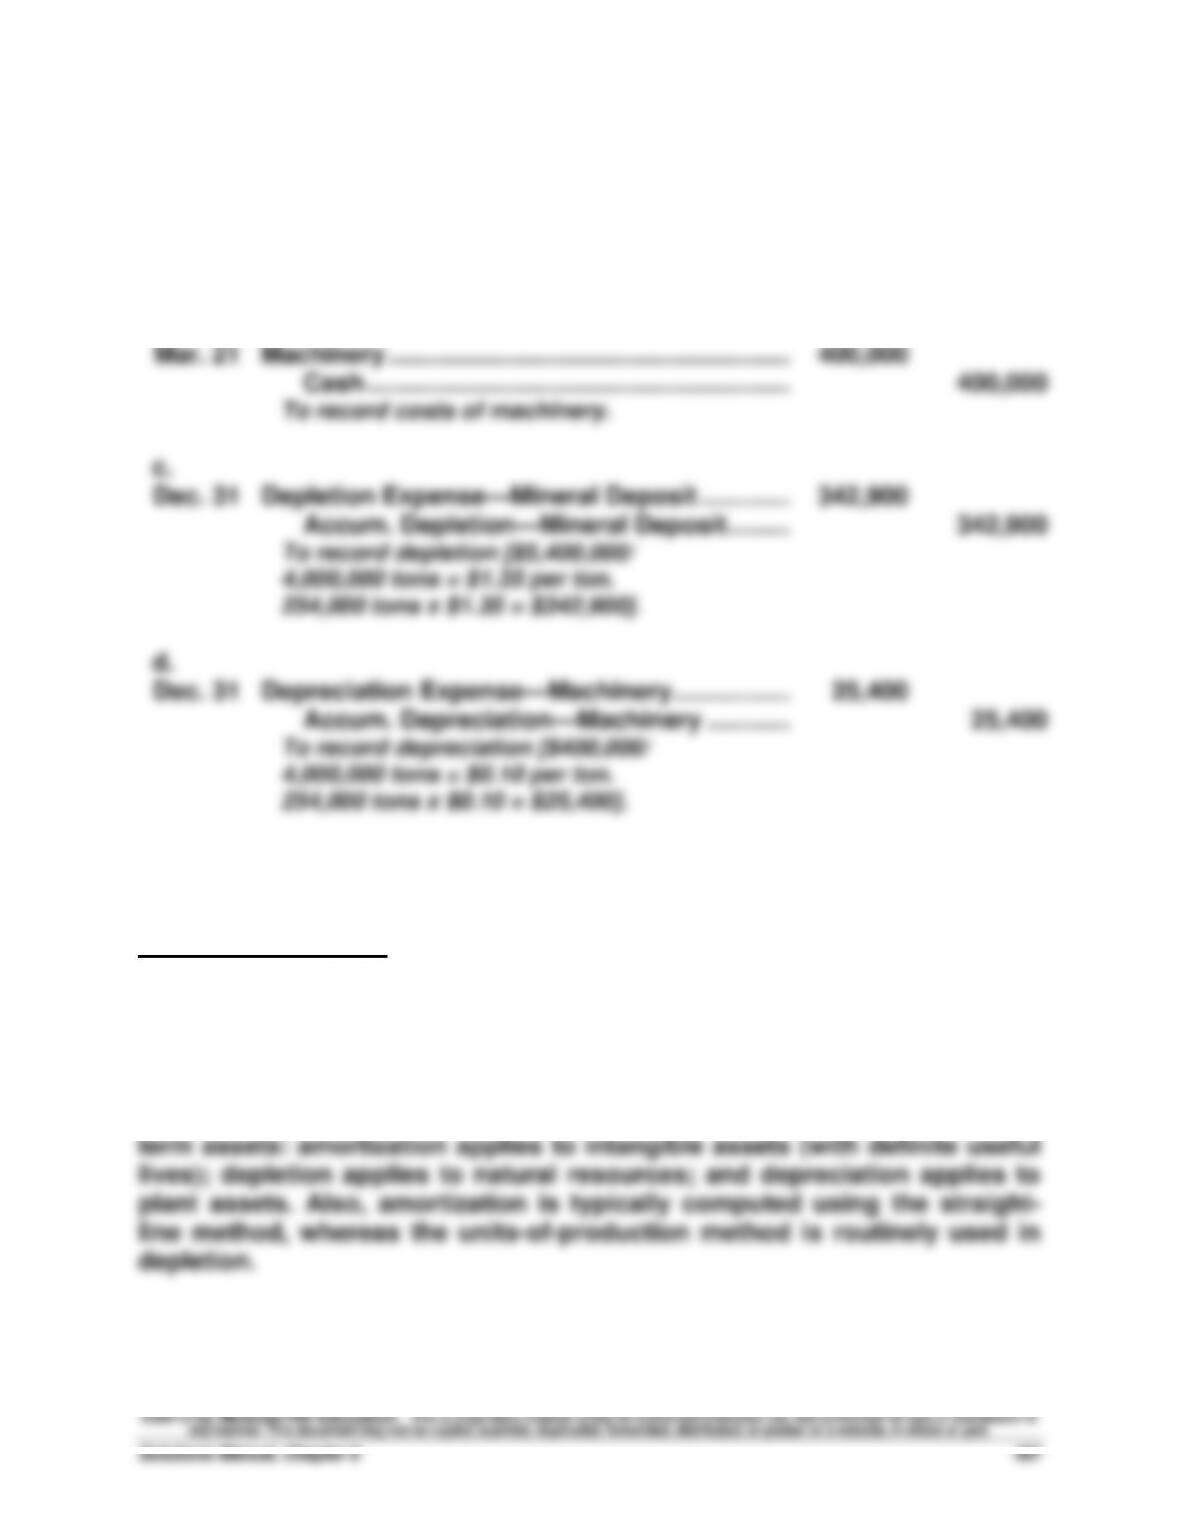
Mar. 21
Machinery ………………………………………………….……
400,000
Cash …………………………………………………….…
400,000
To record costs of machinery.
c.
Dec. 31
Depletion Expense—Mineral Deposit ………….………..
342,900
Accum. Depletion—Mineral Deposit ………………..
342,900
To record depletion [$5,400,000/
4,000,000 tons = $1.35 per ton.
254,000 tons x $1.35 = $342,900].
d.
Dec. 31
Depreciation Expense—Machinery ……………..………..
25,400
Accum. Depreciation—Machinery …………………..
25,400
To record depreciation [$400,000/
4,000,000 tons = $0.10 per ton.
254,000 tons x $0.10 = $25,400].
Analysis Component
Similarities—Amortization, depletion, and depreciation are similar in that
they are all methods of allocating costs of long-term assets to the periods
that benefit from their use.
Differences—They are different in that they apply to different types of long–
Financial & Managerial Accounting, 5th Edition
488
Problem 8-8B (20 minutes)
1.
2013
(a)
Jan. 1
Leasehold ……………………………………………………….
40,000
Cash ………………………………………………………….…..
40,000
To record payment for sublease.
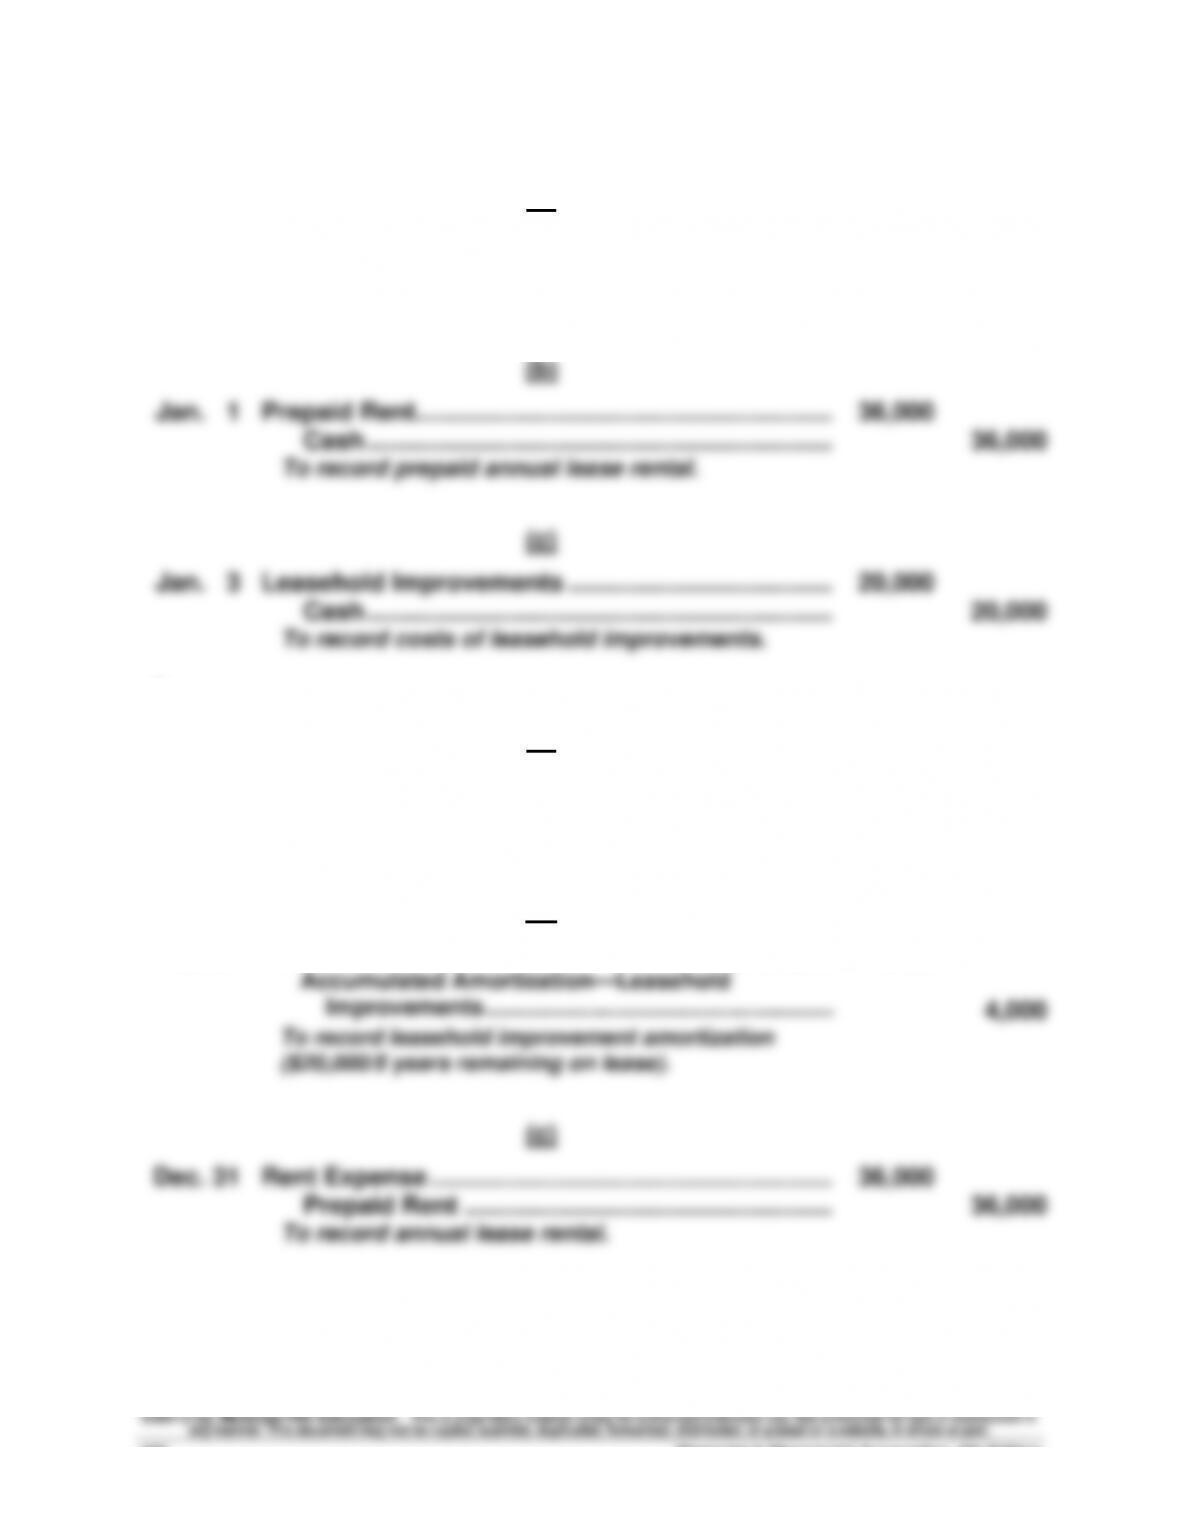
(b)
Jan. 1
Prepaid Rent……………………………………………………….
36,000
Cash ………………………………………………………….…..
36,000
To record prepaid annual lease rental.
(c)
Jan. 3
Leasehold Improvements ………………………………..…..
20,000
Cash ………………………………………………………….…..
20,000
To record costs of leasehold improvements.
2.
2013
(a)
Dec. 31
Rent Expense ………………………………………………….…..
8,000
Accumulated Amortization—Leasehold …………..
8,000
To record leasehold amortization ($40,000/5).
(b)
Dec. 31
Amortization Expense—Leasehold Improvements ….…..
4,000
Accumulated Amortization—Leasehold
Improvements …………………………………………………..
4,000
To record leasehold improvement amortization
($20,000/5 years remaining on lease).
(c)
Dec. 31
Rent Expense ………………………………………………….…..
36,000
Prepaid Rent ……………………………………………..…..
36,000
To record annual lease rental.
Serial Problem — SP 8
Serial Problem — SP 8, Success Systems (45 minutes)
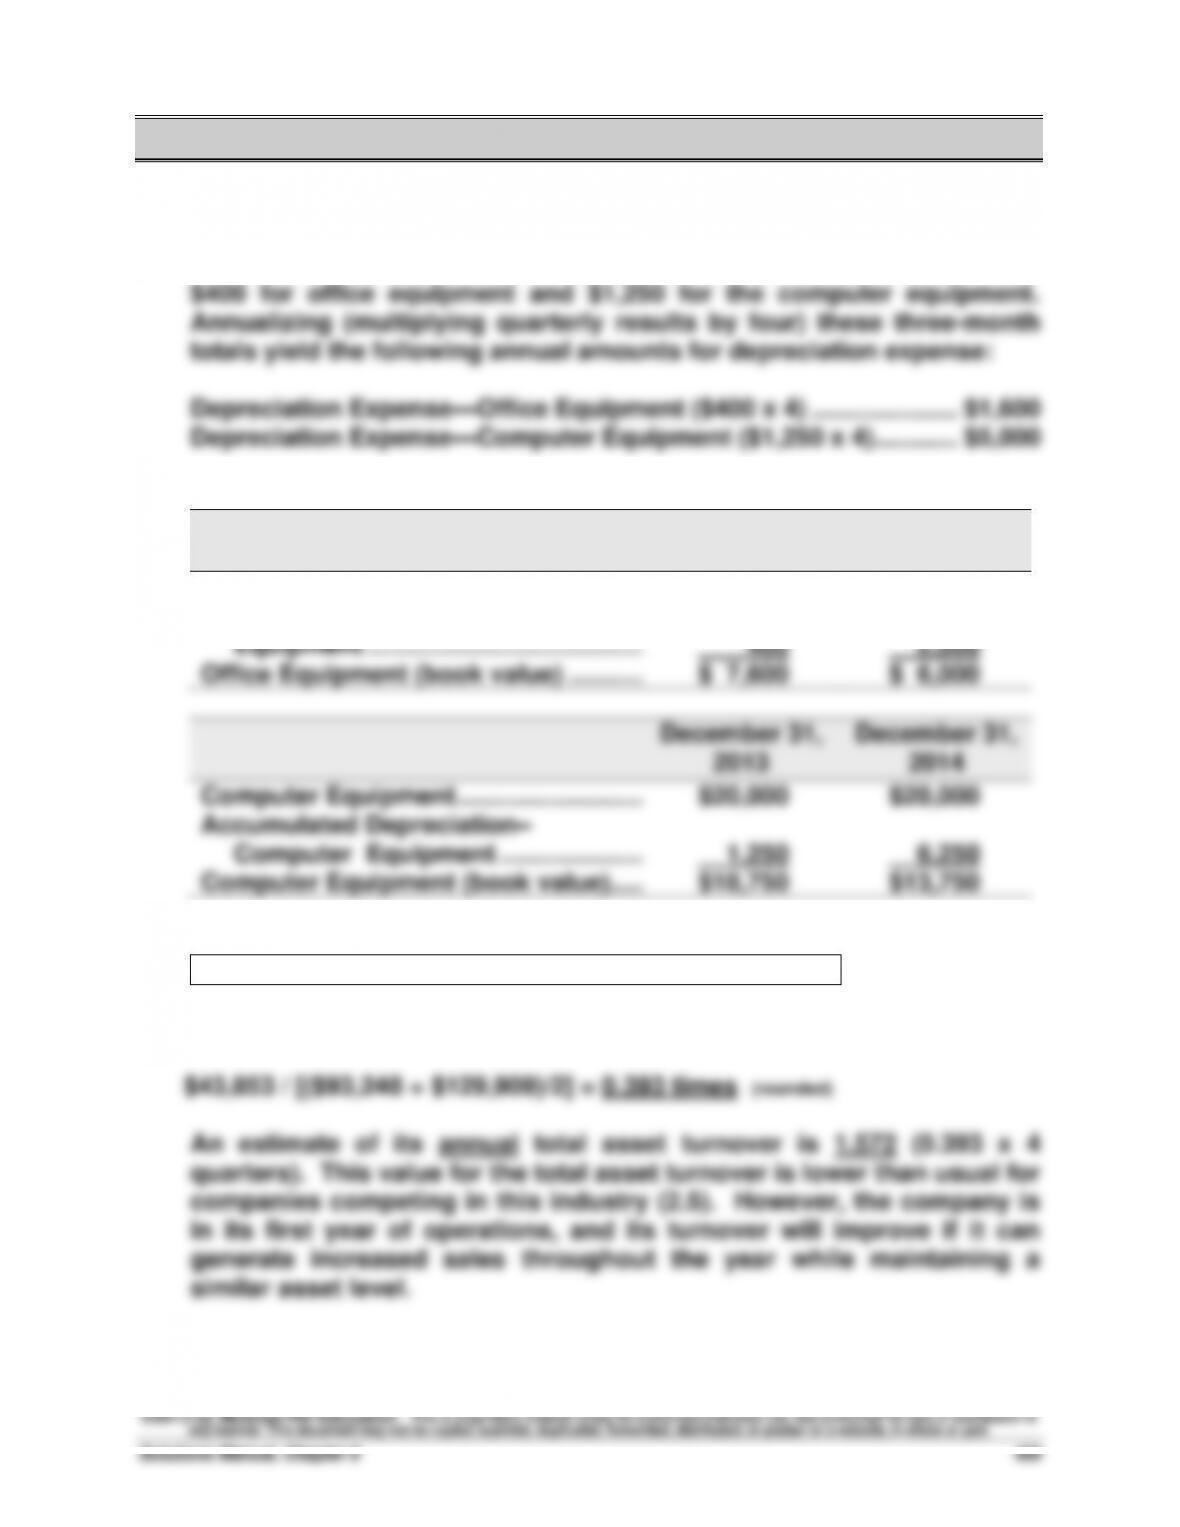
1. For the three months ended March 31, 2014, depreciation expense was
2.
December 31,
2013
December 31,
2014
Office Equipment …………………………….……
$ 8,000
$ 8,000
Accumulated Depreciation–Office
Equipment ………………………………….……
400
2,000
Office Equipment (book value) ………..……
$ 7,600
$ 6,000
December 31,
2013
December 31,
2014
Computer Equipment …………………………..
$20,000
$20,000
Accumulated Depreciation–
Computer Equipment ………………………
1,250
6,250
Computer Equipment (book value) …..……
$18,750
$13,750
3.
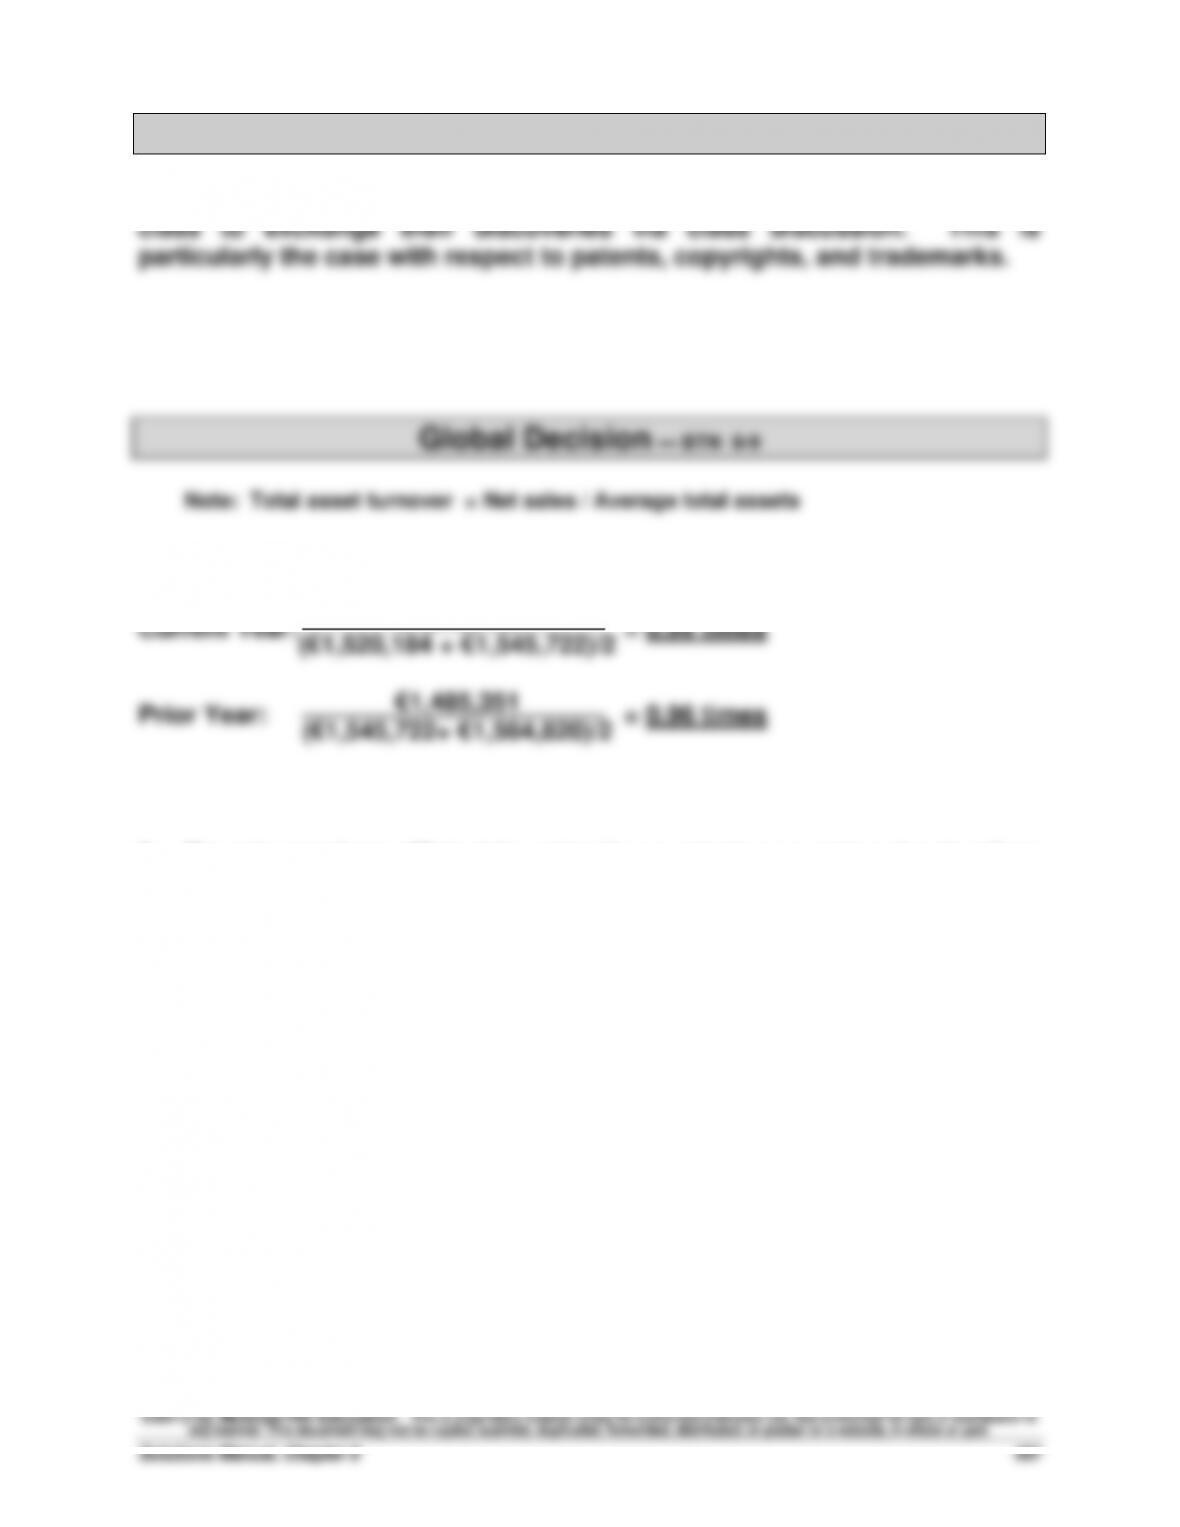
Total asset turnover = Net sales / Average total assets
The 3-month total asset turnover at March 31, 2014:
Reporting in Action — BTN 8-1
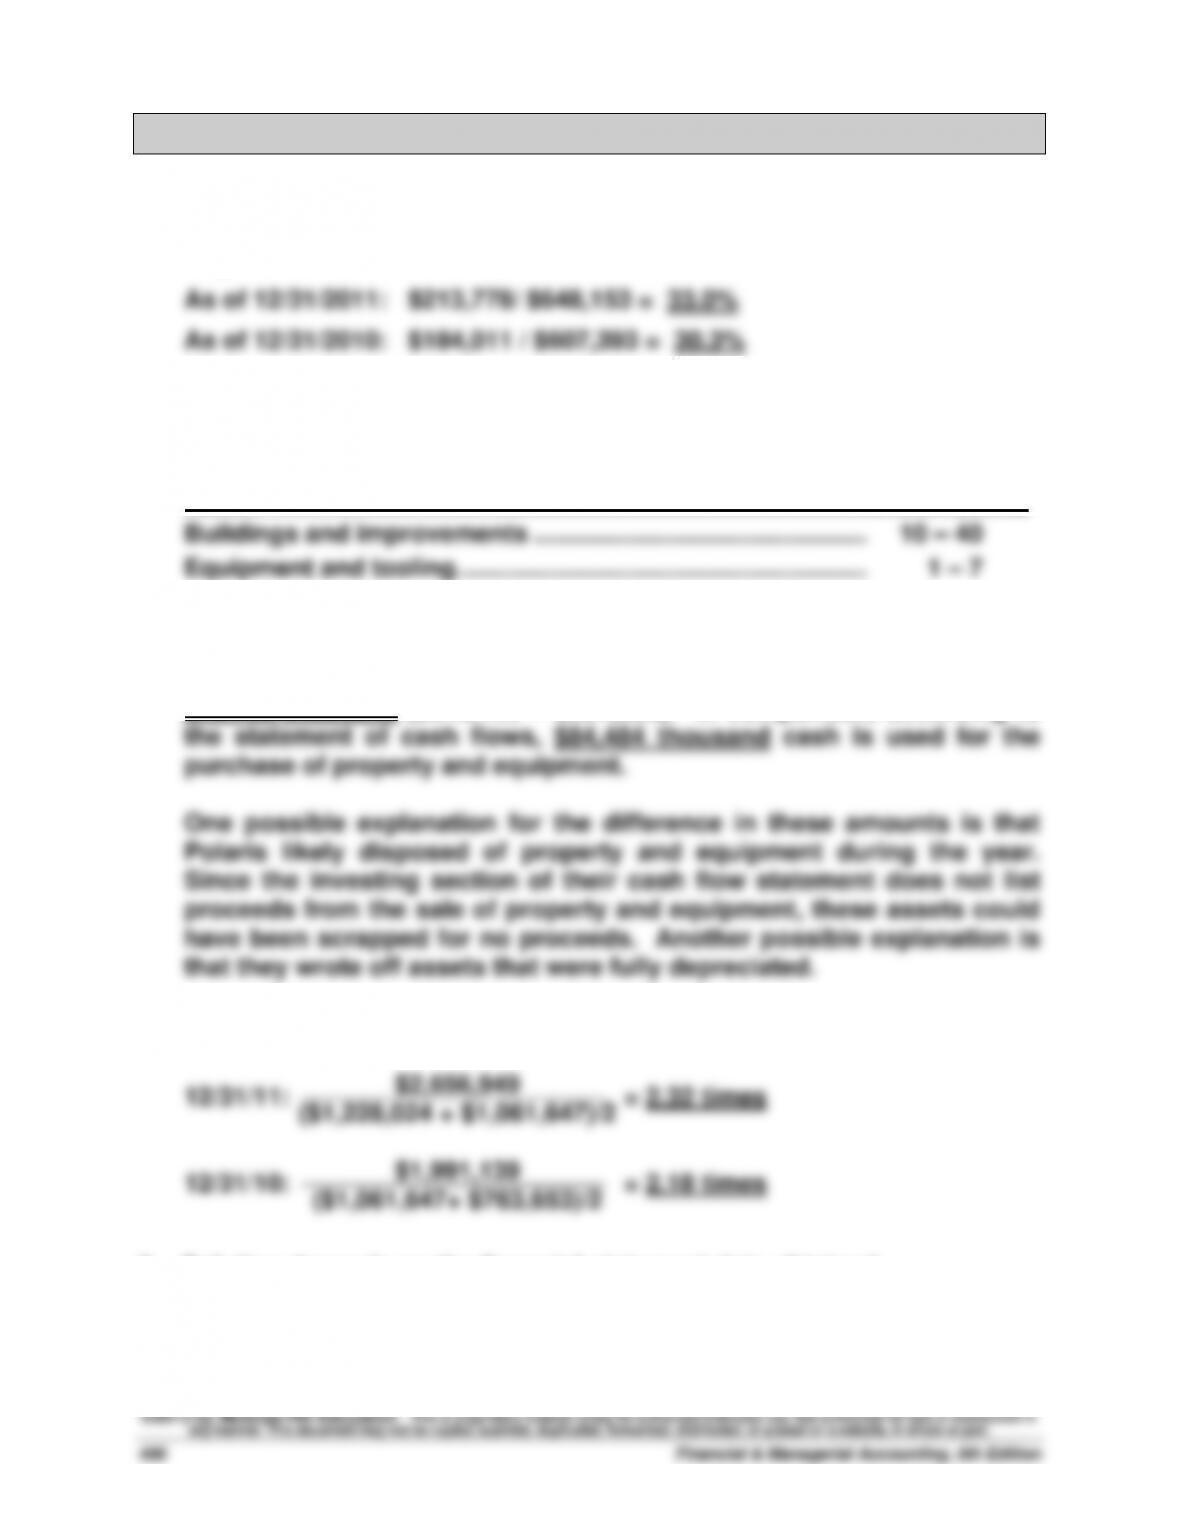
1. The percent of original cost remaining to be depreciated is computed
by taking the ratio of the book value of property and equipment to their
original cost ($ thousands):
2. In Polaris’s “Organization and Significant Accounting Policies” (Note 1:
Property and equipment) it discloses estimated useful lives by major
asset category as follows:
Asset Life (in years)
3. The change in total property and equipment before accumulated
depreciation for the year ended December 31, 2011, is an increase of
$40,760 thousand ($648,153 – $607,393). In comparison, according to
4. Total asset turnover for year ended ($ millions):
5. Solution depends on the financial statement data obtained.
Comparative Analysis — BTN 8-2
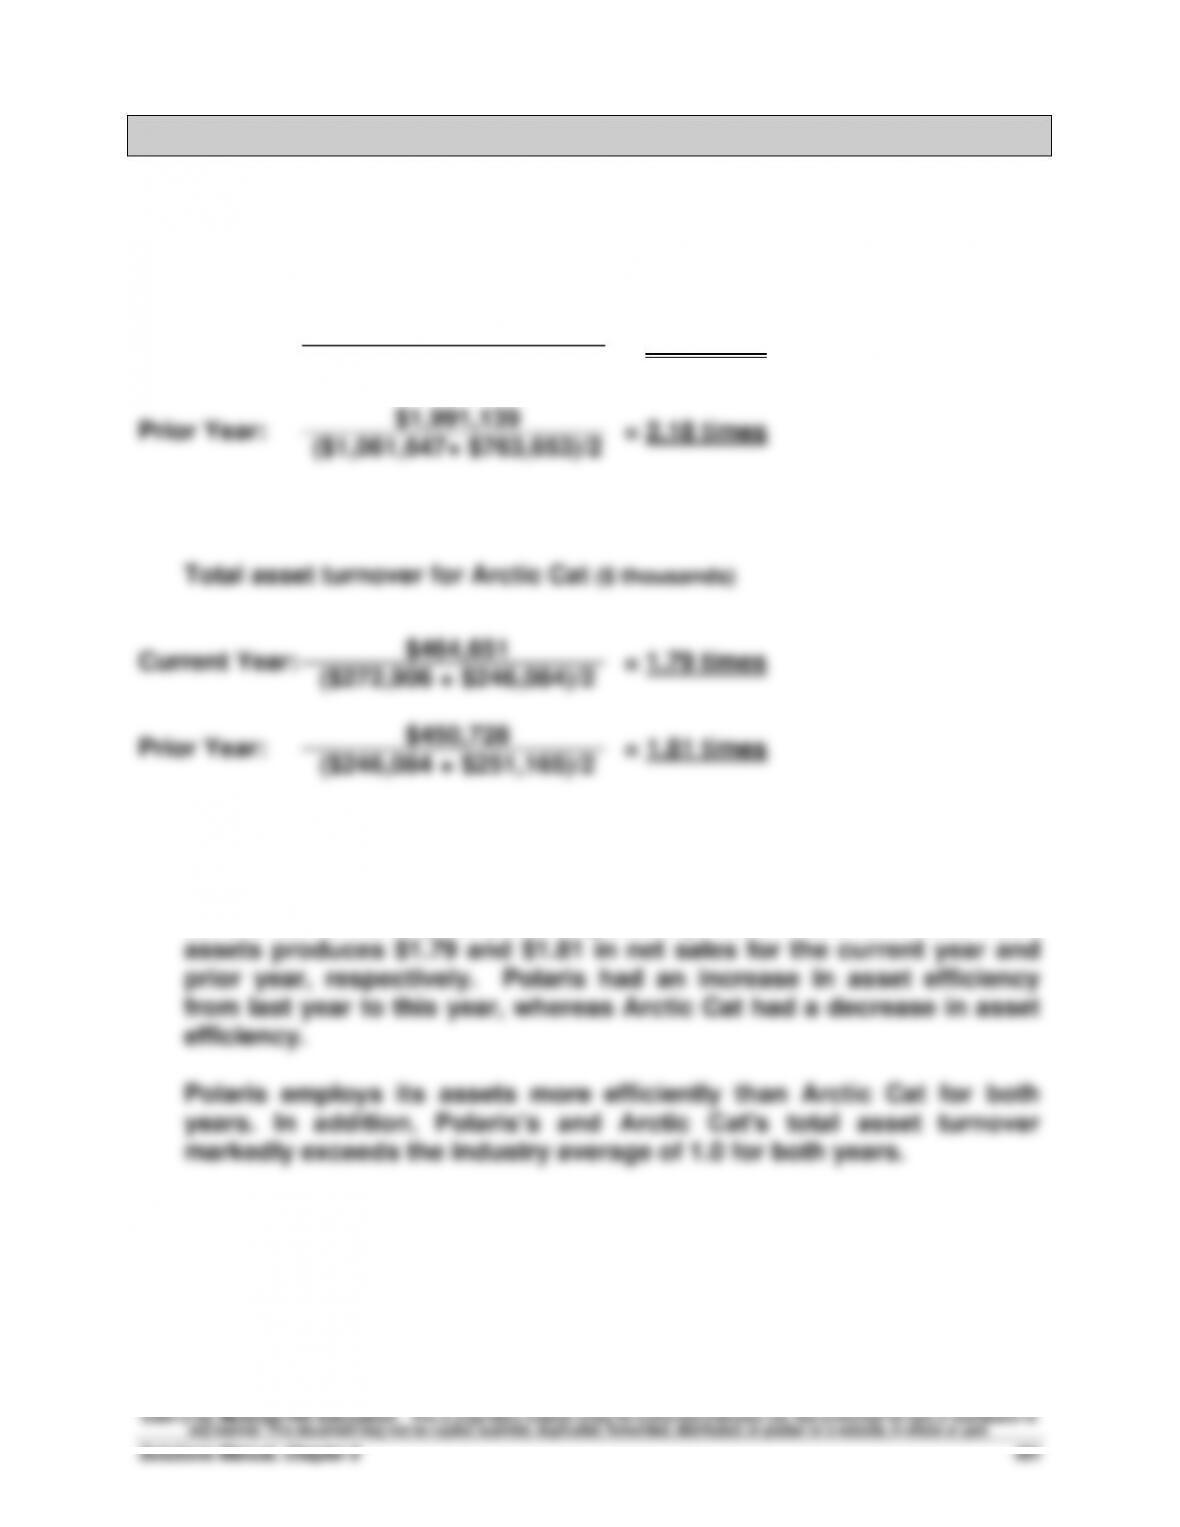
Note: Total asset turnover = Net sales / Average total assets
1. Total asset turnover for Polaris ($ thousands)
Current Year: = 2.32 times
$1,991,139
2. Each dollar of Polaris’s assets produces $2.32 and $2.18 in net sales
for the current and prior year, respectively. Each dollar of Arctic Cat’s
$2,656,949
($1,228,024 + $1,061,647)/2
Ethics Challenge — BTN 8-3
1. When managers acquire new assets a number of decisions relative to
2. When assets are placed in use on a day other than the first day of the
month an assumption is often made that the assets are placed in use on
the first day of the month nearest to the date of the purchase. For
example, for assets purchased on the 1st through 15th days of the month,
3. By always assuming the first day of the following month as the date of
purchase, less depreciation is (initially) accrued for the assets
employed. This means depreciation expense will be less than if assets
were considered employed on the first of the month closest to the date
Taking It to the Net — BTN 8-5
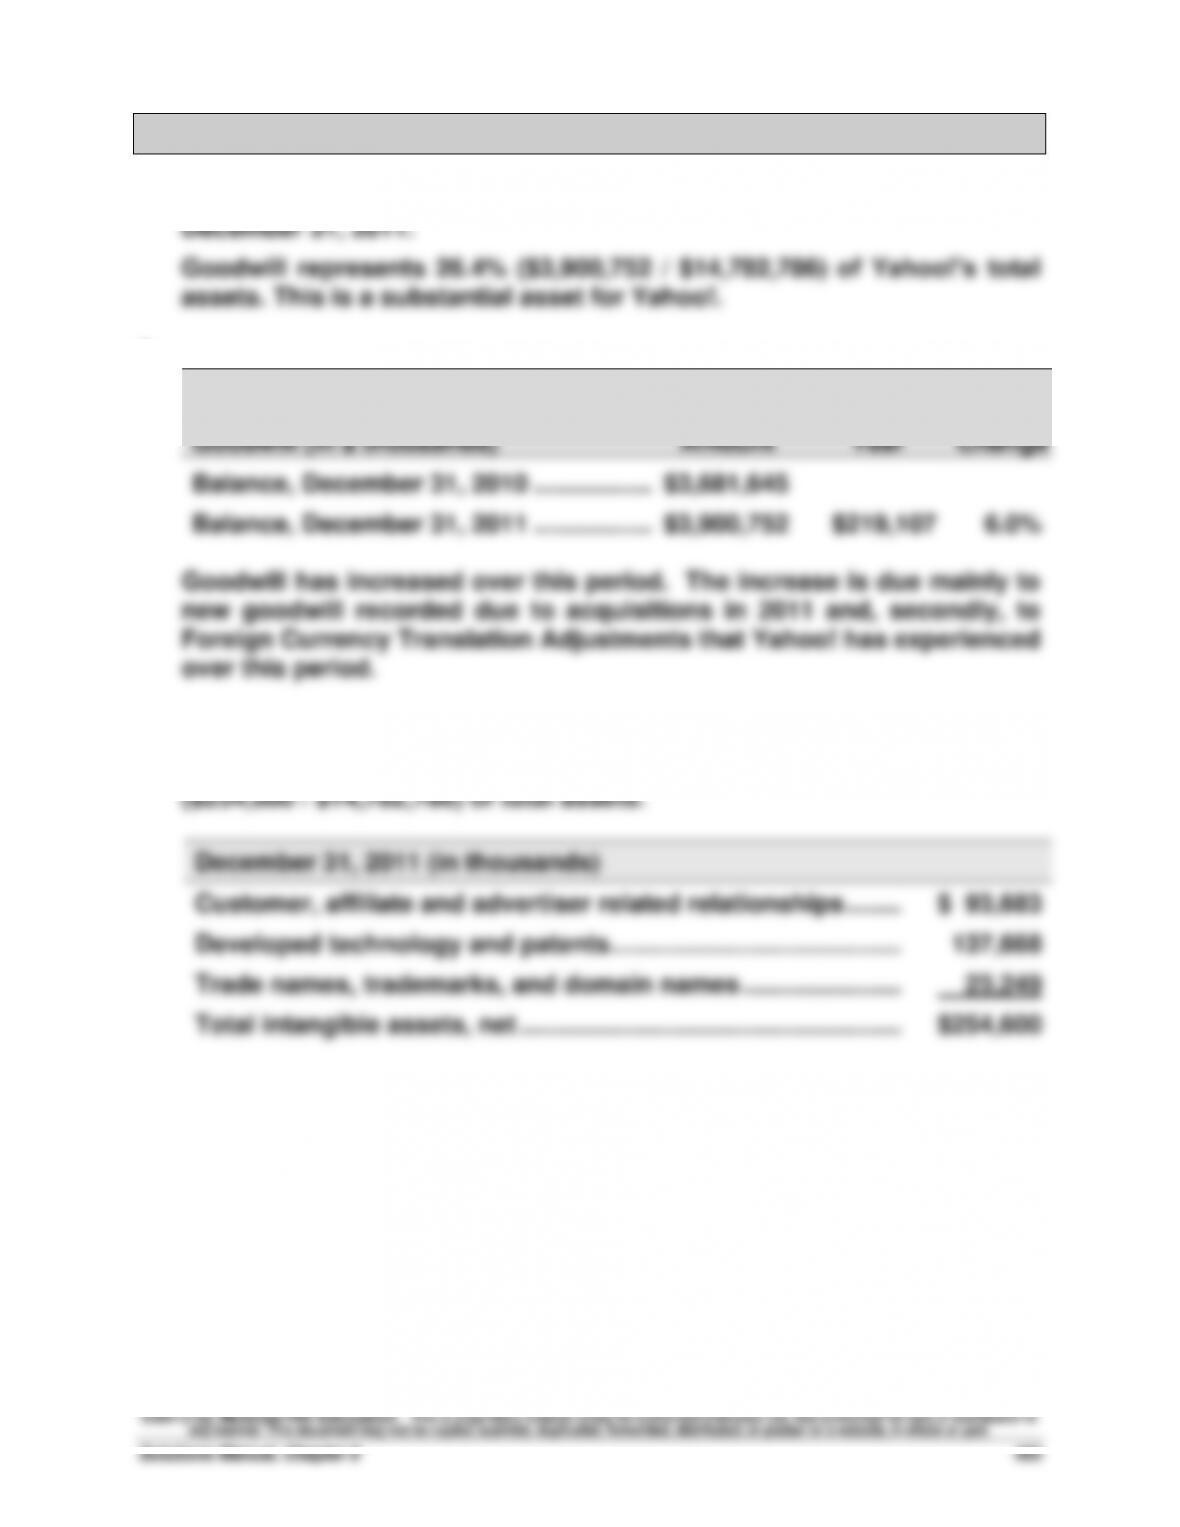
1. Yahoo! has Goodwill in the amount of ($ thousands) $3,900,752 at
2.
Goodwill (in $ thousands)
Total
Amount
$ Change
from Prior
Year
%
Change
Balance, December 31, 2010 ……………..…
$3,681,645
Balance, December 31, 2011 ……………..…
$3,900,752
$219,107
6.0%
Goodwill has increased over this period. The increase is due mainly to
new goodwill recorded due to acquisitions in 2011 and, secondly, to
Foreign Currency Translation Adjustments that Yahoo! has experienced
over this period.
3. Yahoo!’s intangible assets are categorized into the three categories
below at December 31, 2011. These intangibles represent 1.7%
4. Note 6 indicates that Trade names, trademarks, and domain names
have original estimated useful lives of “one year to indefinite lived.” If
the trademarks and trade names have been registered with the
government’s Patent Office, their legal life is probably much closer to
the indefinite life estimate. Since the economic life of these intangibles
is difficult to determine, Yahoo! must choose an economic life it feels is
reasonable.
Teamwork in Action — BTN 8-6
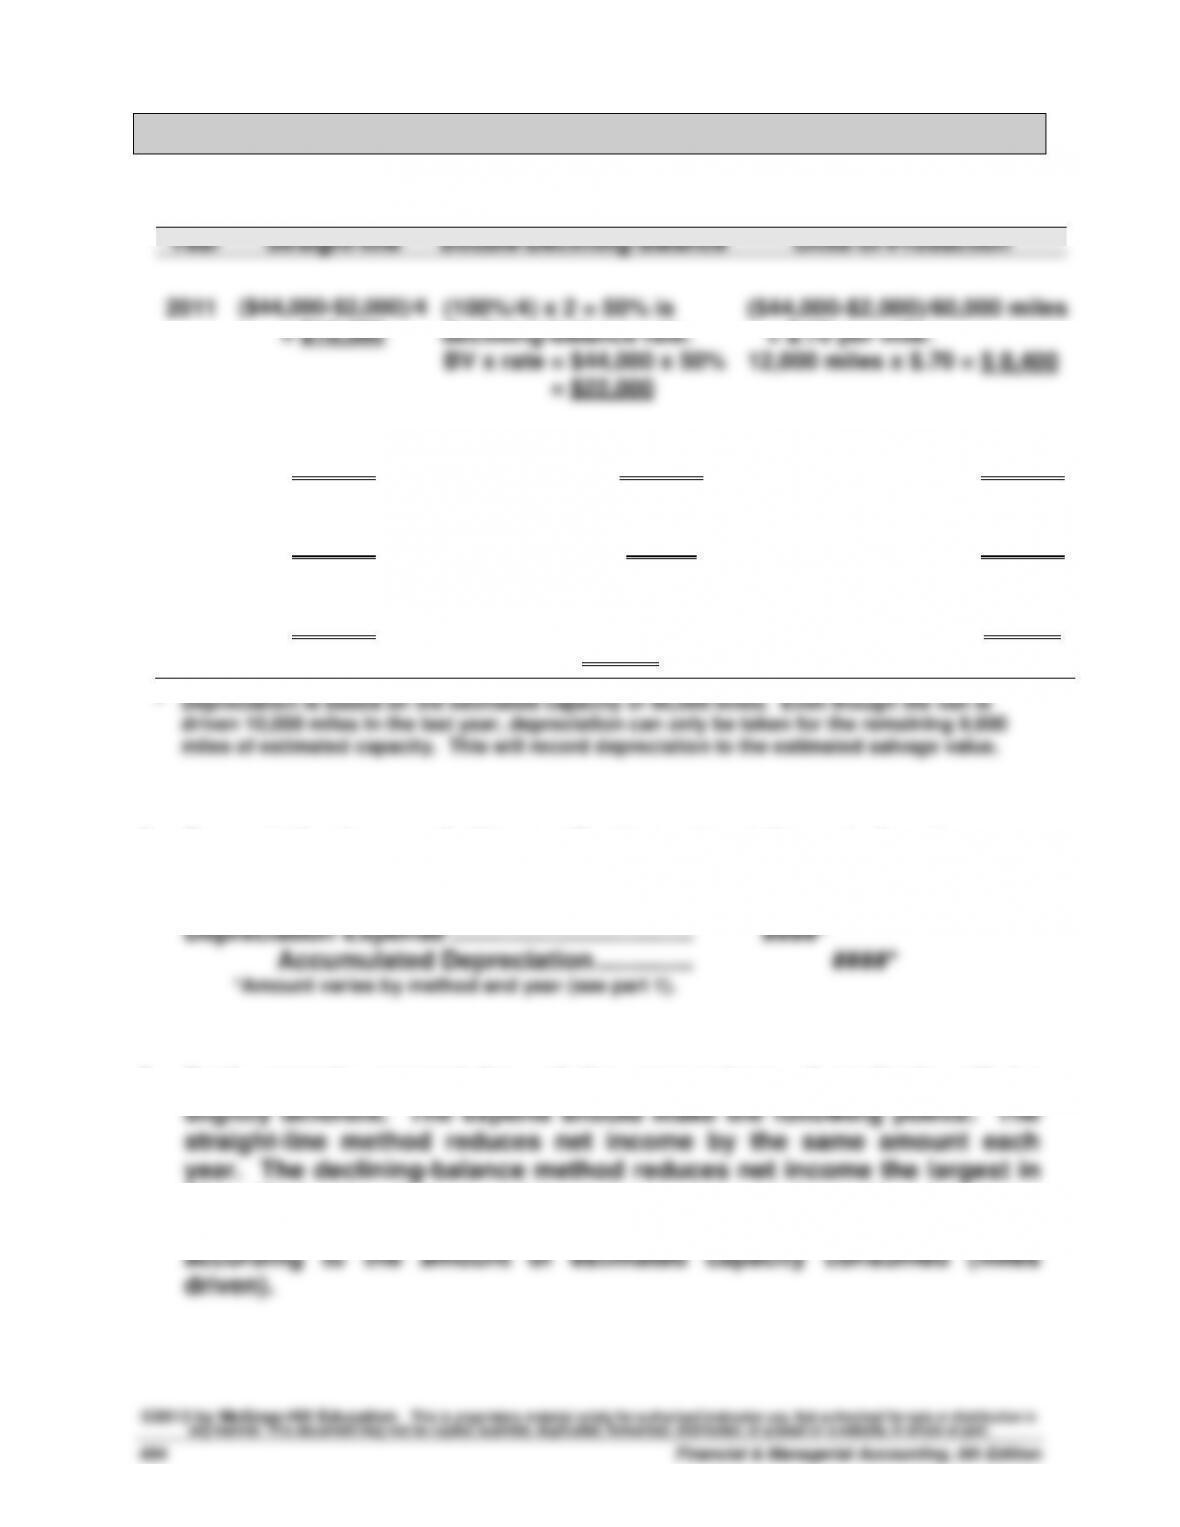
1. Annual depreciation for each year of the asset’s useful life:
Year
Straight-line
Double-Declining-Balance
Units-of-Production
2011
($44,000-$2,000)/4
= $10,500
(100%/4) x 2 = 50% is
declining-balance rate.
BV x rate = $44,000 x 50%
= $22,000
($44,000-$2,000)/60,000 miles
= $.70 per mile.
12,000 miles x $.70 = $ 8,400
2012
$10,500
$22,000 x 50%= $11,000
18,000 miles x $.70 = $12,600
2013
$10,500
$11,000 x 50% = $5,500
21,000 miles x $.70 = $14,700
2014
$10,500
$5,500 (depreciate to
salvage) = $3,500
9,000* miles x $.70 = $ 6,300
2. Depreciation is recorded in an adjusting entry at the end of each
period. The entry is:
3. Each expert’s presentation of the comparison of methods will be
2011 (first year of use) and by a lesser amount in each subsequent
year. The impact of the units-of–production method varies year to year
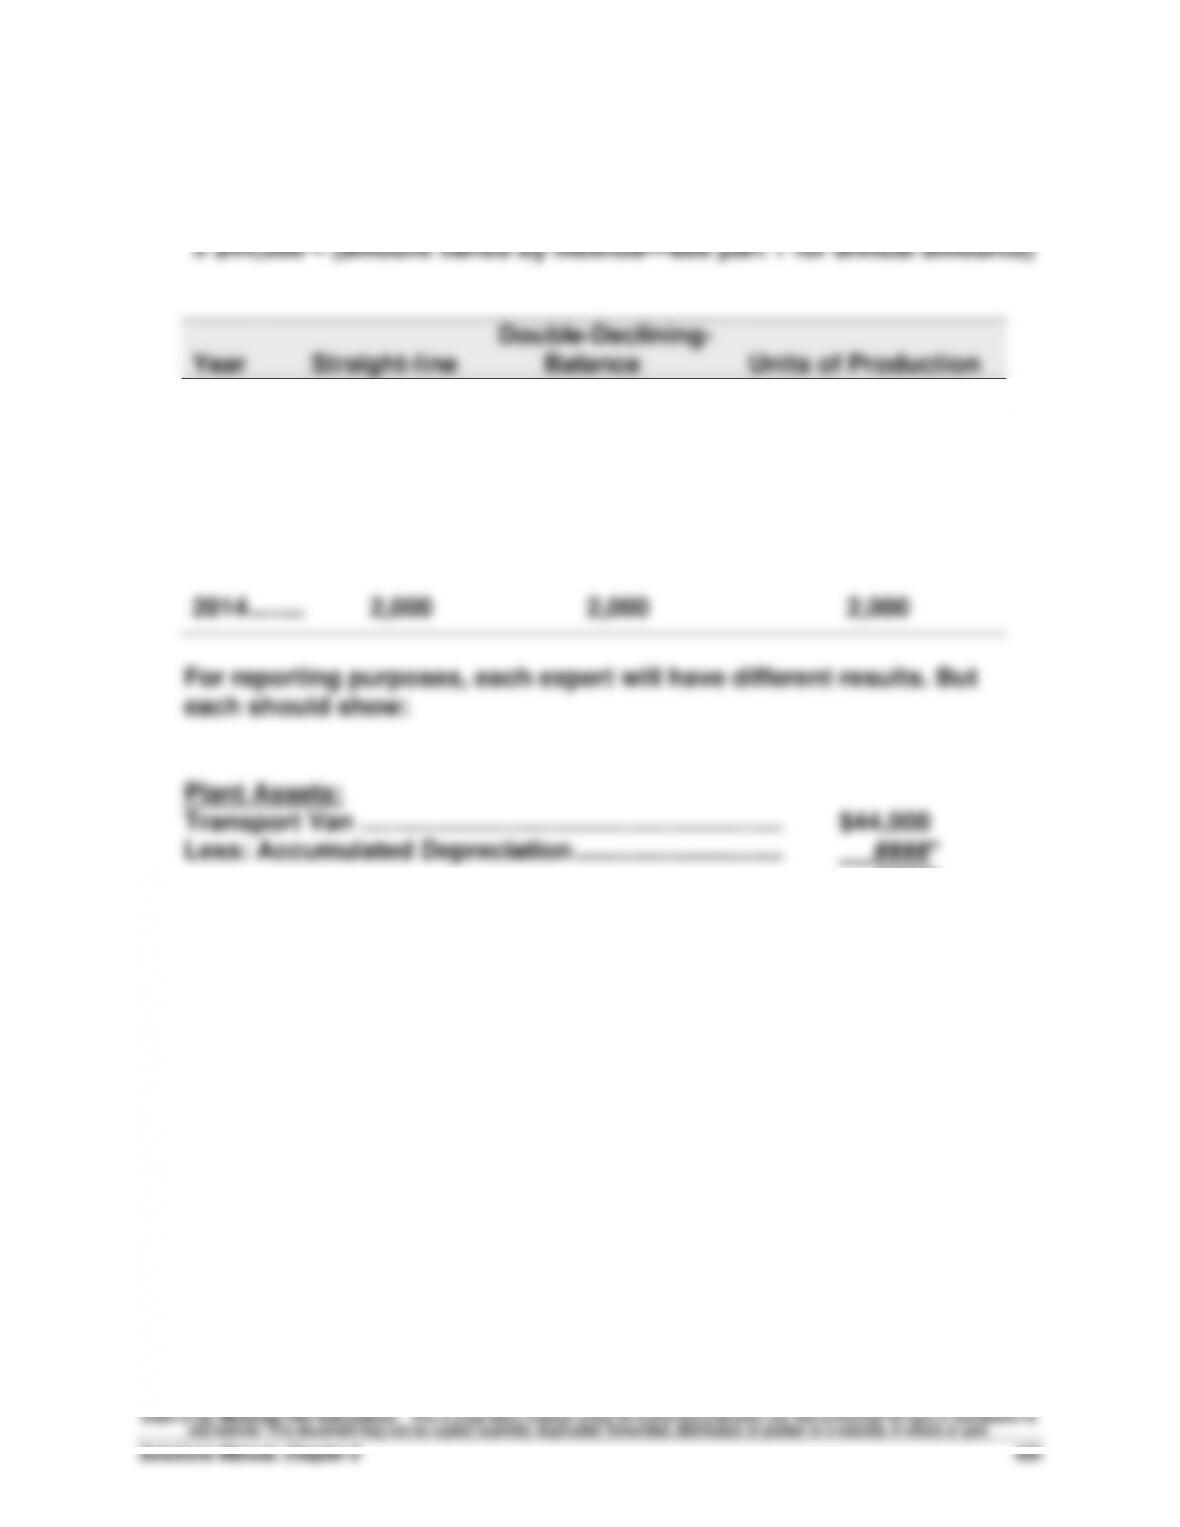
Teamwork in Action — BTN 8-6 – continued
4. Book value at the end of each year
= Cost – Accumulated depreciation
= $44,000 – (amount varies by method—see part 1 for annual amounts)
Year
Straight–line
Double-Declining-
Balance
Units of Production
2011 ……..
$33,500
$22,000
$35,600
2012 ……..
23,000
11,000
23,000
2013 ……..
12,500
5,500
8,300
2014 ……..
2,000
2,000
2,000
####*
* Amounts vary by the method and the year selected for illustration. Experts should explain
the amounts shown.
Financial & Managerial Accounting, 5th Edition
496
Entrepreneurial Decision — BTN 8-7
Part 1
(a) Under current conditions, the total asset turnover is 3.2. This is
computed as net sales of $8,000,000 divided by its average total assets
(b) Under this proposal, its asset turnover would increase to 4. This is
computed by taking its net sales of $12,000,000 ($8,000,000 +
$4,000,000) and dividing by its average total assets of $3,000,000. This
means the company would now turn its assets over 4 times per year or,
stated differently, each $1 of assets would now produce $4.00 of net
sales per year.
Part 2
The proposal would yield an improved total asset turnover of 4 vis-à-vis the
current total asset turnover of 3.2. However, we need to recognize that this
proposal depends on our confidence in both maintaining current sales,
meeting future sales expectations, and not losing or alienating current
Hitting the Road — BTN 8-8
No formal solution exists for this activity. It is usually interesting for the
1. Total asset turnover for Piaggio (Euro in thousands):
2. Piaggio was less efficient in using its assets to generate net sales than
both Polaris and Arctic Cat. Specifically, in the current year each EUR
worth of assets generated 0.99 times that in net sales, compared to 2.32
times each dollar in net assets for Polaris, and 1.79 times each dollar in
net assets for Arctic Cat. Consequently, Polaris was most efficient in
generating net sales from its assets relative to both Piaggio and Arctic
Cat.
Similarly, in the prior year, each EUR’s worth of Piaggio’s assets
generated 0.96 times that in net sales, compared to Polaris’s 2.18
turnover, and Arctic Cat’s 1.81 turnover. Again, Polairs performed the
best on this dimension.
€1,516,463