Financial & Managerial Accounting, 5th Edition
290
Serial Problem — SP 4 (Continued)
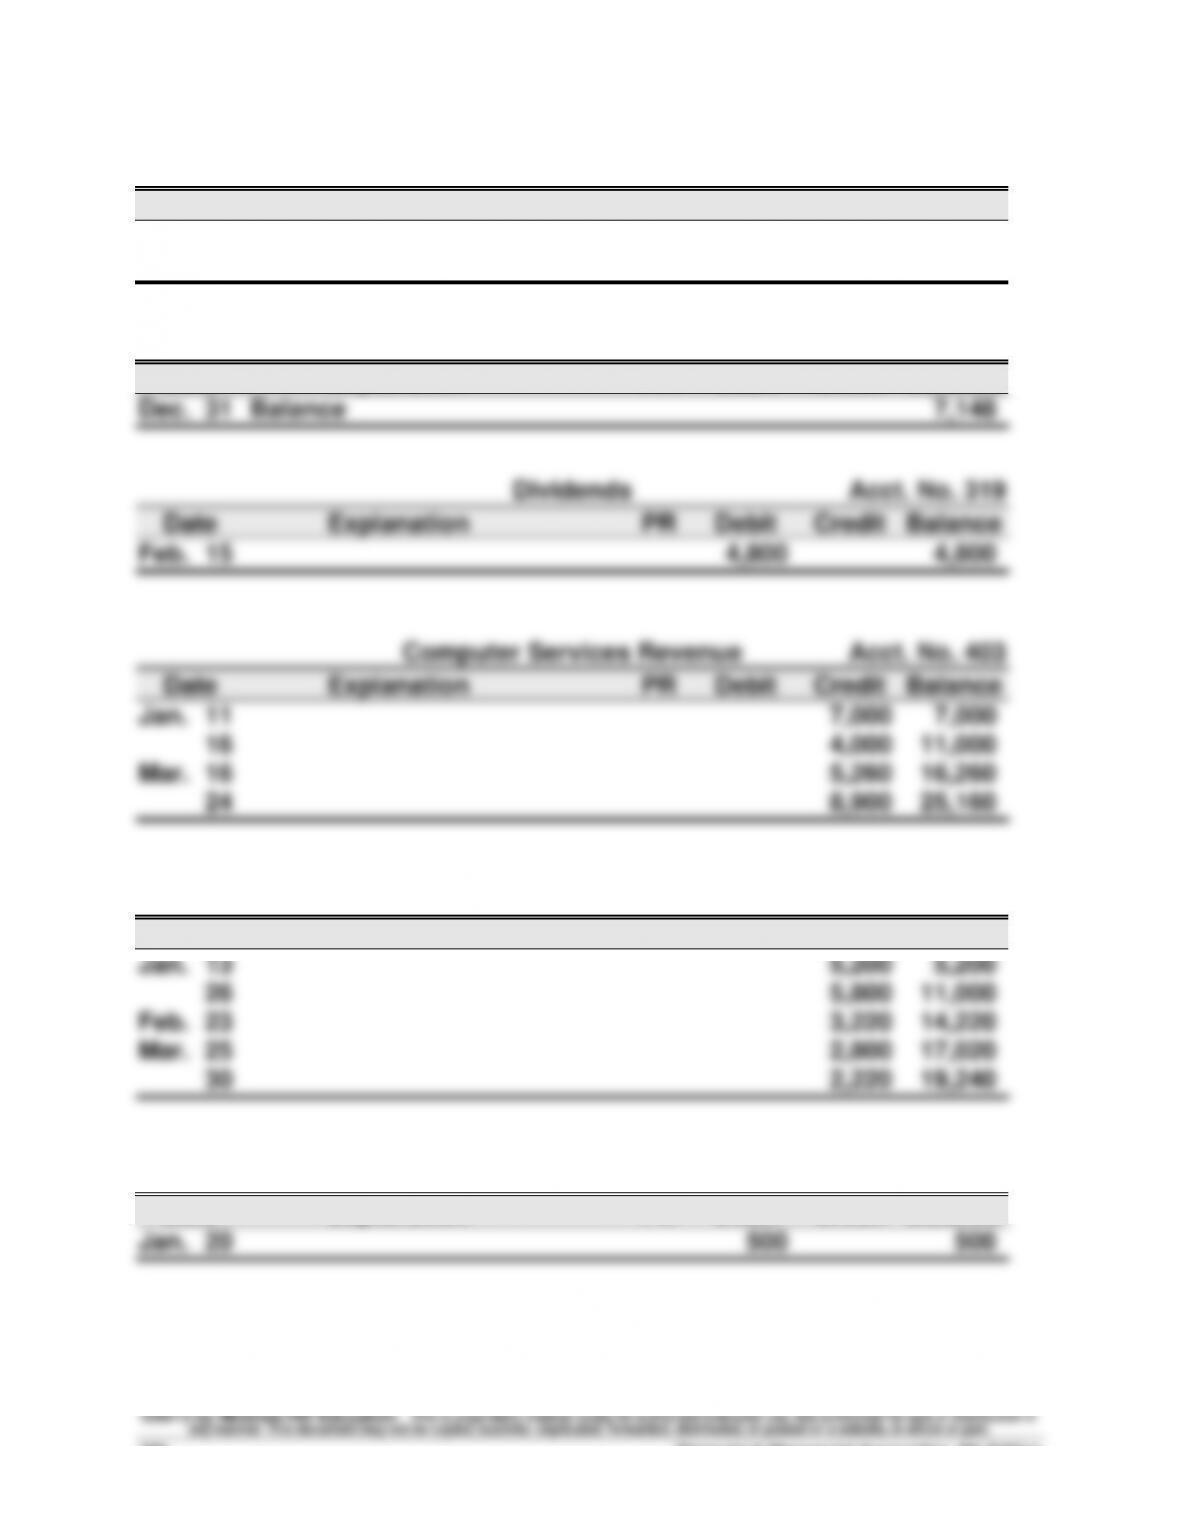
Common Stock Acct. No. 307
Date Explanation PR Debit Credit Balance
Dec. 31 Balance 83,000
Jan. 5 25,000 108,000
Retained Earnings Acct. No. 318
Date Explanation PR Debit Credit Balance
Sales Acct. No. 413
Date Explanation PR Debit Credit Balance
Sales Returns and Allowances Acct. No. 414
Date Explanation PR Debit Credit Balance
Serial Problem — SP 4 (Continued)
Sales Discounts Acct. No. 415
Date Explanation PR Debit Credit Balance
Jan. 22 47 47
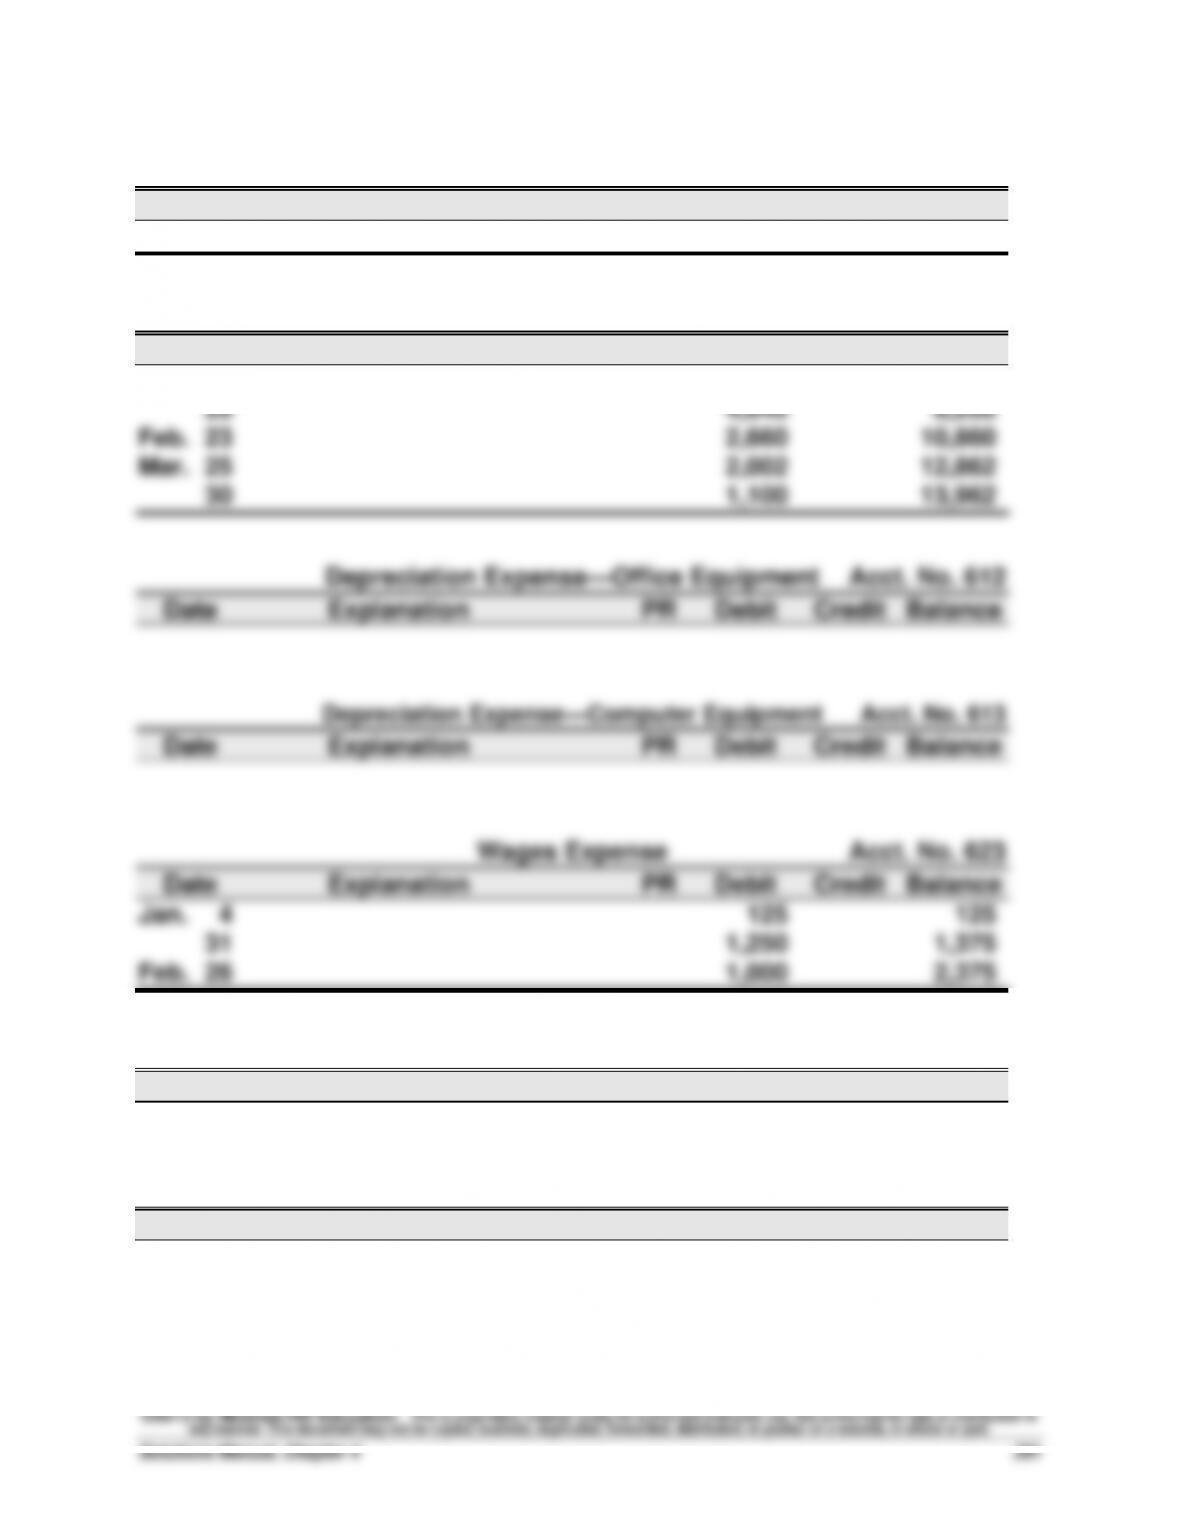
Cost of Goods Sold Acct. No. 502
Date Explanation PR Debit Credit Balance
Jan. 13 3,560 3,560
Insurance Expense Acct. No. 637
Date Explanation PR Debit Credit Balance
Rent Expense Acct. No. 640
Date Explanation PR Debit Credit Balance

Financial & Managerial Accounting, 5th Edition
292
Serial Problem — SP 4 (Continued)
Computer Supplies Expense Acct. No. 652
Date Explanation PR Debit Credit Balance
Advertising Expense Acct. No. 655
Date Explanation PR Debit Credit Balance
Feb. 5 600 600
Mileage Expense Acct. No. 676
Date Explanation PR Debit Credit Balance
Feb. 27 192 192
Mar. 31 128 320
Miscellaneous Expenses Acct. No. 677
Date Explanation PR Debit Credit Balance
Repairs Expense—Computer Acct. No. 684
Date Explanation PR Debit Credit Balance
Mar. 11 960 960
Serial Problem — SP 4 (Continued) Part 3
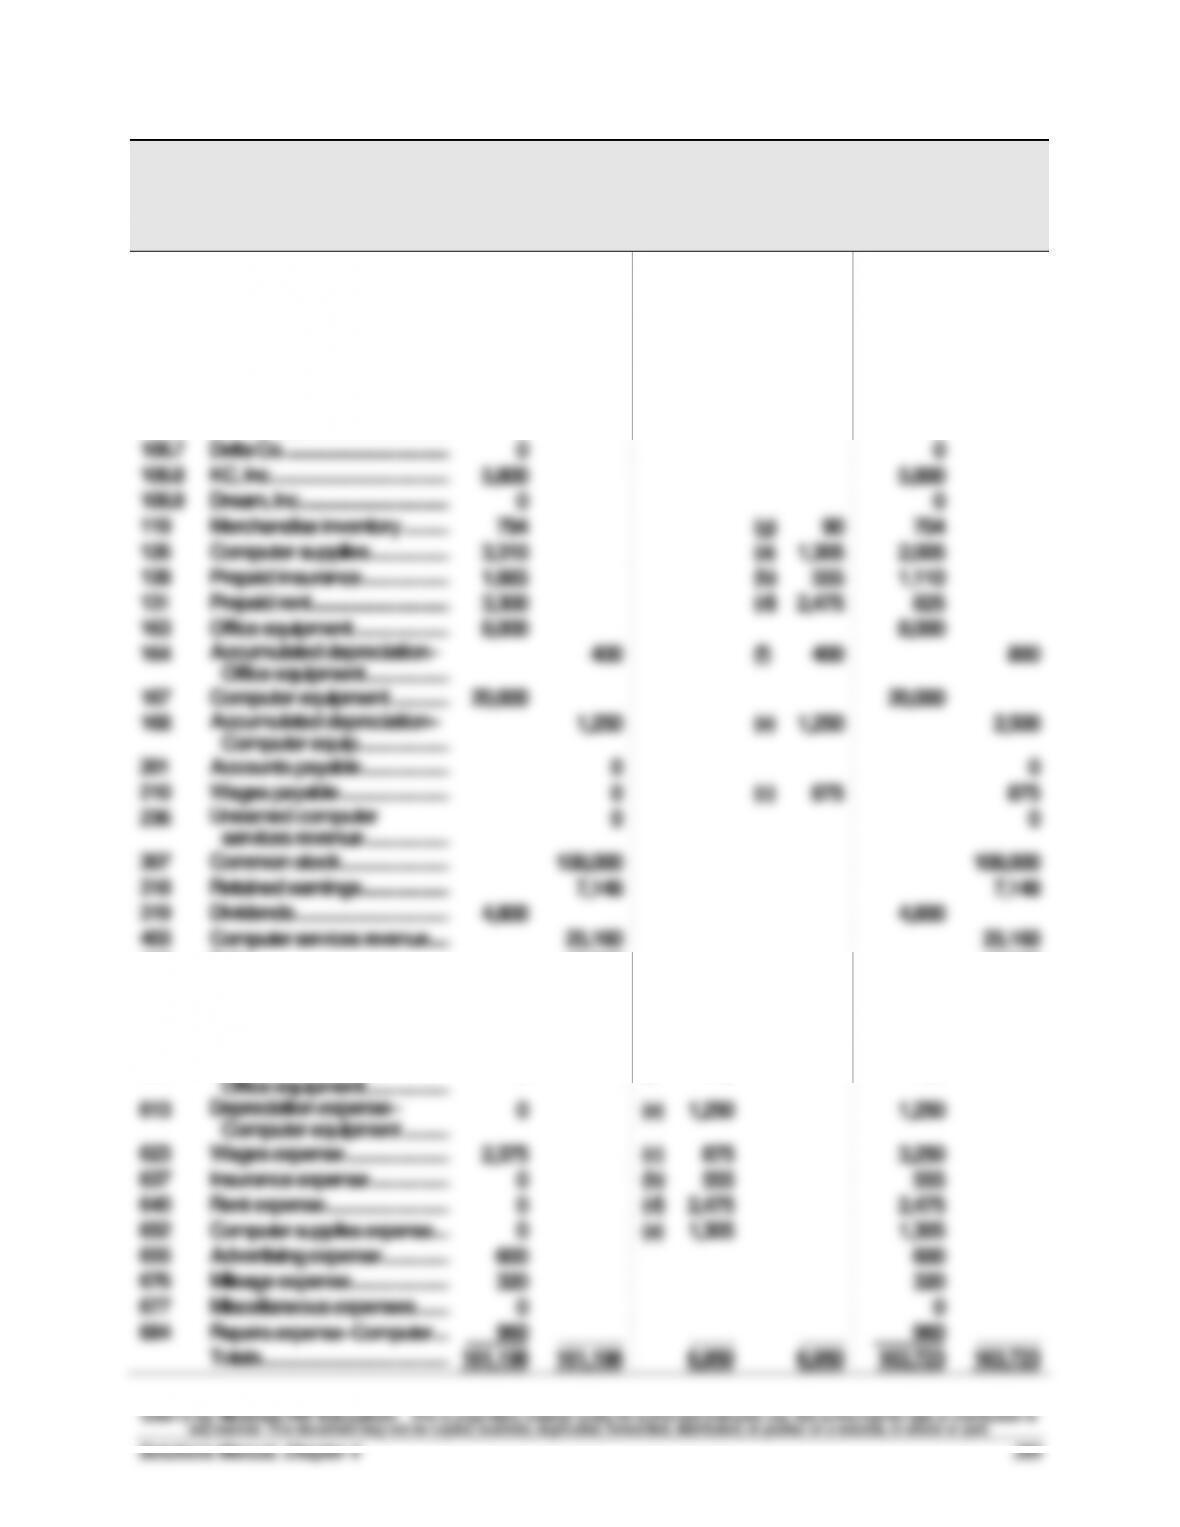
SUCCESS SYSTEMS
Partial Work Sheet
March 31, 2014
Acct.
No.
Account Title
Unadjusted
Trial Balance
Adjustments
Adjusted
Trial Balance
101
Cash………………………………………..…………
77,845
77,845
106.1
Alex’s Engineering Co. ……………………
0
0
106.2
Wildcat Services …………………………..
2,800
2,800
106.3
Easy Leasing …………………………..
8,900
8,900
106.4
IMF Co. ………………………………………………
5,220
5,220
106.5
Liu Corporation ……………………..……
0
0
106.6
Gomez Co. ……………………………..…………
0
0
106.7
Delta Co. ……………………………………………
0
0
106.8
KC, Inc. ………………………………………………
5,800
5,800
106.9
Dream, Inc. ……………………………..…………
0
0
119
Merchandise inventory ………..…………
794
(g)
90
704
126
Computer supplies ……………….…………
3,310
(a)
1,305
2,005
128
Prepaid insurance …………………………..
1,665
(b)
555
1,110
131
Prepaid rent ………………………………………
3,300
(d)
2,475
825
163
Office equipment …………………..………
8,000
8,000
164
Accumulated depreciation–
Office equipment ………………..…………
400
(f)
400
800
167
Computer equipment …………..…………
20,000
20,000
168
Accumulated depreciation–
Computer equip. …………………………..
1,250
(e)
1,250
2,500
201
Accounts payable …………………………..
0
0
210
Wages payable ……………………..……
0
(c)
875
875
236
Unearned computer
services revenue ………………..…………
0
0
307
Common stock ……………………..……
108,000
108,000
318
Retained earnings …………………………..
7,148
7,148
319
Dividends …………………………..…..…………
4,800
4,800
403
Computer services revenue …..…………
25,160
25,160
413
Sales ……………………………………….…………
19,240
19,240
414
Sales returns and allow. ……….…………
500
500
415
Sales discounts …………………….…….
47
47
502
Cost of goods sold ……………….…………
13,962
(g)
90
14,052
612
Depreciation expense–
Office equipment ………………..…………
0
(f)
400
400
613
Depreciation expense–
Computer equipment ………..…………
0
(e)
1,250
1,250
623
Wages expense …………………….…….
2,375
(c)
875
3,250
637
Insurance expense ……………….…………
0
(b)
555
555
640
Rent expense …………………………..
0
(d)
2,475
2,475
652
Computer supplies expense ….…………
0
(a)
1,305
1,305
655
Advertising expense …………….…………
600
600
676
Mileage expense …………………………..
320
320
677
Miscellaneous expenses ……..…………
0
0
684
Repairs expense–Computer ….…………
960
______
____
____
960
______
Totals …………………………………………………
161,198
161,198
6,950
6,950
163,723
163,723
Financial & Managerial Accounting, 5th Edition
294
Serial Problem — SP 4 (Continued)
Part 4
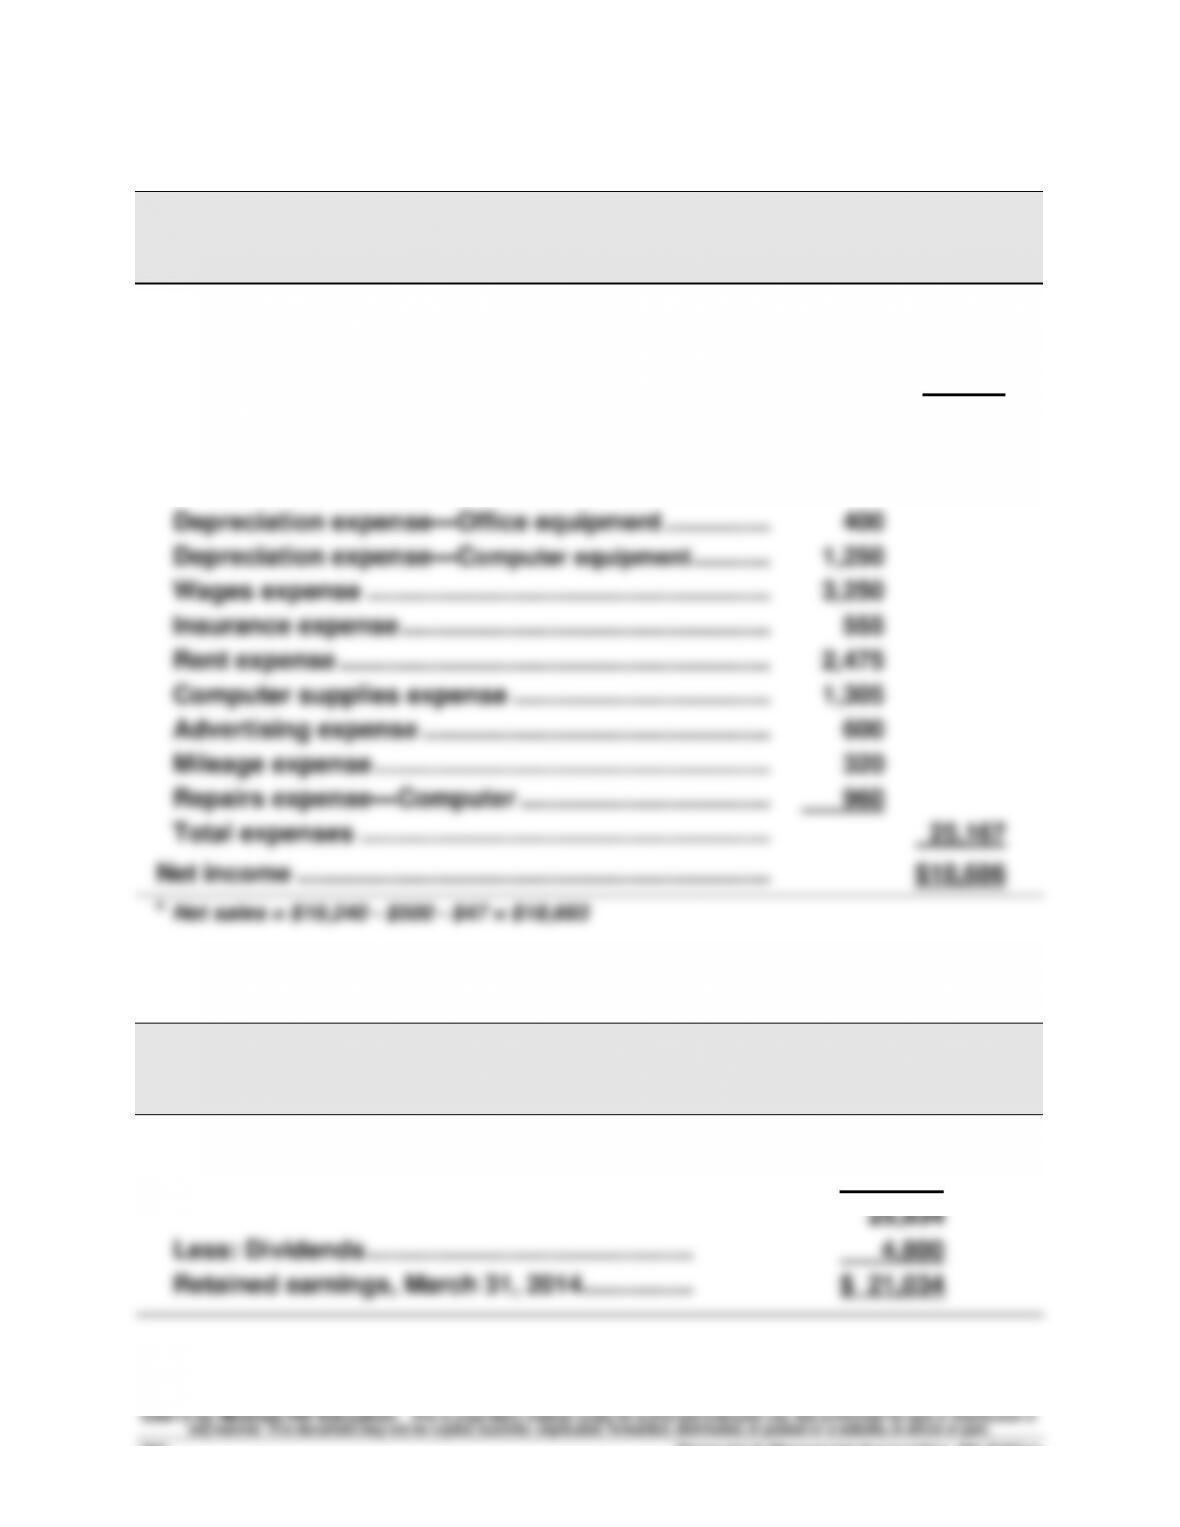
SUCCESS SYSTEMS
Income Statement
For Three Months Ended March 31, 2014
Revenues
Computer services revenue ……………………………….. $25,160
Net sales* ………………………………………………………….. 18,693
Total revenues …………………………………………………… 43,853
Expenses
Cost of goods sold …………………………………………….. $14,052
Part 5
SUCCESS SYSTEMS
Statement of Retained Earnings
For Three Months Ended March 31, 2014
Retained earnings, Dec. 31, 2013………………. $ 7,148
Plus: Net income ……………………………………… 18,686
Serial Problem — SP 4 (Concluded)
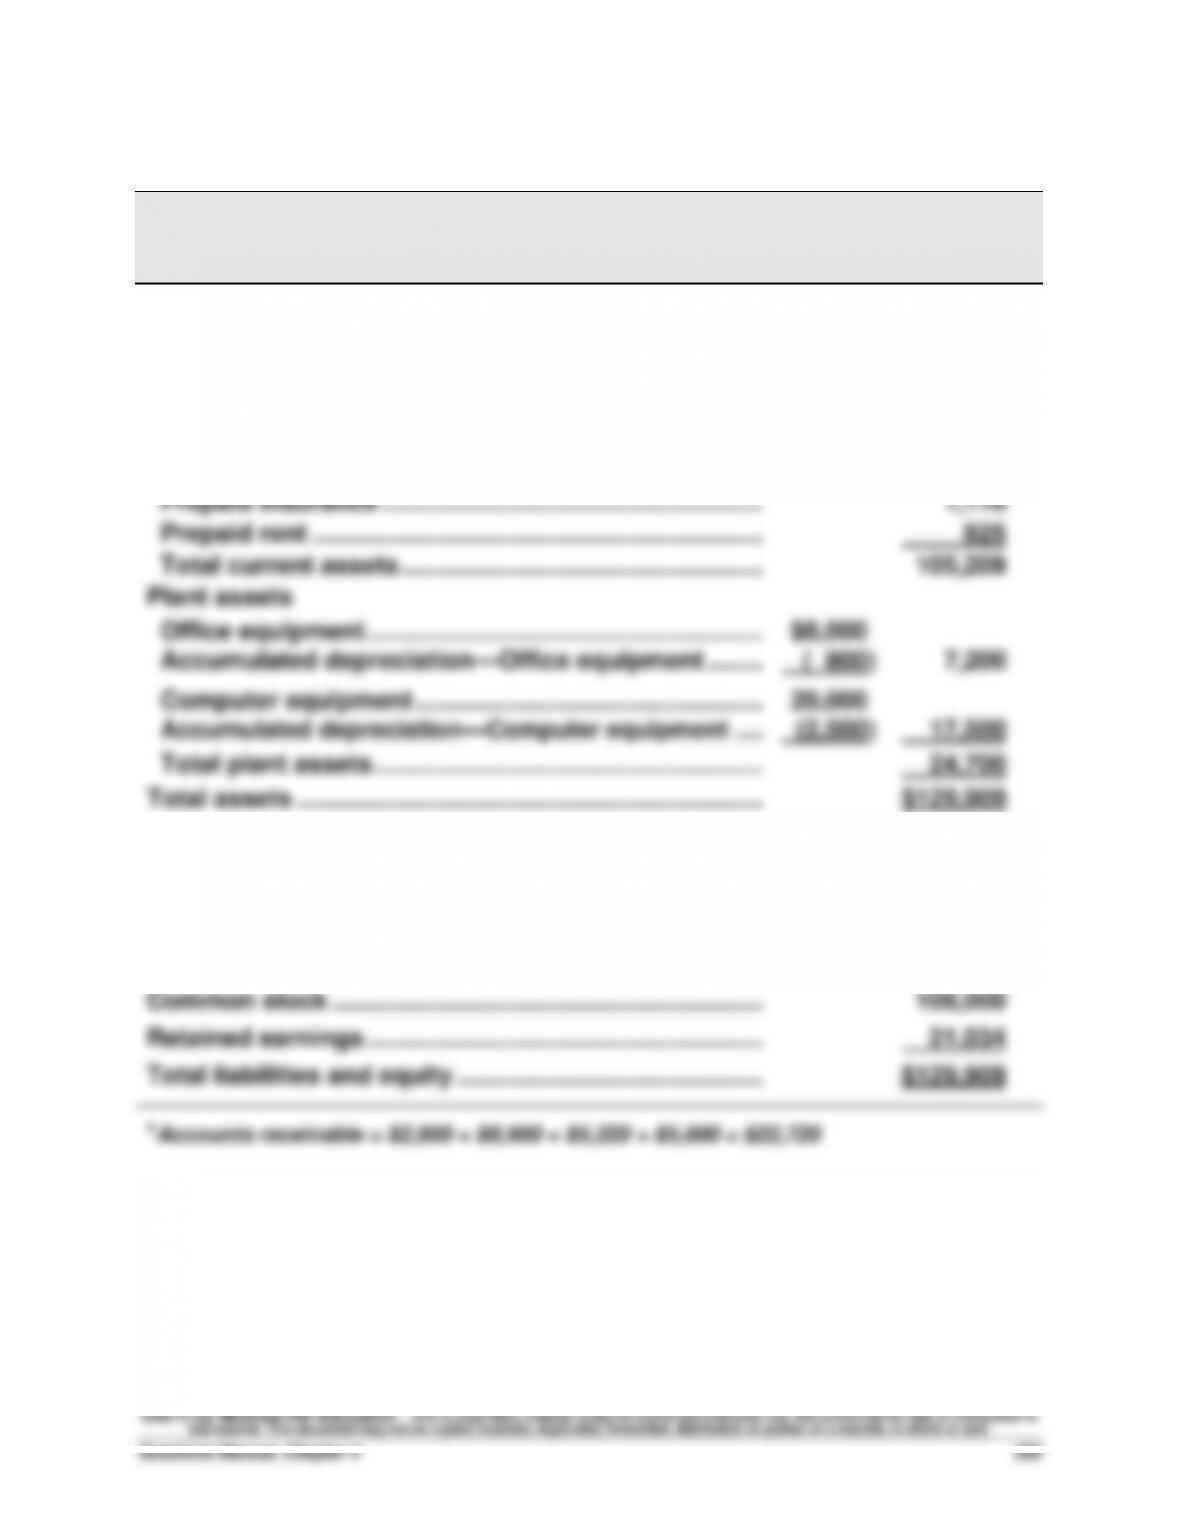
Part 6
SUCCESS SYSTEMS
Balance Sheet
March 31, 2014
Assets
Current assets
Cash ………………………………………………………………….. $ 77,845
Accounts receivable* ………………………………………….. 22,720
Merchandise inventory ……………………………………….. 704
Computer supplies ……………………………………………… 2,005
Liabilities
Current liabilities
Wages payable …………………………………………………….. $ 875
Equity
Reporting in Action — BTN 4-1
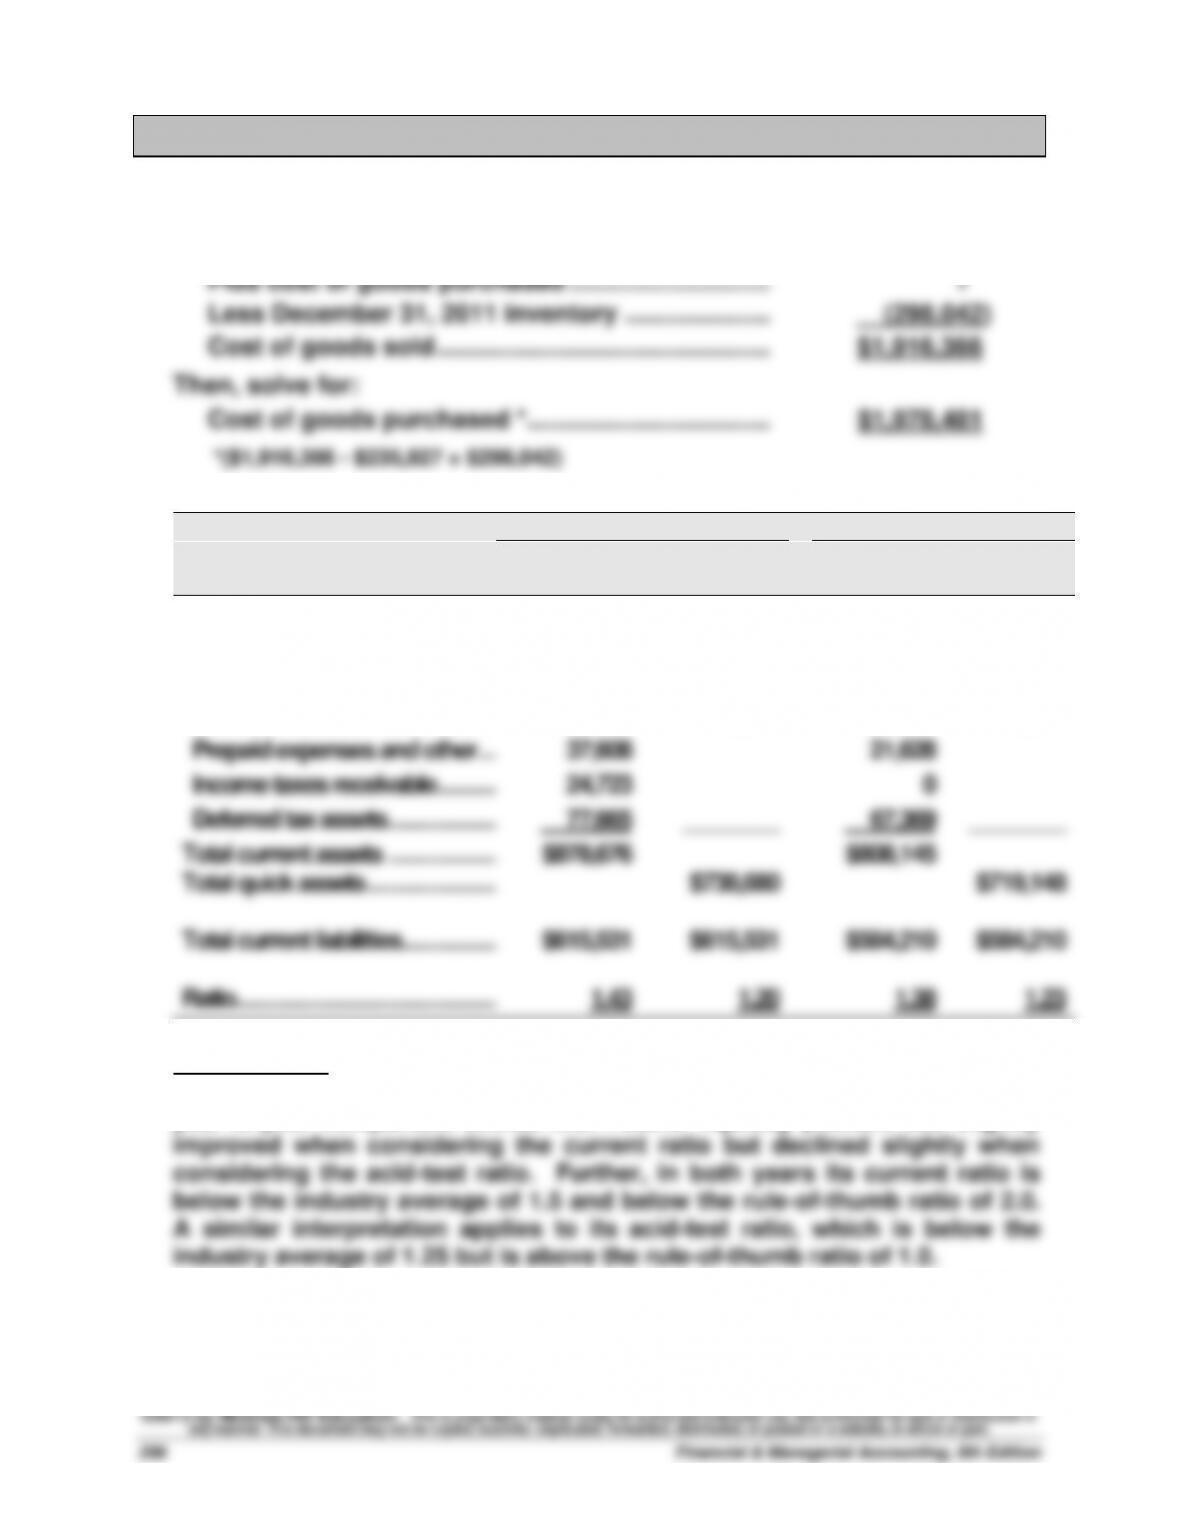
1. Compute cost of sales for 2011 as follows ($ thousands)
December 31, 2010 inventory …………………………. $ 235,927
2.
2011
2010
($ thousands)
Current
Ratio
Acid–Test
Ratio
Current
Ratio
Acid–Test
Ratio
Current assets
Cash and equivalents …………..
$325,336
$325,336
$393,927
$393,927
Trade receivables, net …………..
115,302
115,302
89,294
89,294
Inventories, net …………………...
298,042
298,042
235,927
235,927
Prepaid expenses and other …..
37,608
21,628
Income taxes receivable ………..
24,723
0
Deferred tax assets ……………...
77,665
________
67,369
________
Total current assets ……………...
$878,676
$808,145
Total quick assets ………………...
$738,680
$719,148
Total current liabilities …………....
$615,531
$615,531
$584,210
$584,210
Ratio ………………………………....
1.43
1.20
1.38
1.23
Interpretation: The current ratio increased from 1.38 in 2010 to 1.43 in
2011. The acid-test ratio decreased from 1.23 in 2010 to 1.20 in 2011. The
year–to–year comparison shows that Polaris’ liquidity position has slightly
3. Solution depends on the financial statement data obtained.
Comparative Analysis — BTN 4-2
1.
Polaris
Arctic Cat
($ thousands)
Current
Prior
Current
Prior
Net sales ………………
$2,656,949
$1,991,139
$464,651
$450,728
Cost of sales …………
1,916,366
1,460,926
363,142
367,492
Gross margin ………..
$ 740,583
$ 530,213
$101,509
$ 83,236
Gross margin ratio ….
27.9%
26.6%
21.8%
18.5%
2. In both years, Polaris’ gross margin ratio was higher than that for Arctic
Cat. For both years, Arctic Cat’s gross margin ratio was below the
3. Artic Cat’s gross margin ratio improved from 18.5% to 21.8% and
Ethics Challenge — BTN 4-3
1. A few students sometimes feel that Amy has devised a clever way to
beat the system. She appears to be succeeding in getting something for
free. However, most students fortunately feel that Amy is abusing the
system and that her ethical conduct needs an overhaul. The instructor
may wish to point out that customer abuses such as Amy’s usually
Financial & Managerial Accounting, 5th Edition
298
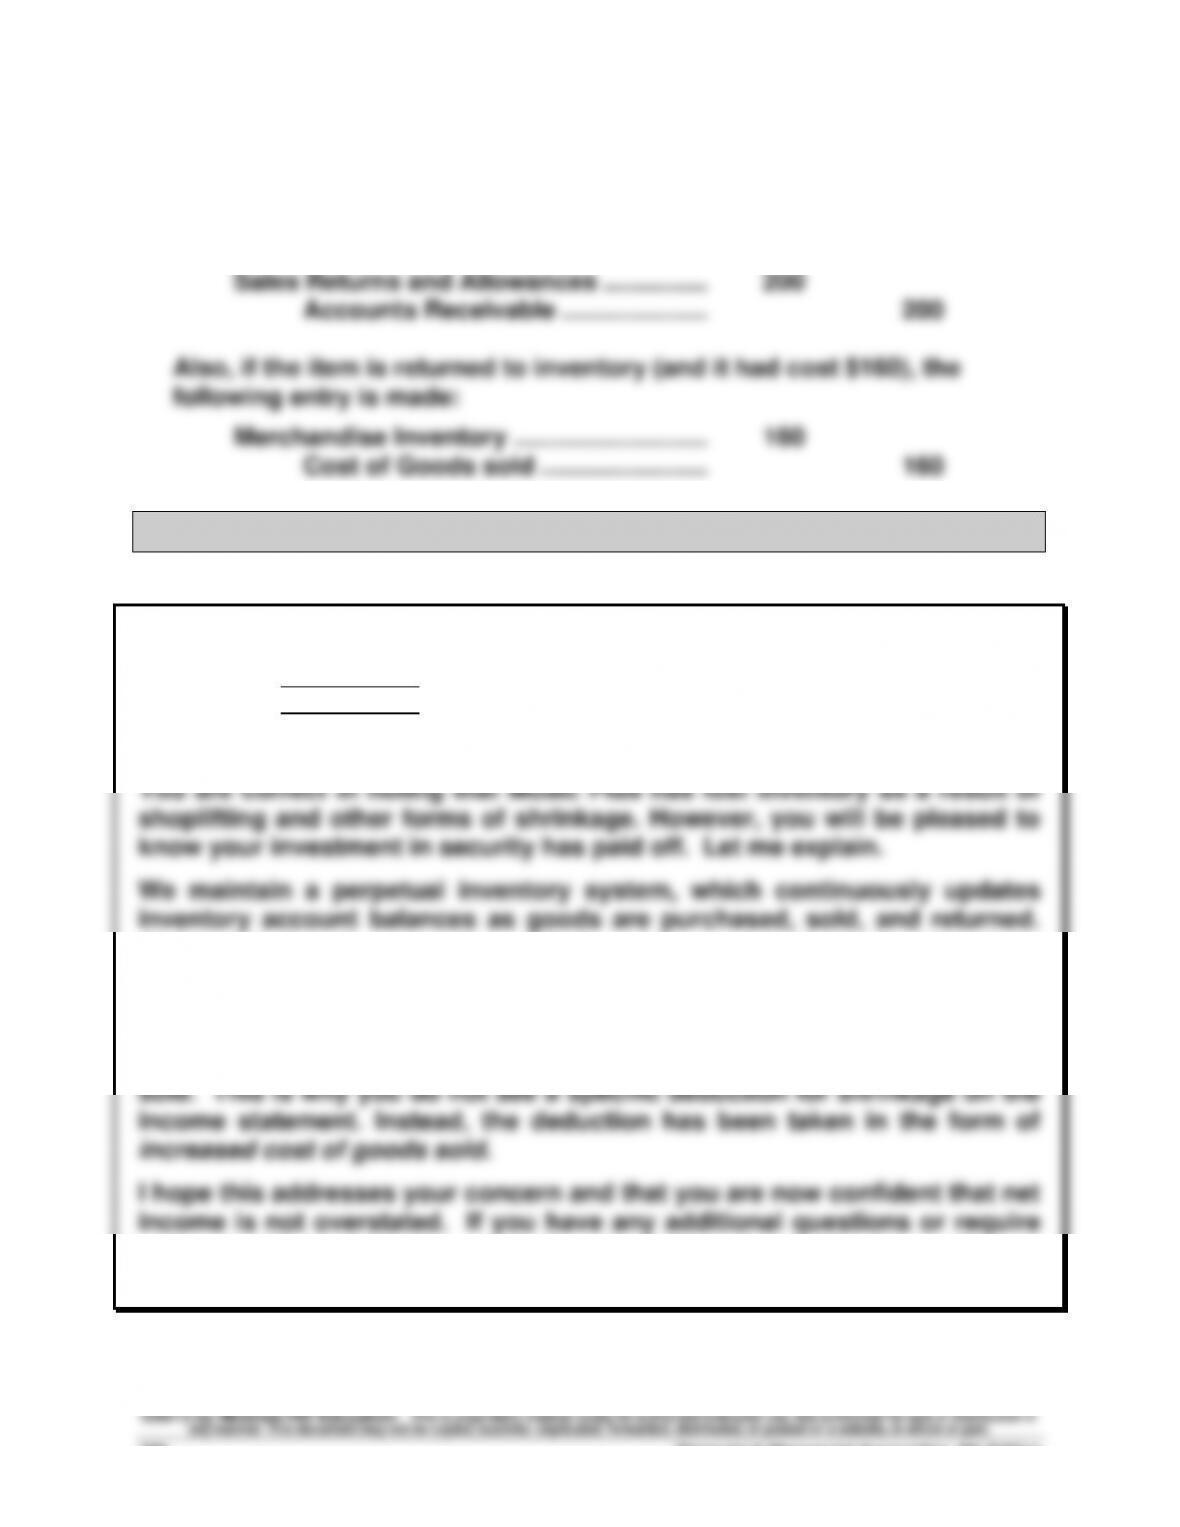
Ethics Challenge, BTN 4-3 — (Concluded)
2. The merchandising company accounts for sales returns using a contra
revenue account called Sales Returns and Allowances. A dress
returned with a sales bill of $200 would be accounted for as follows:
Communicating in Practice — BTN 4-4
Note: While responses will vary, the essence of its content follows:
TO: Mr. V. Velakturi
FROM:
DATE:
SUBJECT: Reply to inventory shrinkage question
At the end of each accounting period, we take an actual physical inventory
and compare this amount to our inventory records. These accounting
procedures for verifying inventory available have disclosed that the
amount of inventory loss is not abnormally large. Accounting procedures
allow this immaterial shrinkage to be directly charged to cost of goods
more specific information regarding inventory shrinkage, please let me
know. The supporting information is available in the accounting records.
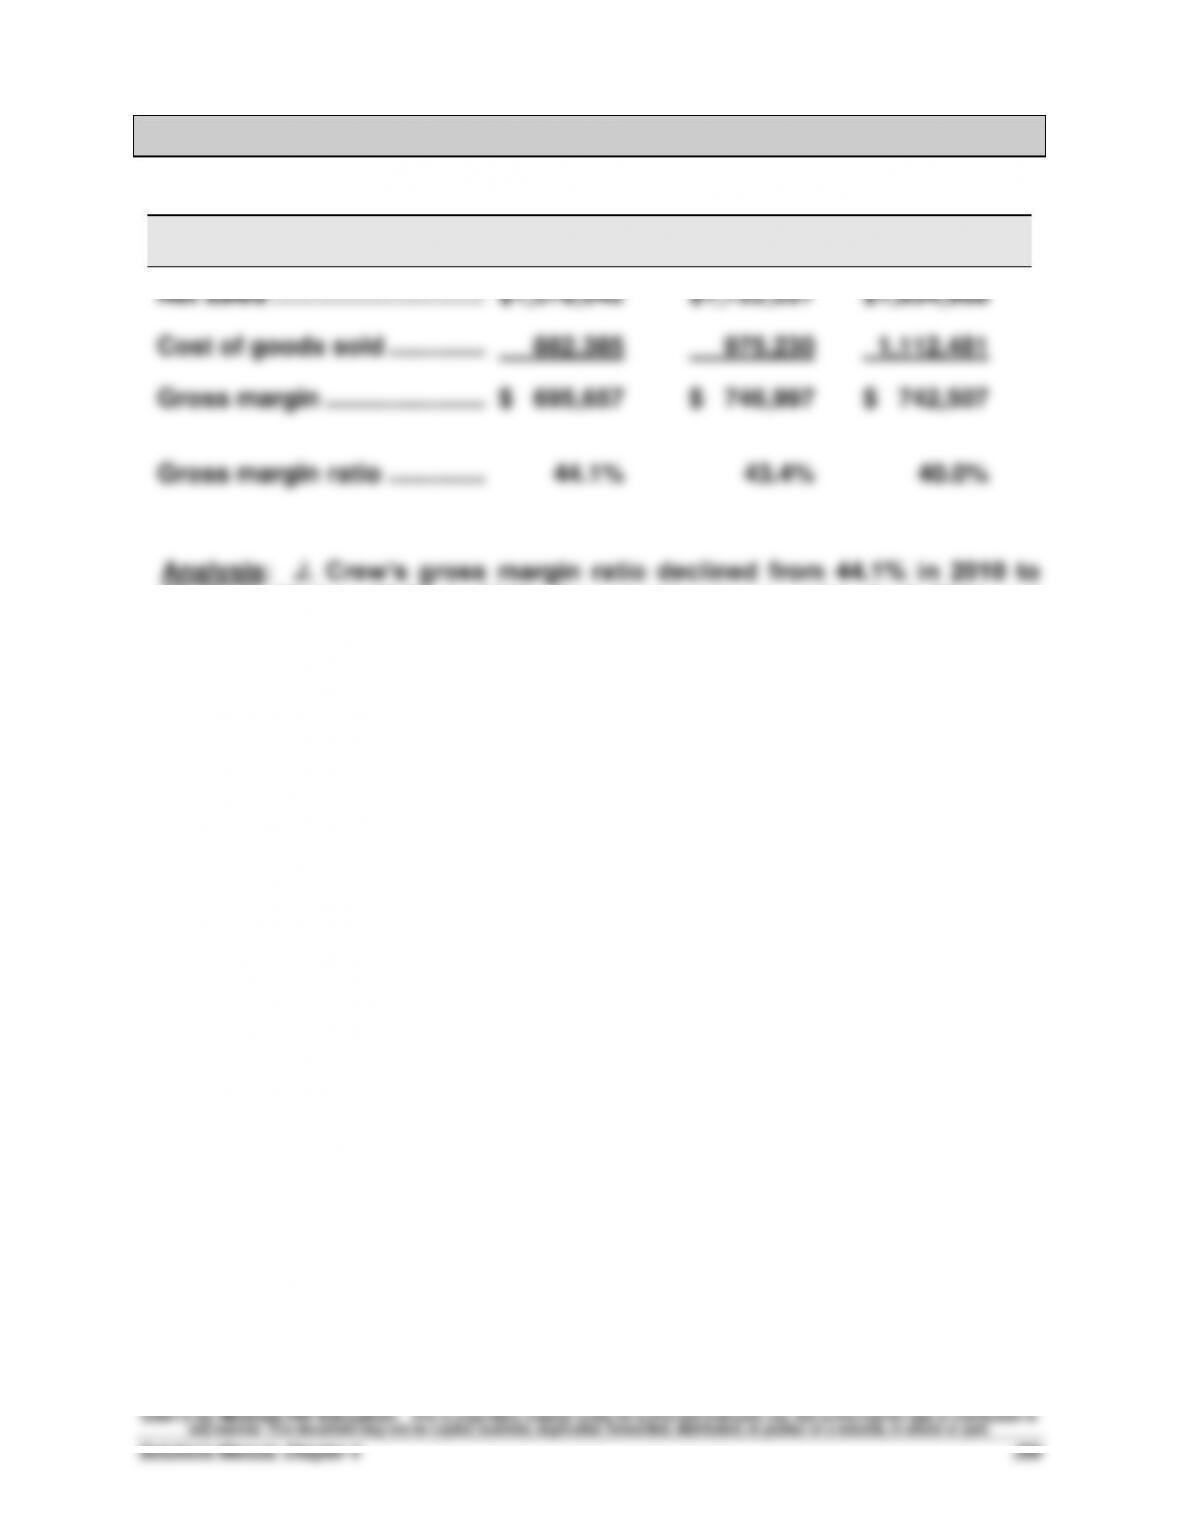
Taking It to the Net — BTN 4-5
Fiscal Year ($ thousands)
2010
2011
2012
Net sales …………………………..
$1,578,042
$1,722,227
$1,854,988
Cost of goods sold …………..…………
882,385
975,230
1,112,481
Gross margin …………………..………
$ 695,657
$ 746,997
$ 742,507
Gross margin ratio …………..…………
44.1%
43.4%
40.0%
Analysis: J. Crew’s gross margin ratio declined from 44.1% in 2010 to
43.4% in 2011 to 40.0% in 2012. Its net sales increased in both 2011 and
2012, albeit with a lower gross margin for both periods.
Financial & Managerial Accounting, 5th Edition
300
Teamwork in Action — BTN 4-6
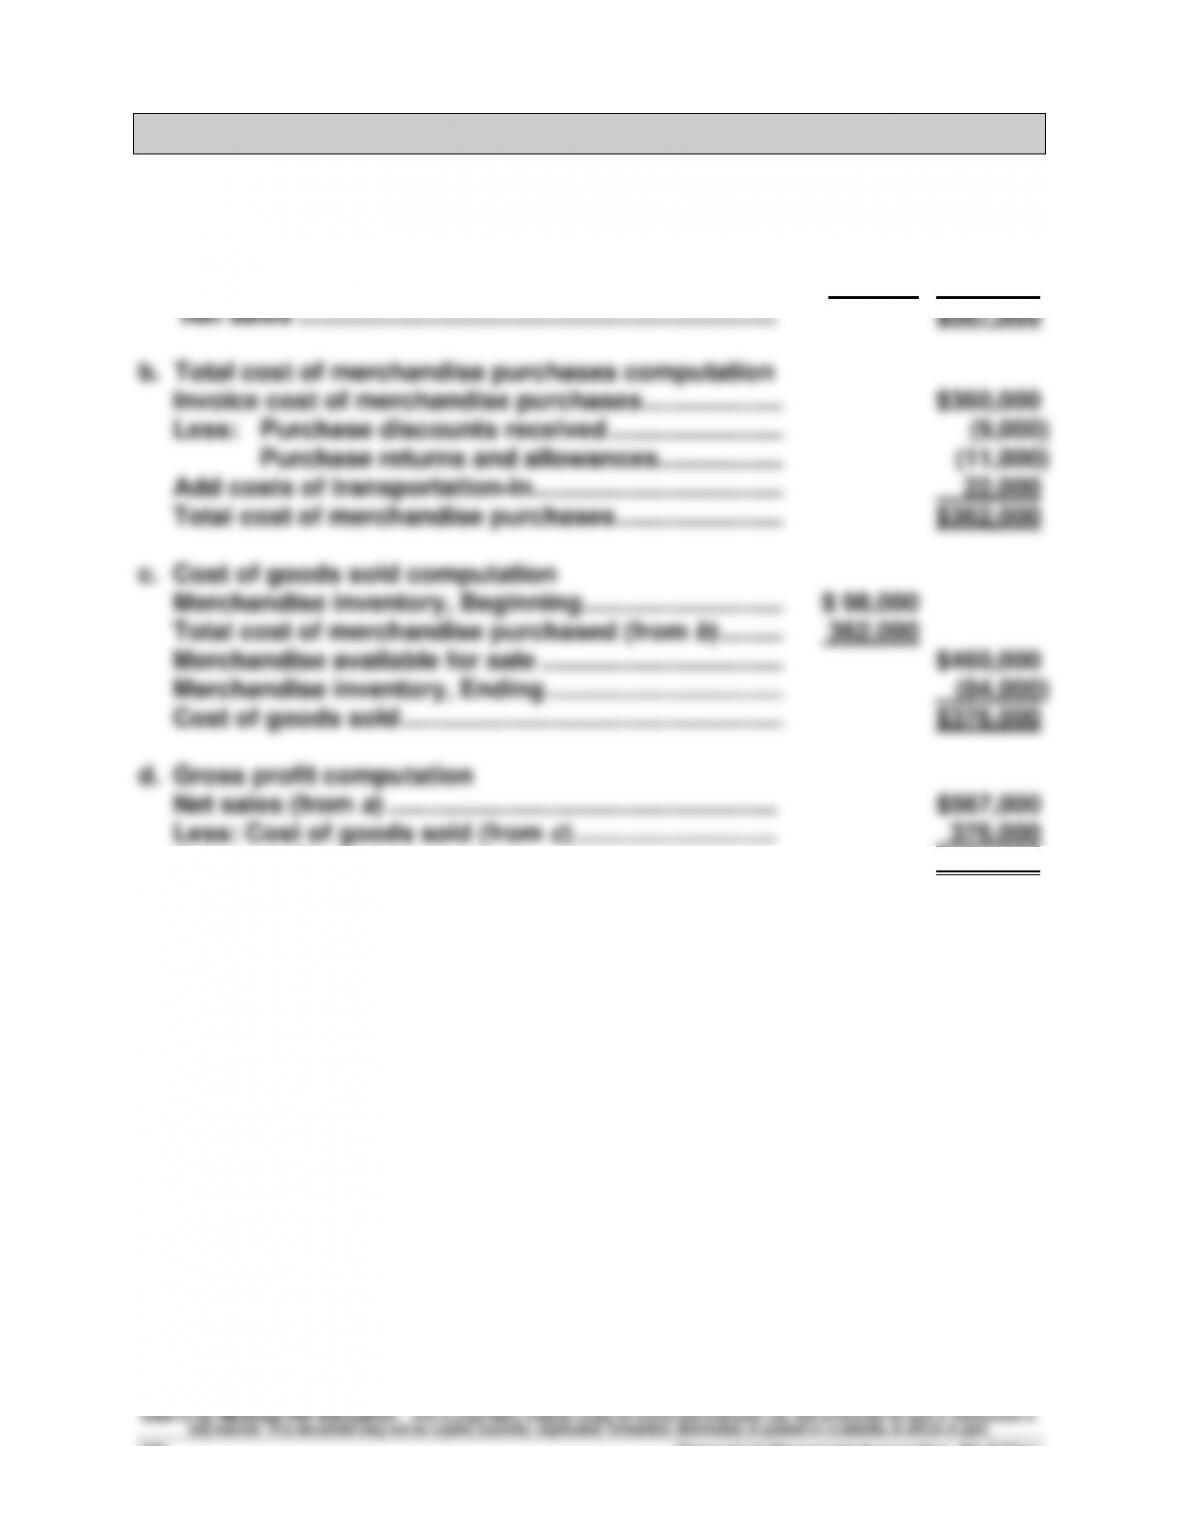
1.
a. Net sales computation
Sales …………………………..…………………………………….. $600,000
Less: Sales discounts ……………………………………… $ 13,000
Sales returns and allowances …………………. 20,000 33,000
Gross profit ……………………………………………………….. $191,000
Teamwork in Action (Concluded)
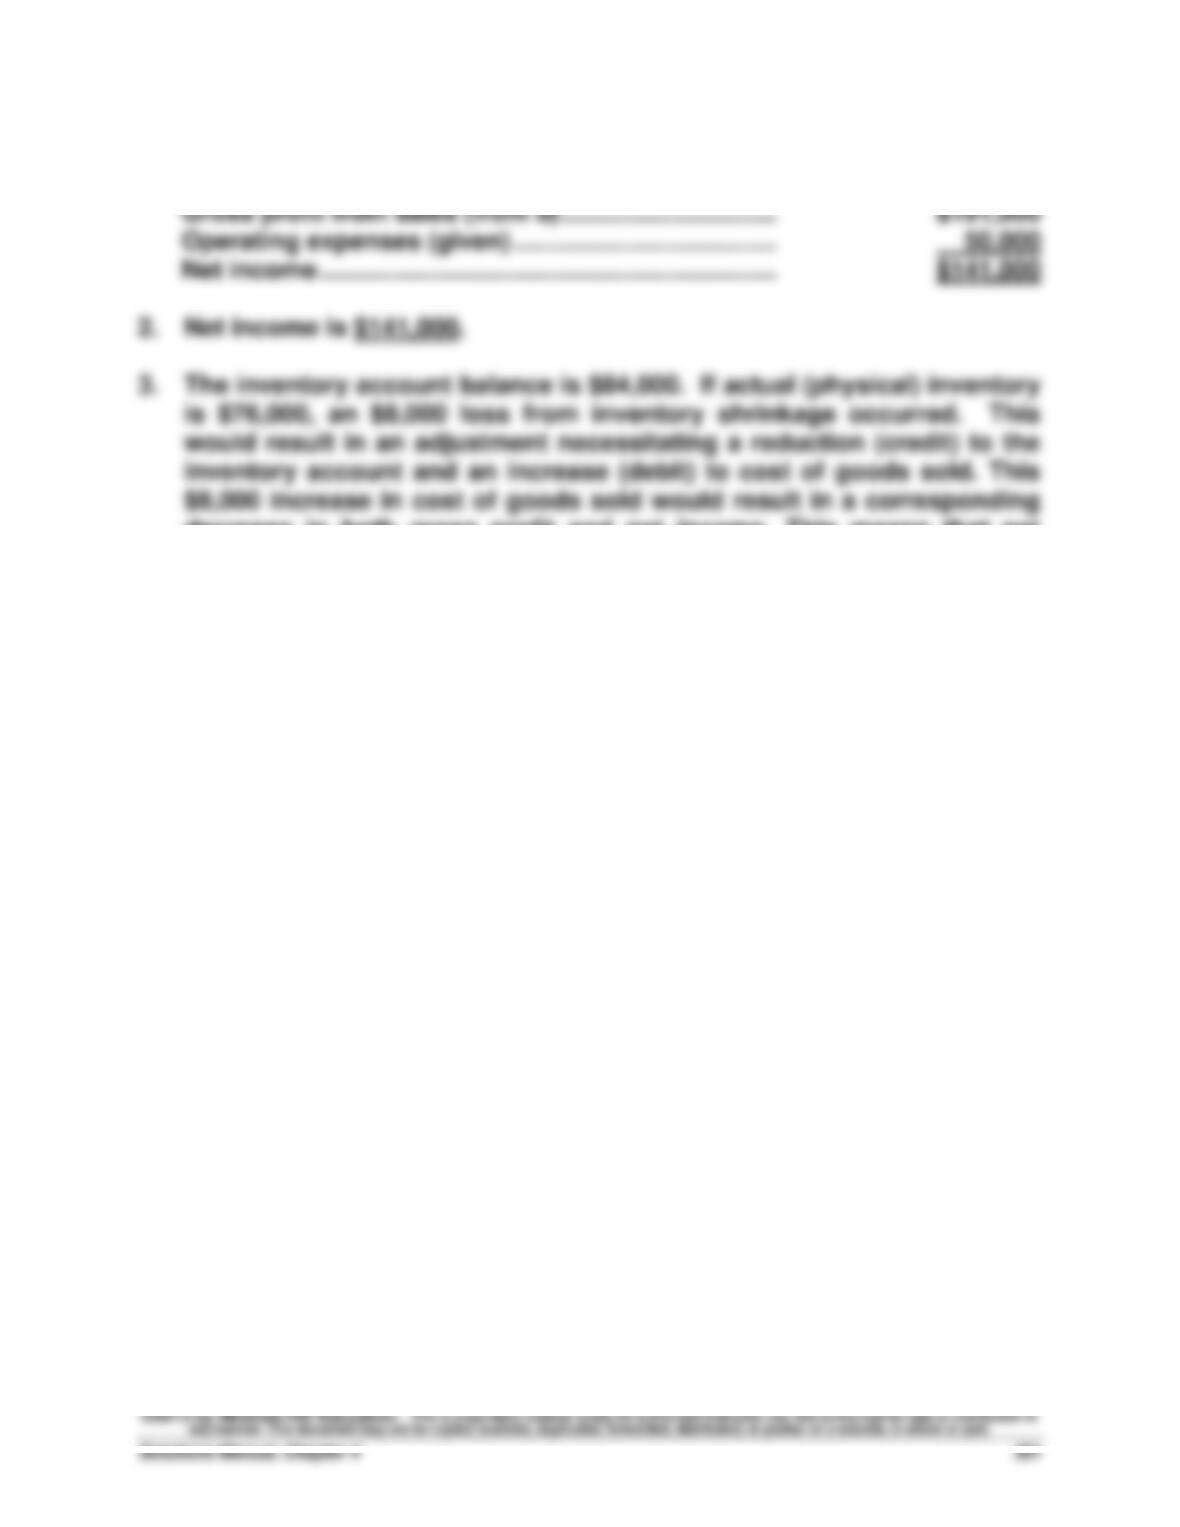
e. Net income computation
decrease in both gross profit and net income. This means that net
income would decline to $133,000.
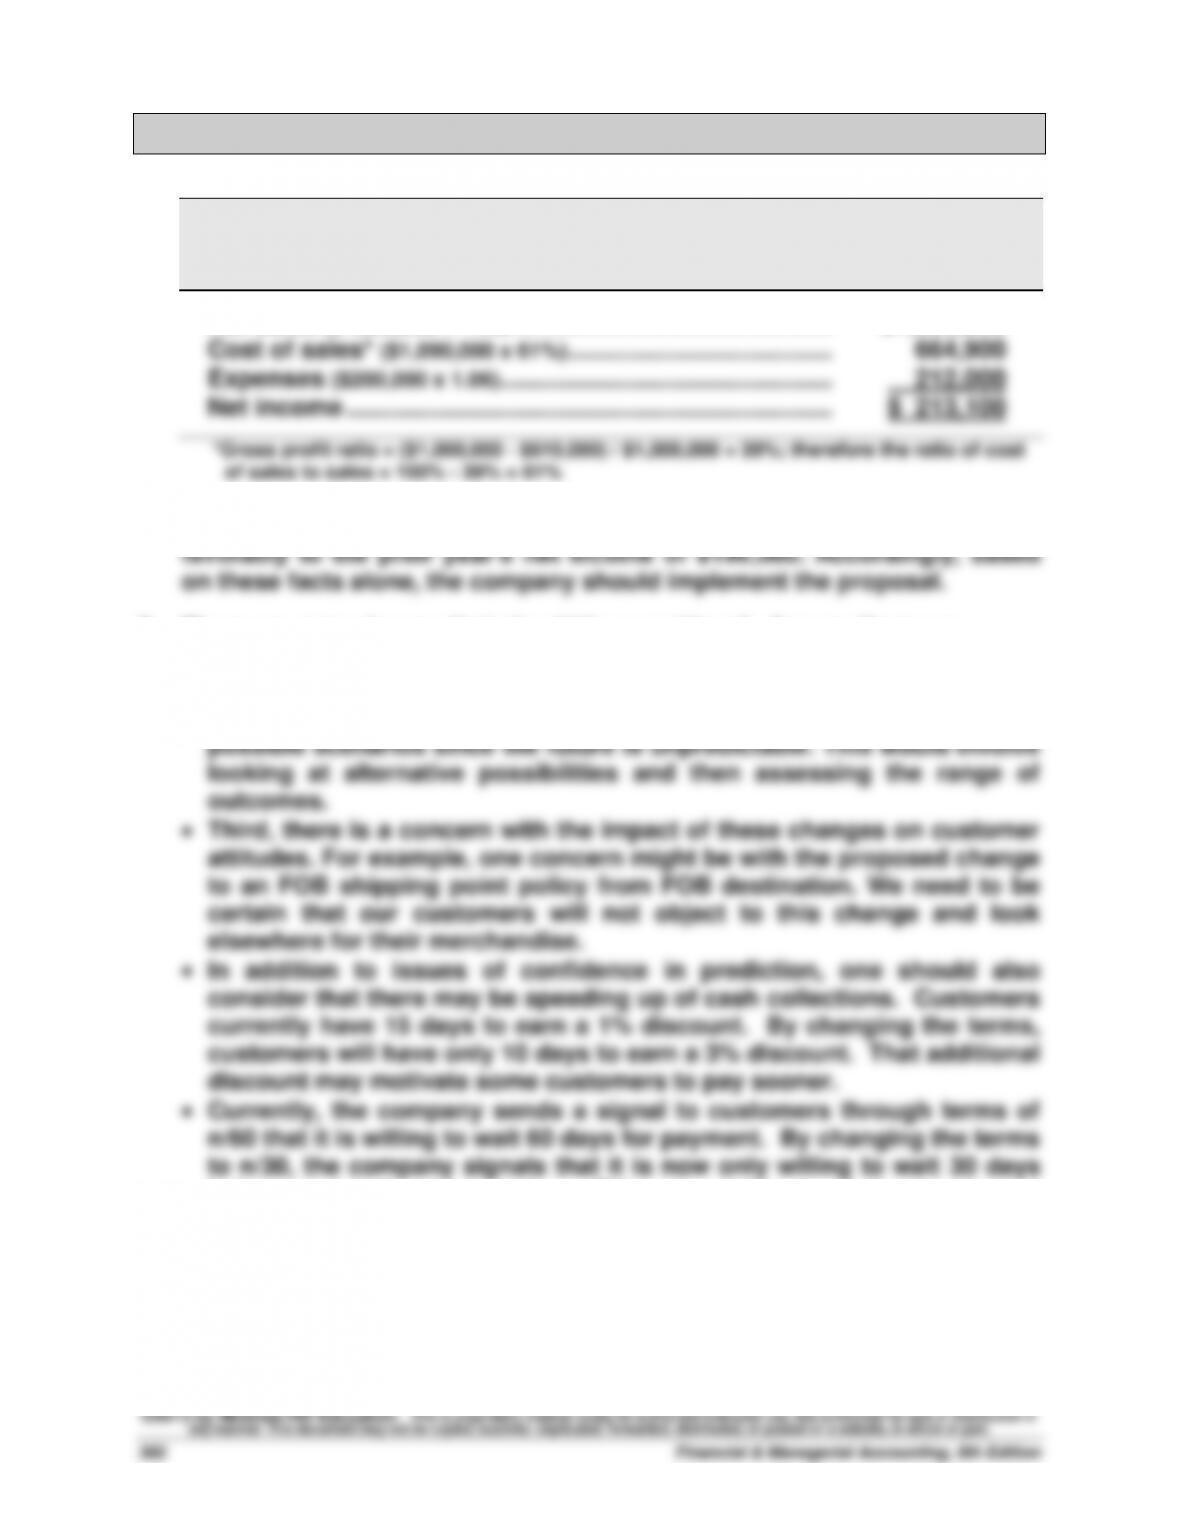
Entrepreneurial Decision — BTN 4-7
1.
Faithful Fish
Forecasted Income Statement
For Year Ended January 31, 2013
Net sales ($1,000,000 x 1.09) ………………………………………. $1,090,000
2. The proposal yields a forecasted net income of $213,100. This compares
3. There are many issues that should be considered. Among them are:
• First, there is the issue of the prediction itself. That is, are estimates
reasonable or could reality be markedly different from these estimates?
• Second, and related to the first, there is a need to consider “ranges” of
before payments are overdue. This may motivate customers to pay
sooner.
In sum, we must consider alternative possibilities, both good and bad,
with these proposed policy changes.
Hitting the Road — BTN 4-8
There is no formal solution for this field activity. As the discussion
facilitator, the instructor should try to develop a sense of how willing retail
managers are in granting sales allowances, the range of return policies
employed, and strategies managers use to stem return abuses.
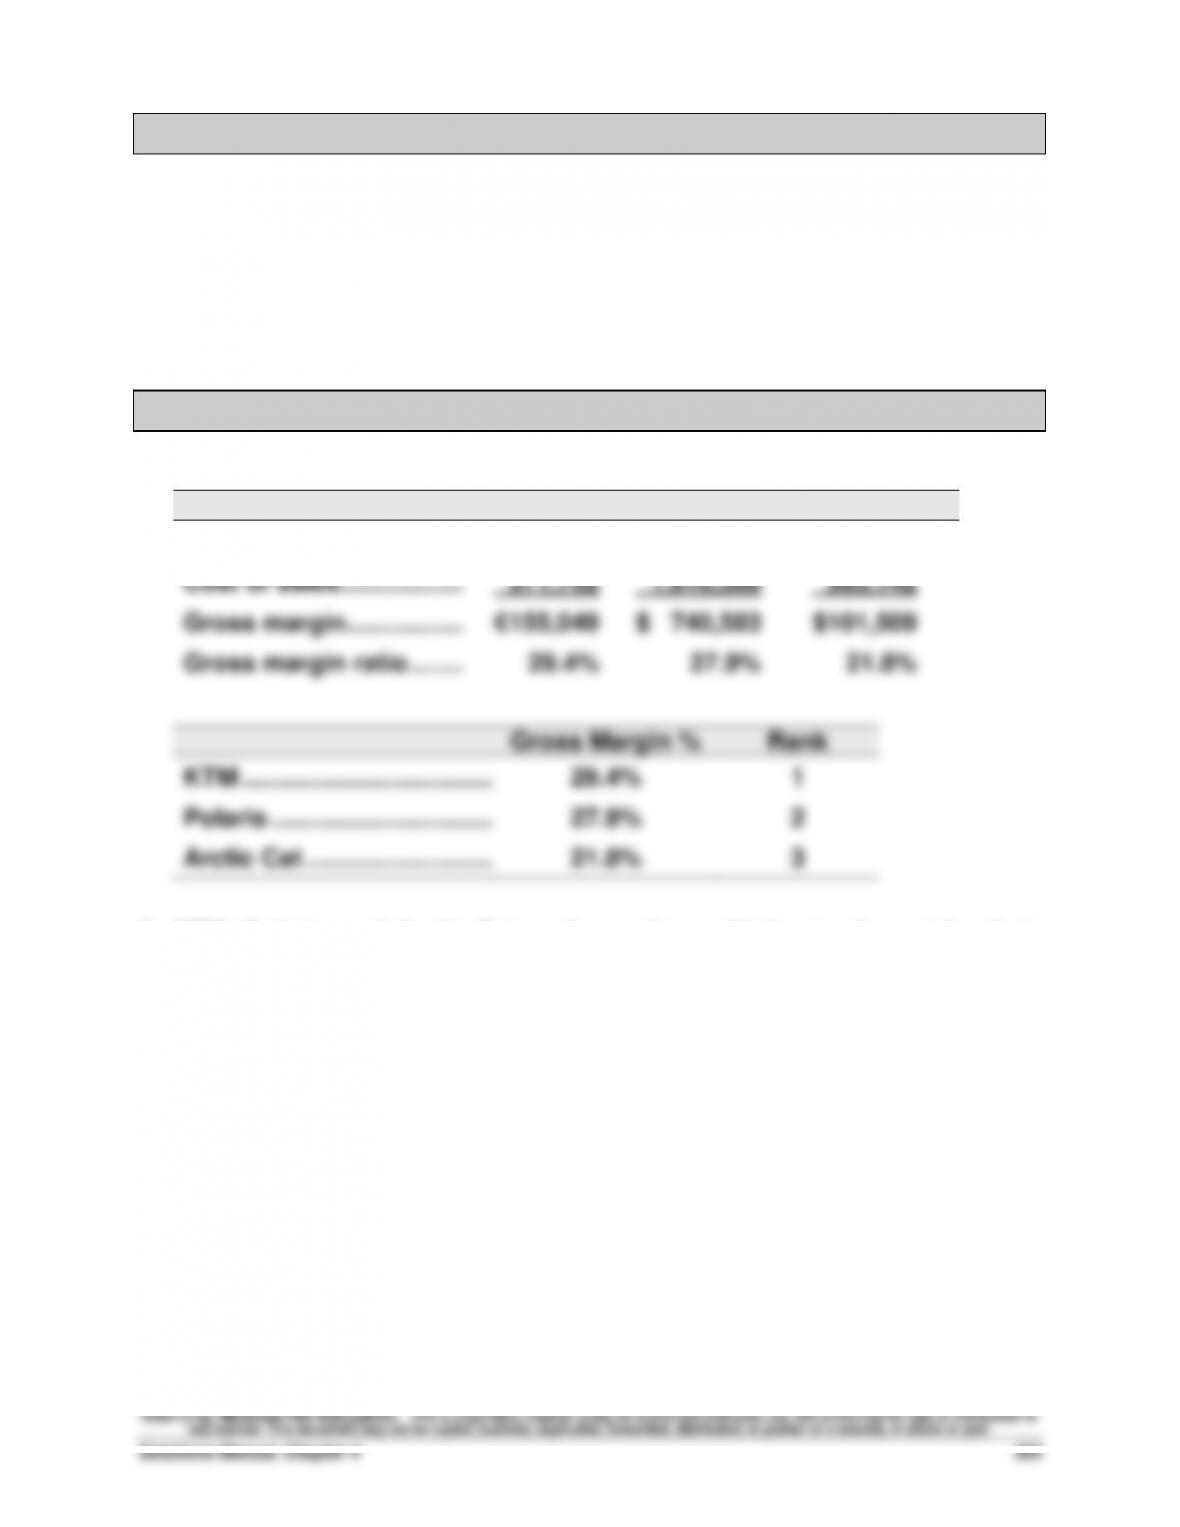
Global Decision — BTN 4-9
1.
(in thousands)
KTM
Polaris
Arctic Cat
Net sales …………………………..
€526,801
$2,656,949
$464,651
Cost of sales …………………………..
371,752
1,916,366
363,142
Gross margin ……………..……………
€155,049
$ 740,583
$101,509
Gross margin ratio ……..……………….
29.4%
27.9%
21.8%
Gross Margin %
Rank
KTM ……………………………….….
29.4%
1
Polaris ……………………………….
27.9%
2
Arctic Cat ……………………….….
21.8%
3
2. KTM, Polaris, and Arctic Cat each use the multiple-step format for their
income statements. KTM’s income statement is somewhat different from
what most U.S. companies use in that the term net result is used instead
of net income or net earnings and they report in EUR instead of dollars.