Unlock document.
This document is partially blurred.
Unlock all pages and 1 million more documents.
Get Access
Problem 24-3B (Continued)
Part 3
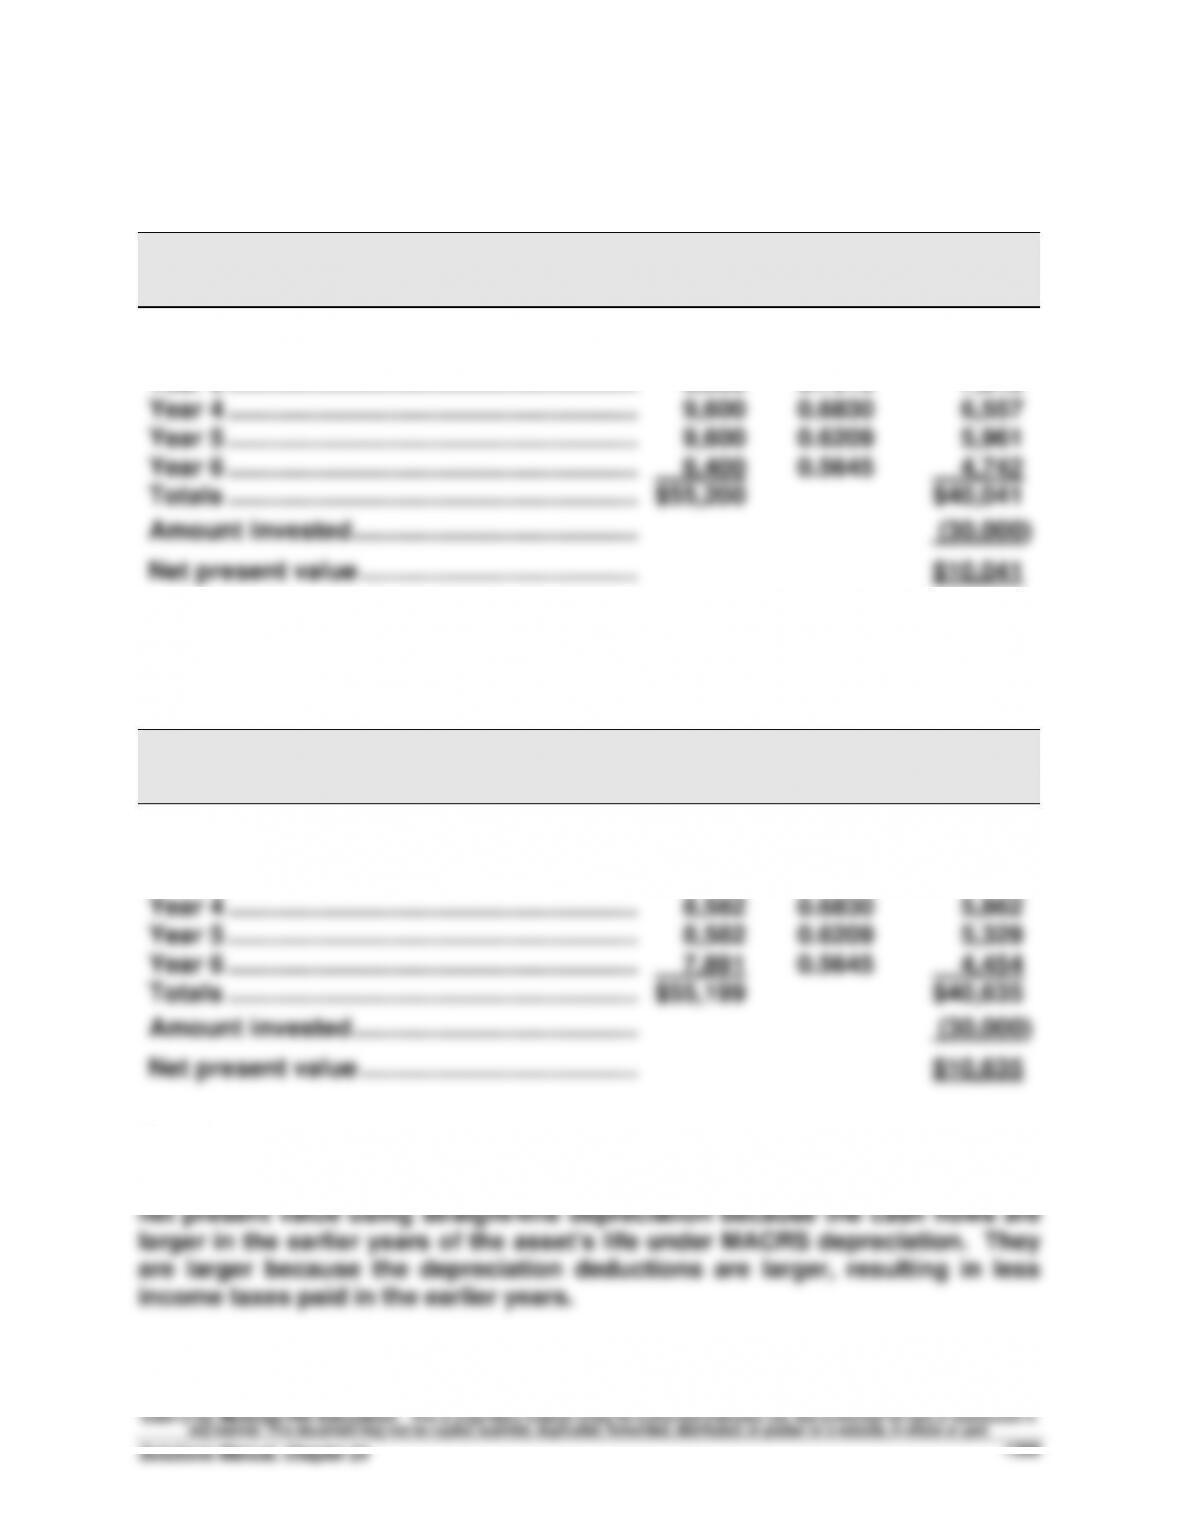
NET PRESENT VALUE OF ASSET USING STRAIGHT-LINE DEPRECIATION
Present
Present
Net Cash
Value of
Value of Net
Flows
1 at 10%
Cash Flows
Year 1 ...........................................................
$ 8,400
0.9091
$ 7,636
Year 2 ...........................................................
9,600
0.8264
7,933
Year 3 ...........................................................
9,600
0.7513
7,212
Year 4 ...........................................................
9,600
0.6830
6,557
Year 5 ...........................................................
9,600
0.6209
5,961
Year 6 ...........................................................
8,400
0.5645
4,742
Totals ...........................................................
$55,200
$40,041
Amount invested .........................................
(30,000)
Net present value ........................................
$10,041
Part 4
NET PRESENT VALUE OF ASSET USING MACRS DEPRECIATION
Present
Present
Net Cash
Value of
Value of Net
Flows
1 at 10%
Cash Flows
Year 1 ...........................................................
$ 9,600
0.9091
$ 8,727
Year 2 ...........................................................
11,040
0.8264
9,123
Year 3 ...........................................................
9,504
0.7513
7,140
Year 4 ...........................................................
8,582
0.6830
5,862
Year 5 ...........................................................
8,582
0.6209
5,329
Year 6 ...........................................................
7,891
0.5645
4,454
Totals ...........................................................
$55,199
$40,635
Amount invested .........................................
(30,000)
Net present value ........................................
$10,635
Part 5
Analysis: The net present value using MACRS depreciation is greater than the
Financial & Managerial Accounting, 5th Edition
1370
Problem 24-4B (45 minutes)
Part 1
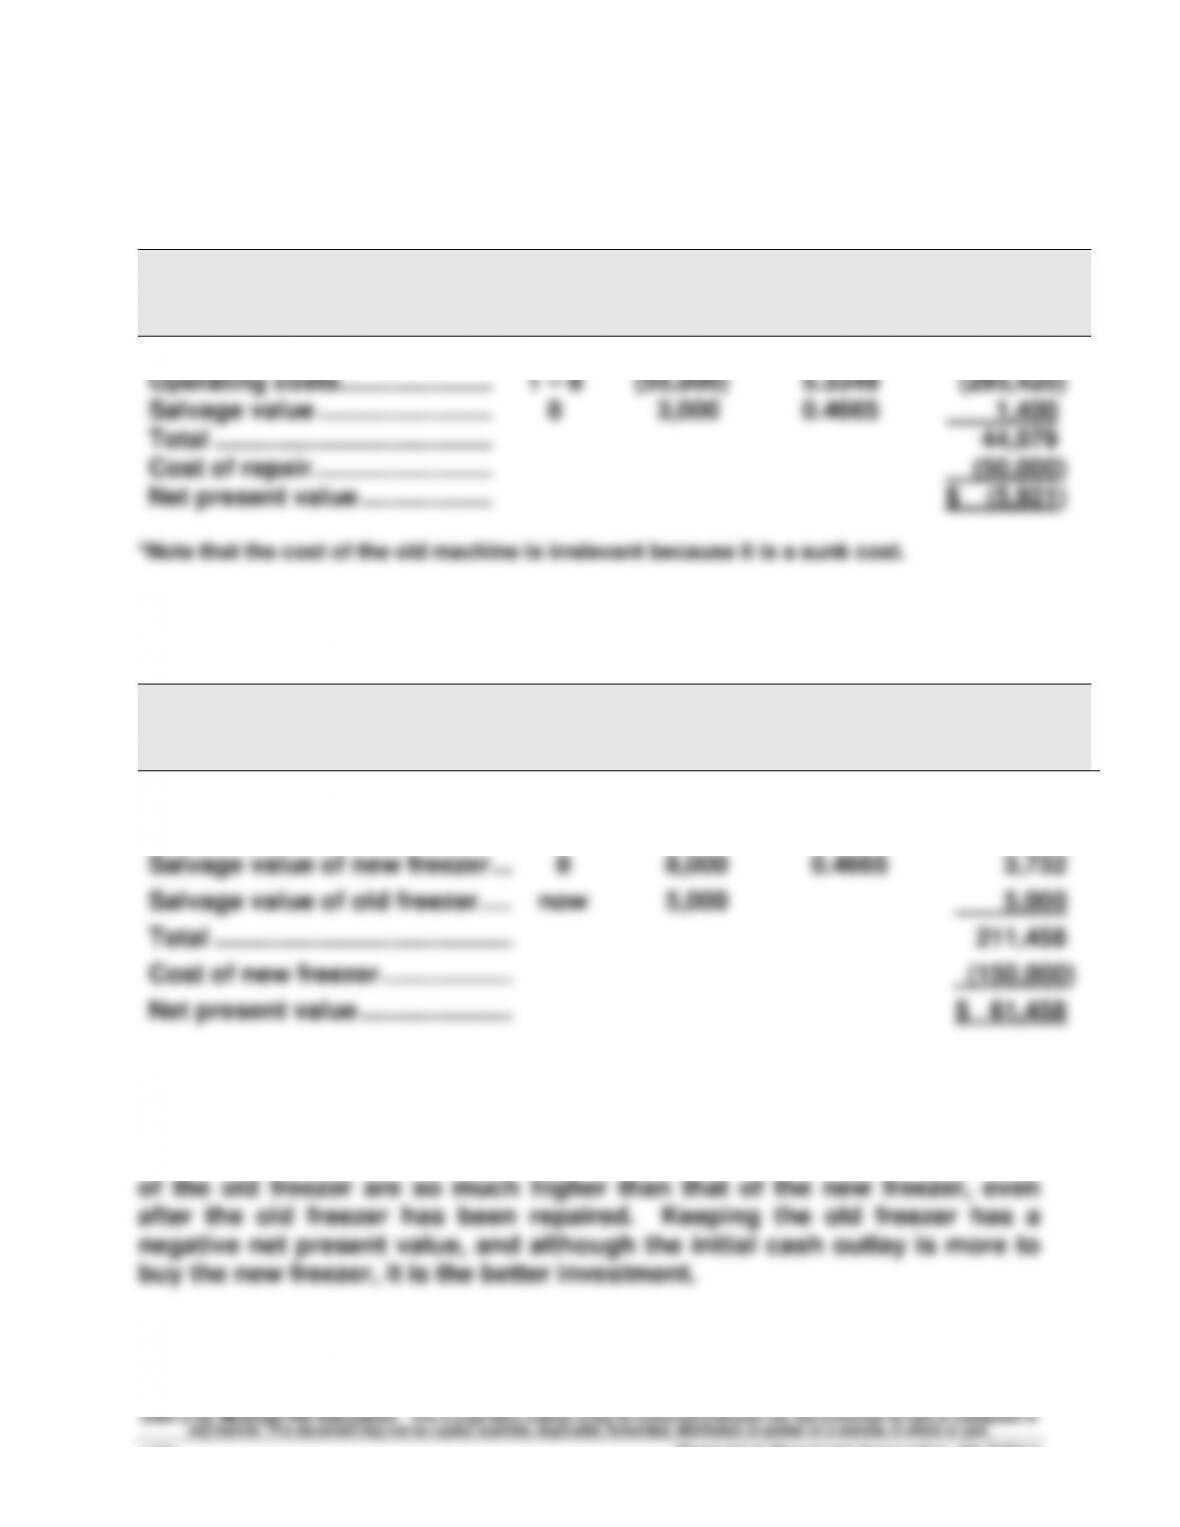
Alternative 1: Keep the old freezer and have it repaired
Item
Period
Cash Flow
Present
Value Factor
at 10%
Present
Value of
Cash Flows
Revenues ................................
1 – 8
$63,000
5.3349
$ 336,099
Operating costs......................
1 – 8
(55,000)
5.3349
(293,420)
Salvage value .........................
8
3,000
0.4665
1,400
Total ........................................
44,079
Cost of repair ..........................
(50,000)
Net present value ...................
$ (5,921)
*Note that the cost of the old machine is irrelevant because it is a sunk cost.
Part 2
Alternative 2: Sell the old freezer and buy a new one
Item
Period
Cash Flow
Present
Value Factor
at 10%
Present
Value of
Cash Flows
Revenues ..........................................
1 – 8
$68,000
5.3349
$ 362,773
Operating costs................................
1 – 8
(30,000)
5.3349
(160,047)
Salvage value of new freezer ..........
8
8,000
0.4665
3,732
Salvage value of old freezer.............
now
5,000
5,000
Total ..................................................
211,458
Cost of new freezer ..........................
(150,000)
Net present value .............................
$ 61,458
Part 3
Archer should sell the old freezer and buy a new one. The operating costs
Problem 24-5B (40 minutes)
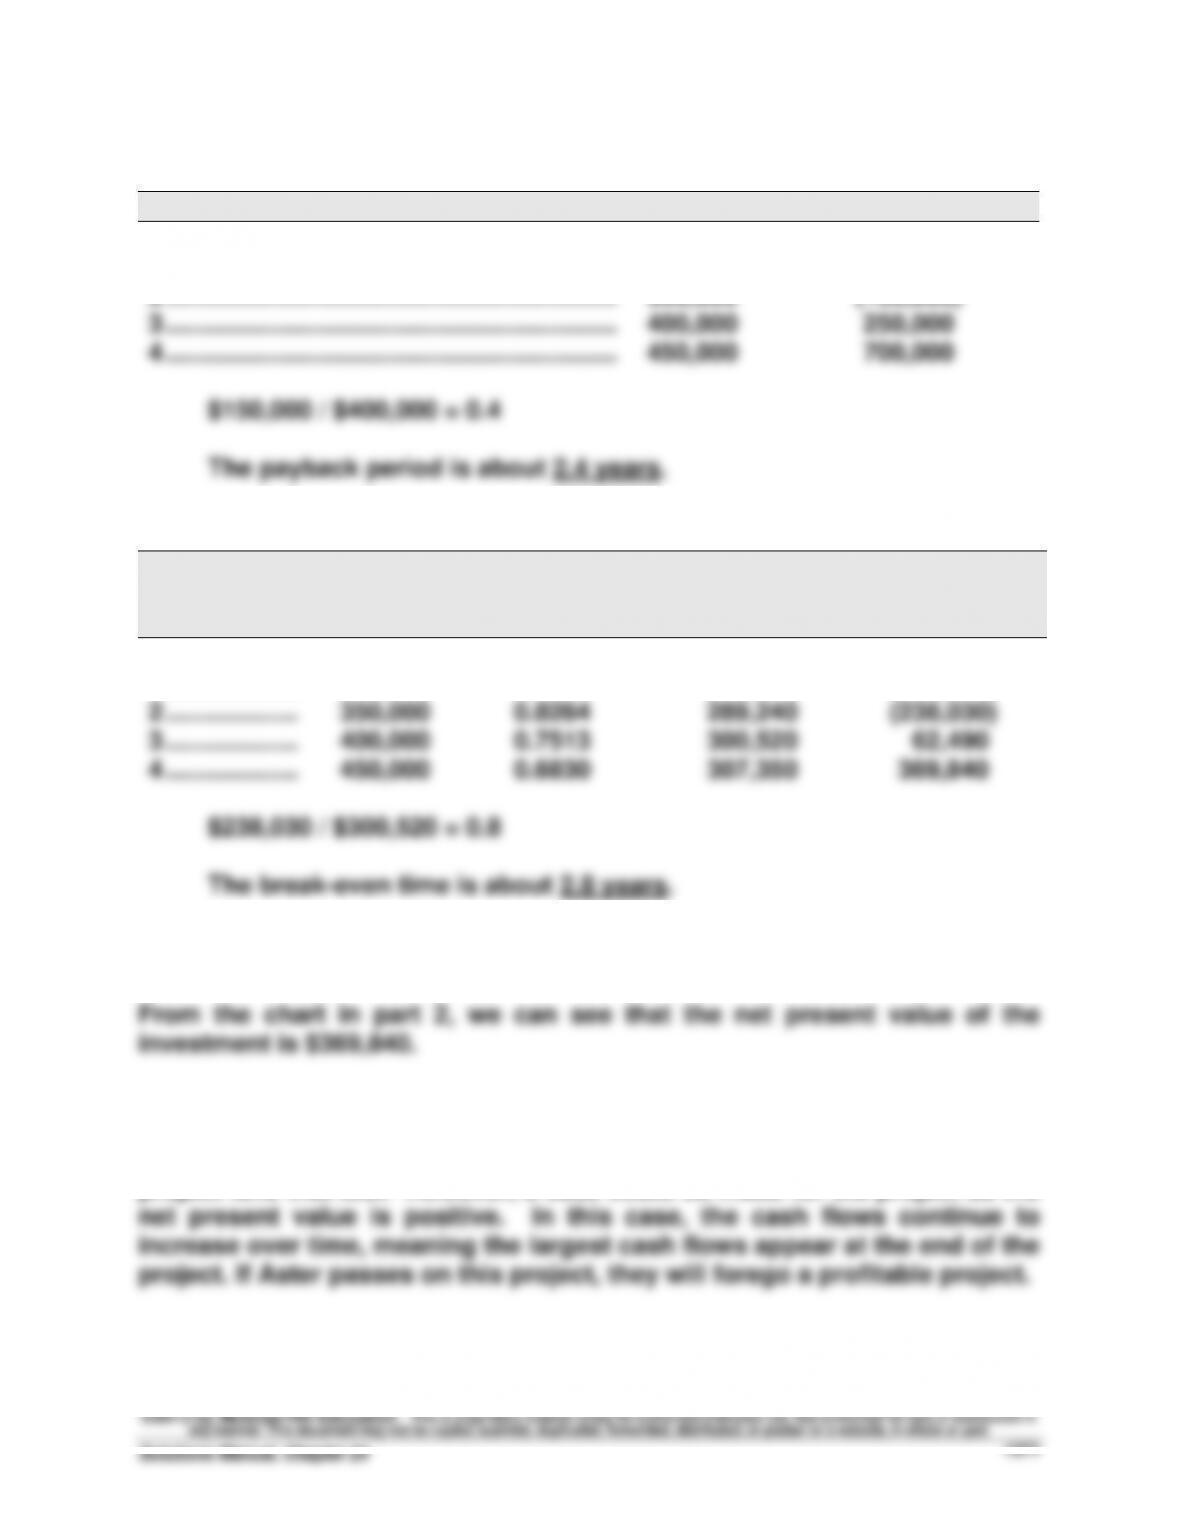
Part 1: Payback period
Period
Cash flow
Cumulative cash flow
0 .............................................................................
$(800,000)
$(800,000)
1 .............................................................................
300,000
(500,000)
2 .............................................................................
350,000
(150,000)
3 .............................................................................
400,000
250,000
4 .............................................................................
450,000
700,000
$150,000 / $400,000 = 0.4
The payback period is about 2.4 years.
Part 2: Break-even time
Period
Cash Flow
Present Value
of 1 at 10%
Present Value
of Cash Flows
Cumulative
Present Value
of Cash Flows
0 ...................
$(800,000)
1.0000
$(800,000)
$(800,000)
1 ...................
300,000
0.9091
272,730
(527,270)
2 ...................
350,000
0.8264
289,240
(238,030)
3 ...................
400,000
0.7513
300,520
62,490
4 ...................
450,000
0.6830
307,350
369,840
$238,030 / $300,520 = 0.8
The break-even time is about 2.8 years.
Part 3: Net present value
Part 4
If the company requires a payback period of 2 years for any project, this
project fails that test. However, a case could be made for the project as the
Financial & Managerial Accounting, 5th Edition
1372
Problem 24-6B (40 minutes)
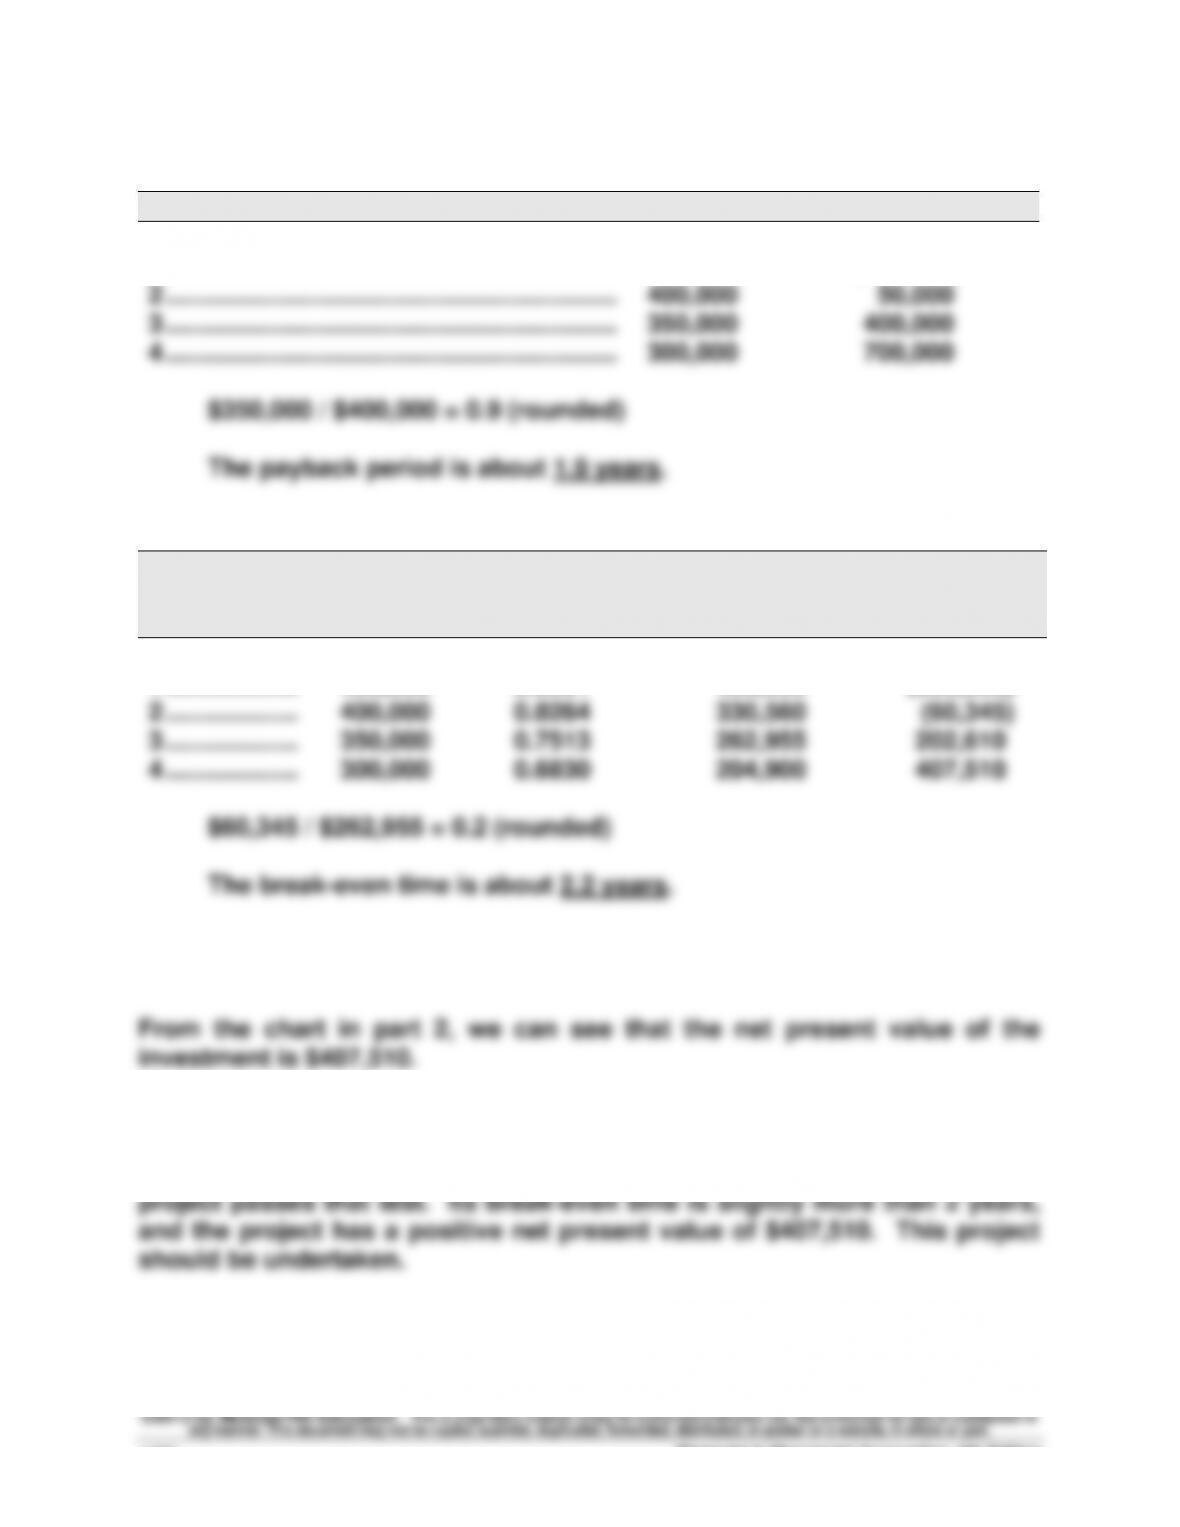
Part 1: Payback period
Period
Cash flow
Cumulative cash flow
0 .............................................................................
$(800,000)
$(800,000)
1 .............................................................................
450,000
(350,000)
2 .............................................................................
400,000
50,000
3 .............................................................................
350,000
400,000
4 .............................................................................
300,000
700,000
$350,000 / $400,000 = 0.9 (rounded)
The payback period is about 1.9 years.
Part 2: Break-even time
Period
Cash Flow
Present Value
of 1 at 10%
Present Value
of Cash Flows
Cumulative
Present Value
of Cash Flows
0 ...................
$(800,000)
1.0000
$(800,000)
$(800,000)
1 ...................
450,000
0.9091
409,095
(390,905)
2 ...................
400,000
0.8264
330,560
(60,345)
3 ...................
350,000
0.7513
262,955
202,610
4 ...................
300,000
0.6830
204,900
407,510
$60,345 / $262,955 = 0.2 (rounded)
The break-even time is about 2.2 years.
Part 3: Net present value
Part 4
If the company requires a payback period of 2 years for any project, this
Problem 24-6B (Concluded)
Part 5
While the total cash flows are identical to those in Problem 24-5B, the cash
Financial & Managerial Accounting, 5th Edition
1374
SERIAL PROBLEM — SP 24
Serial Problem, Success Systems (50 minutes)
COMPUTING NET CASH FLOWS FROM NET INCOME
Net income
Cash flows
Sales ................................................................................
$375,000
$375,000
Materials, labor & overhead ..........................................
(200,000)
(200,000)
Depreciation* ................................................................
(50,000)
Selling and administrative ............................................
(37,500)
(37,500)
Pretax income ................................................................
87,500
Income taxes (30%) .......................................................
(26,250)
(26,250)
Net income ................................................................
$ 61,250
Net cash flows ................................................................
$111,250**
* Depreciation expense = $300,000 / 6 years = $50,000
** This equals the net income plus the depreciation expense ($61,250 + $50,000 = $111,250).
*Average investment
Cost ....................................................
$300,000
Salvage ..............................................
0
Sum ....................................................
$300,000
Average (Sum/2) ................................
$150,000
$111,250
Reporting in Action — BTN 24-1
1. The internal rate of return (given here as 10%) is the rate which yields a
net present value of zero for an investment. The annuity factor for 10
periods and a discount rate of 10% is 6.1446. This means we can solve
for the amount of annual cash flows as follows:
2. Answer depends on the information obtained.
Comparative Analysis — BTN 24-2
1. We know that the present value equals the annual cash flows times the
present value of an annuity factor for 7 periods, 15%. This means:
$2.42 million = Annual cash flows x 4.1604
Therefore,
internal rate of return of 15%, if they invest $2.42 million for 7 years.
2. Relatively speaking, Arctic Cat’s assumed hurdle rate is higher than
Polaris’s, thus Arctic Cat must use its assets more efficiently to provide
the required return on these expenditures.
Ethics Challenge — BTN 24-3
1. Present value of $100 to be received in 10 years assuming a 12%
discount rate is approximately $32. This is computed as $100 x 0.322.
2. We need to be concerned about any project with expected long-term
cash inflows. This is especially the case if the larger cash inflows are
expected later rather than sooner in the asset’s life. This concern is tied
Communicating in Practice — BTN 24-4
Instructor note: Answers will vary, but responses should address the questions
asked and include some discussion of the following points for each method.
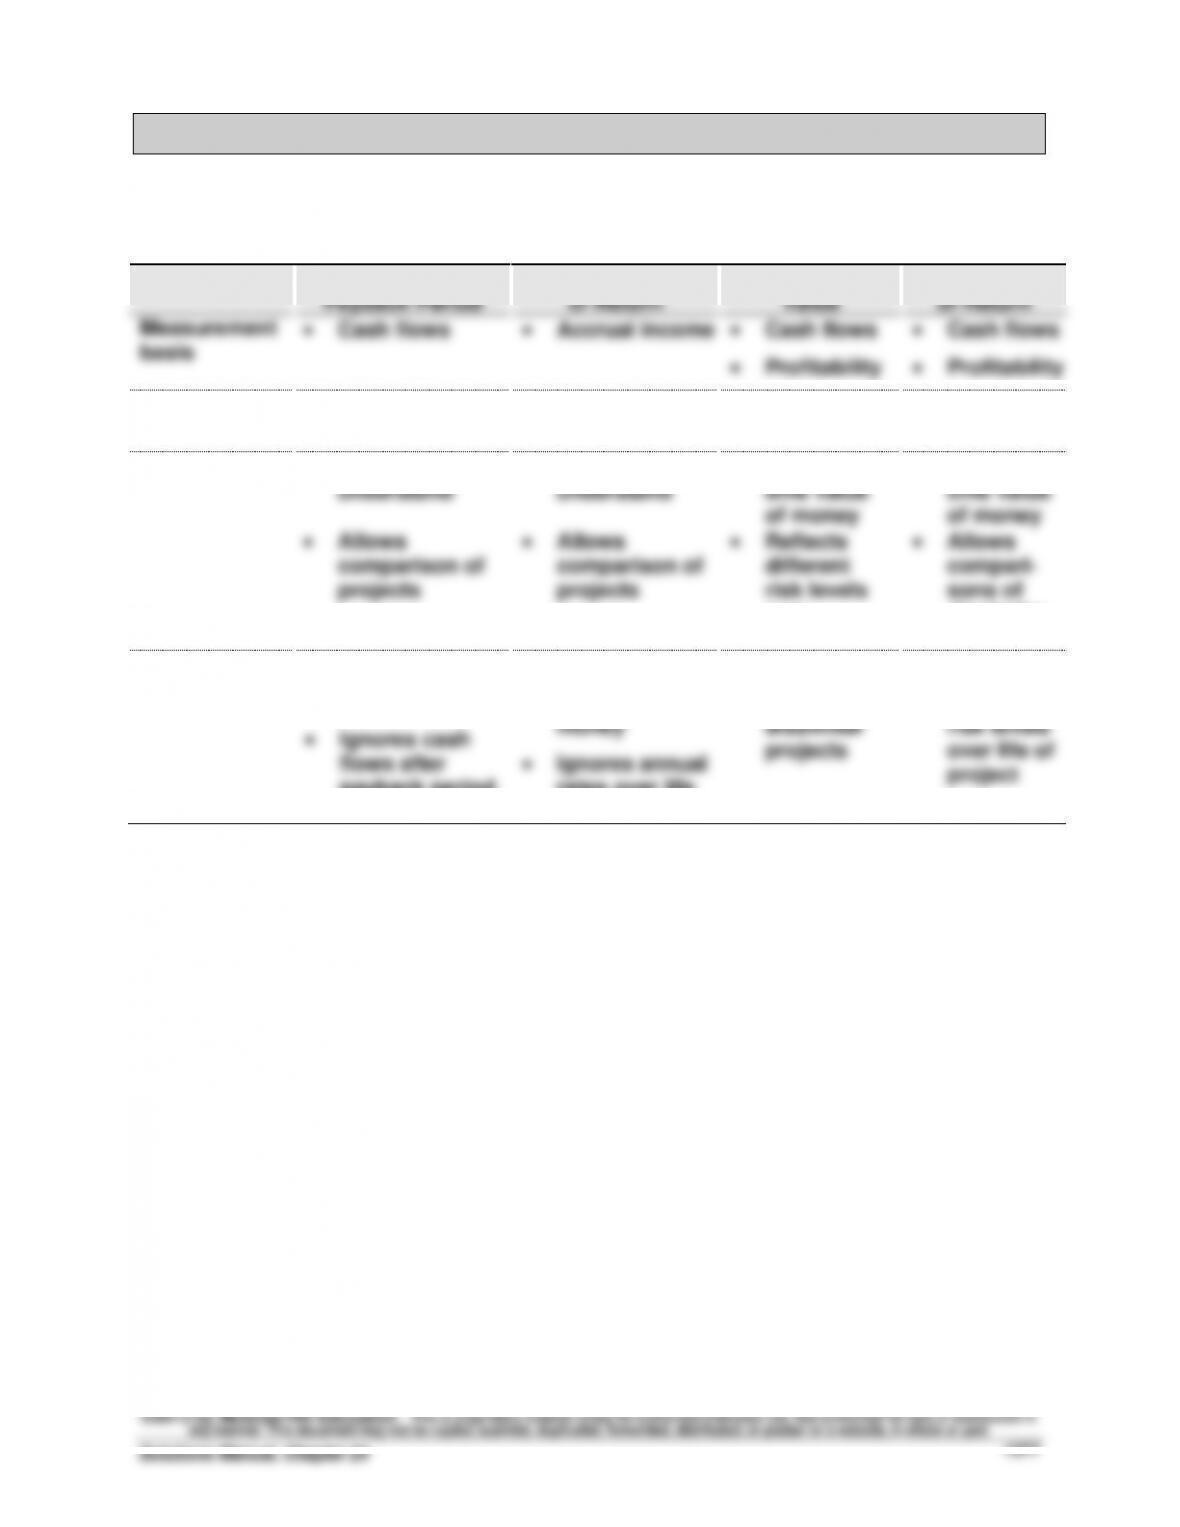
Payback Period
Accounting Rate
of Return
Net Present
Value
Internal Rate
of Return
Measurement
basis
• Cash flows
• Accrual income
• Cash flows
• Profitability
• Cash flows
• Profitability
Measurement
unit
• Periods
• Percent
• Dollars
• Percent
Strengths
• Easy to
understand
• Allows
comparison of
projects
• Easy to
understand
• Allows
comparison of
projects
• Reflects
time value
of money
• Reflects
different
risk levels
over
project’s life
• Reflects
time value
of money
• Allows
compari-
sons of
dissimilar
projects
Limitations
• Ignores time
value of money
• Ignores cash
flows after
payback period
• Ignores time
value of
money
• Ignores annual
rates over life
of project
• Difficult to
compare
dissimilar
projects
• Ignores
varying
risk levels
over life of
project
Financial & Managerial Accounting, 5th Edition
1378
Taking It to the Net — BTN 24-5
Period
Cash flow
Cumulative cash flow
0 .............................................................................
$(15,000)
$(15,000)
1 .............................................................................
1,000
(14,000)
2 .............................................................................
2,000
(12,000)
3 .............................................................................
3,000
(9,000)
4 .............................................................................
6,000
(3,000)
5 .............................................................................
7,000
4,000
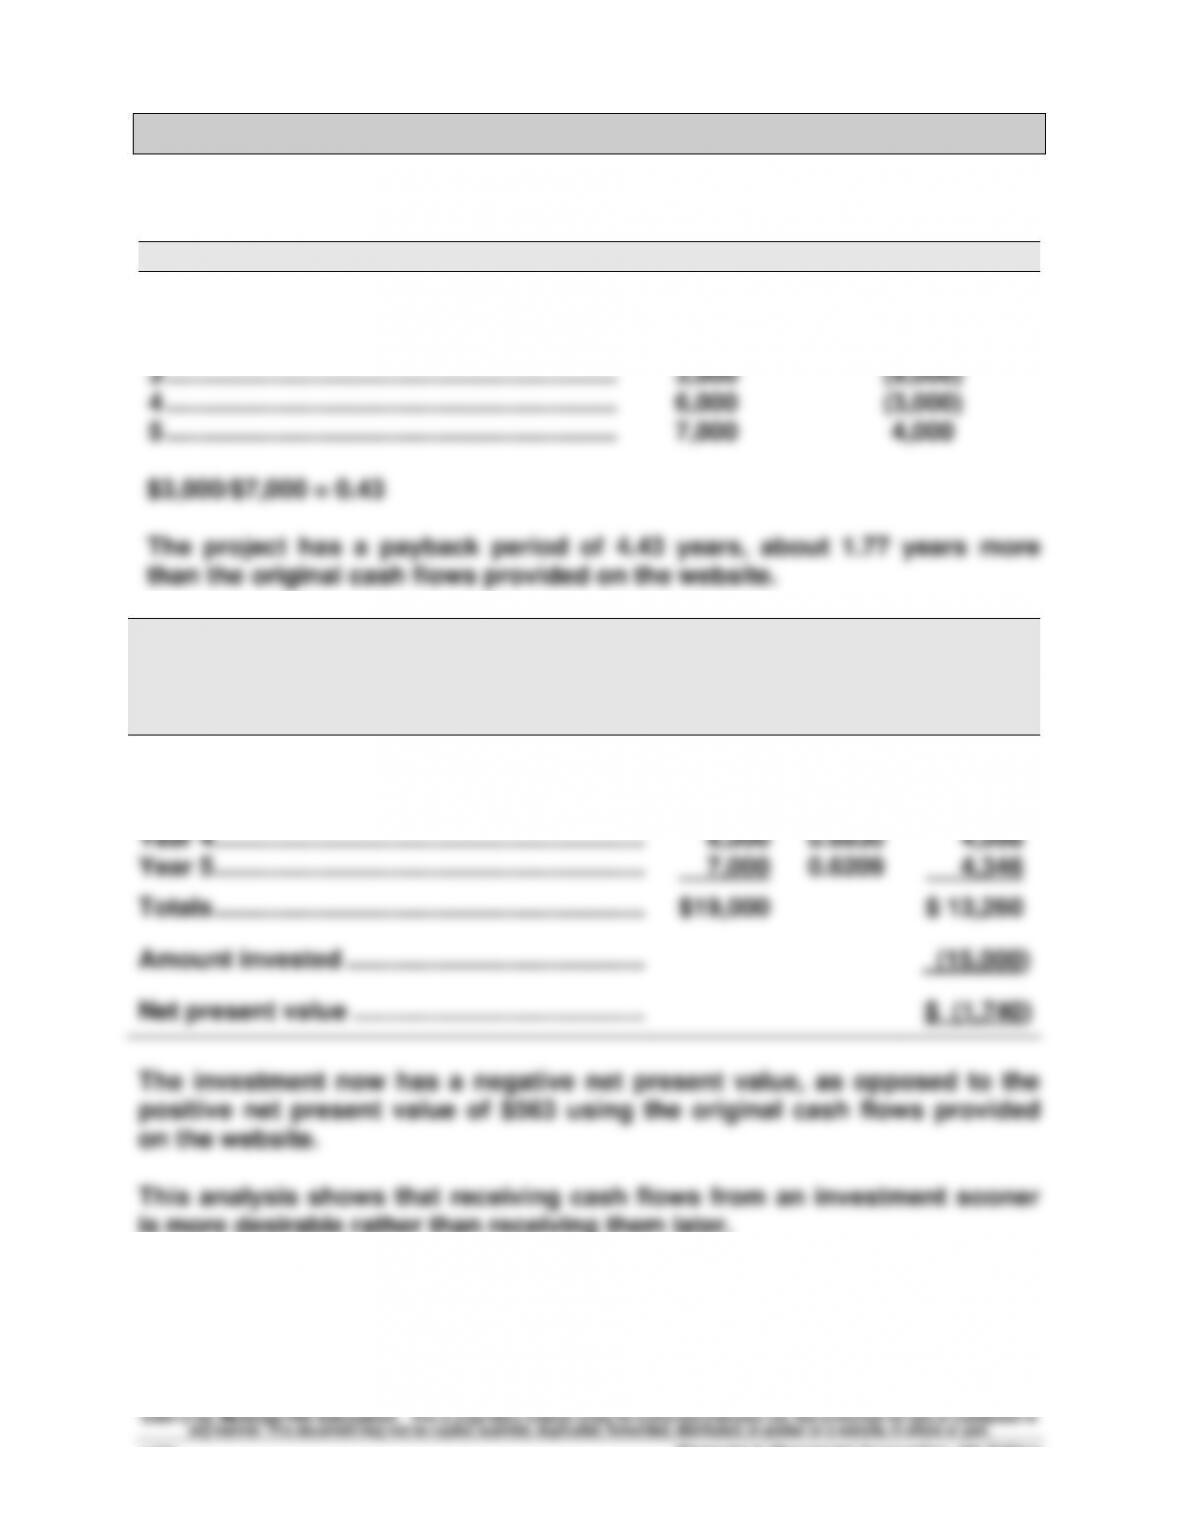
$3,000/$7,000 = 0.43
The project has a payback period of 4.43 years, about 1.77 years more
than the original cash flows provided on the website.
Present
Present
Value of
Net Cash
Flows
Value of
1 at 10%
Net Cash
Flows
Year 1 ..............................................................
$ 1,000
0.9091
$ 909
Year 2 ..............................................................
2,000
0.8264
1,653
Year 3 ..............................................................
3,000
0.7513
2,254
Year 4 ..............................................................
6,000
0.6830
4,098
Year 5 ..............................................................
7,000
0.6209
4,346
Totals ..............................................................
$19,000
$ 13,260
Amount invested ...........................................
(15,000)
Net present value ..........................................
$ (1,740)
The investment now has a negative net present value, as opposed to the
positive net present value of $563 using the original cash flows provided
on the website.
This analysis shows that receiving cash flows from an investment sooner
is more desirable rather than receiving them later.
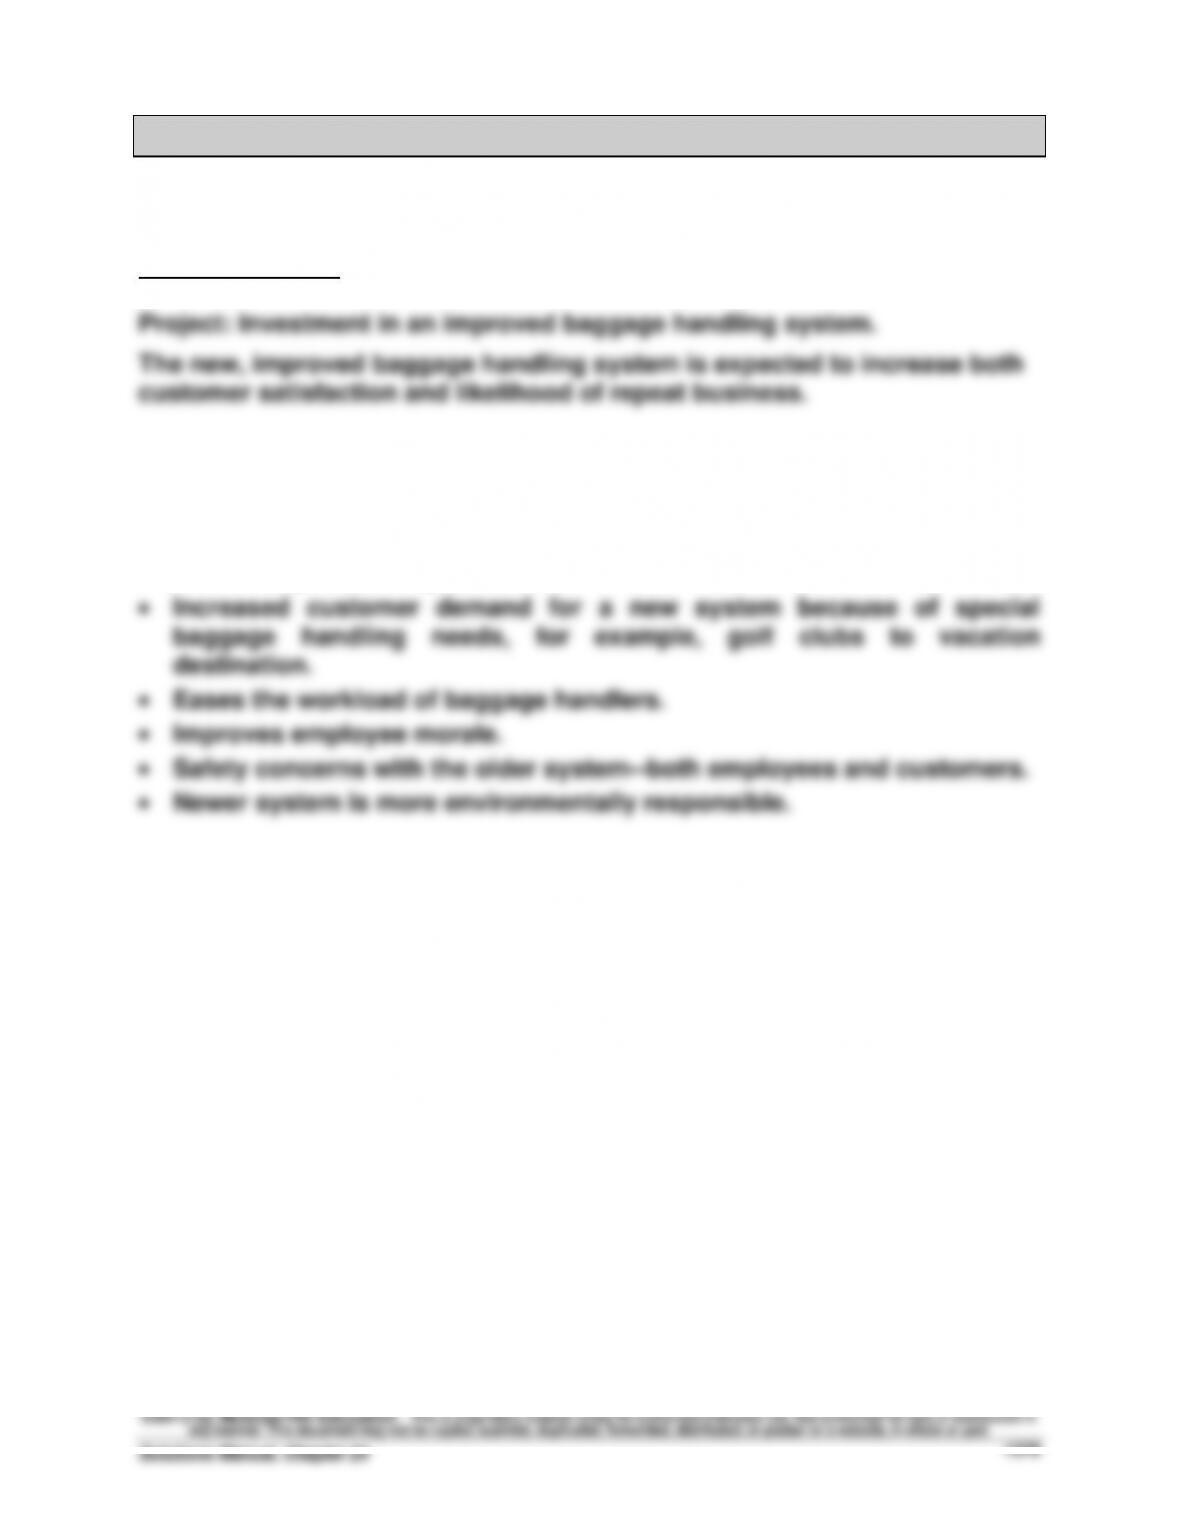
Teamwork in Action — BTN 24-6
Instructor note: Answers will vary across students. Yet the examples, while
different, should capture similar qualitative factors.
SAMPLE SOLUTION
Qualitative Factors
• Competition has a new, more efficient and effective system.
• Need to replace old system.
Entrepreneurial Decision — BTN 24-7
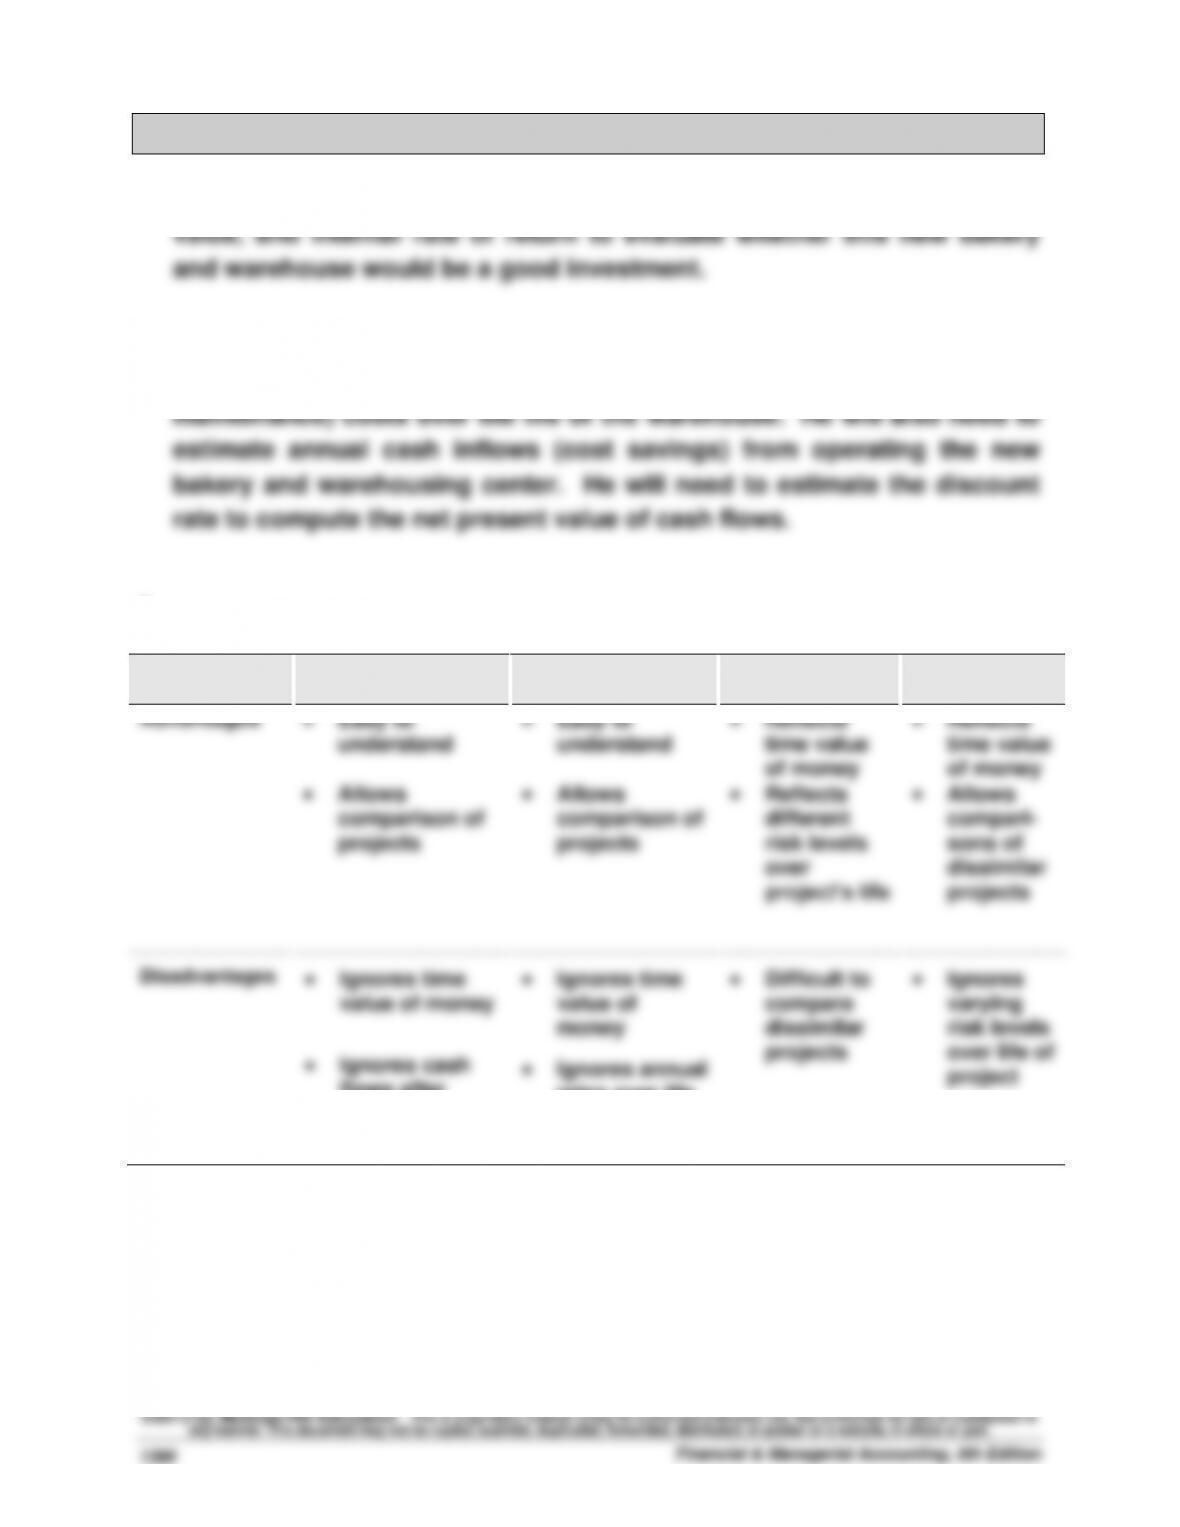
1. Charlie could use payback period, accounting rate of return, net present
2. For these tools, Charlie needs estimates of how much the bakery and
warehousing center will cost, both upfront and for recurring (e.g.
3.
Payback Period
Accounting Rate
of Return
Net Present
Value
Internal Rate
of Return
Advantages
• Easy to
understand
• Allows
comparison of
projects
• Easy to
understand
• Allows
comparison of
projects
• Reflects
time value
of money
• Reflects
different
risk levels
over
project’s life
• Reflects
time value
of money
• Allows
compari-
sons of
dissimilar
projects
Disadvantages
• Ignores time
value of money
• Ignores cash
flows after
payback period
• Ignores time
value of
money
• Ignores annual
rates over life
of project
• Difficult to
compare
dissimilar
projects
• Ignores
varying
risk levels
over life of
project
Hitting the Road — BTN 24-8
1. Answers will vary among students.
Sample Example
For illustrative purposes, one sample solution would appear as follows:
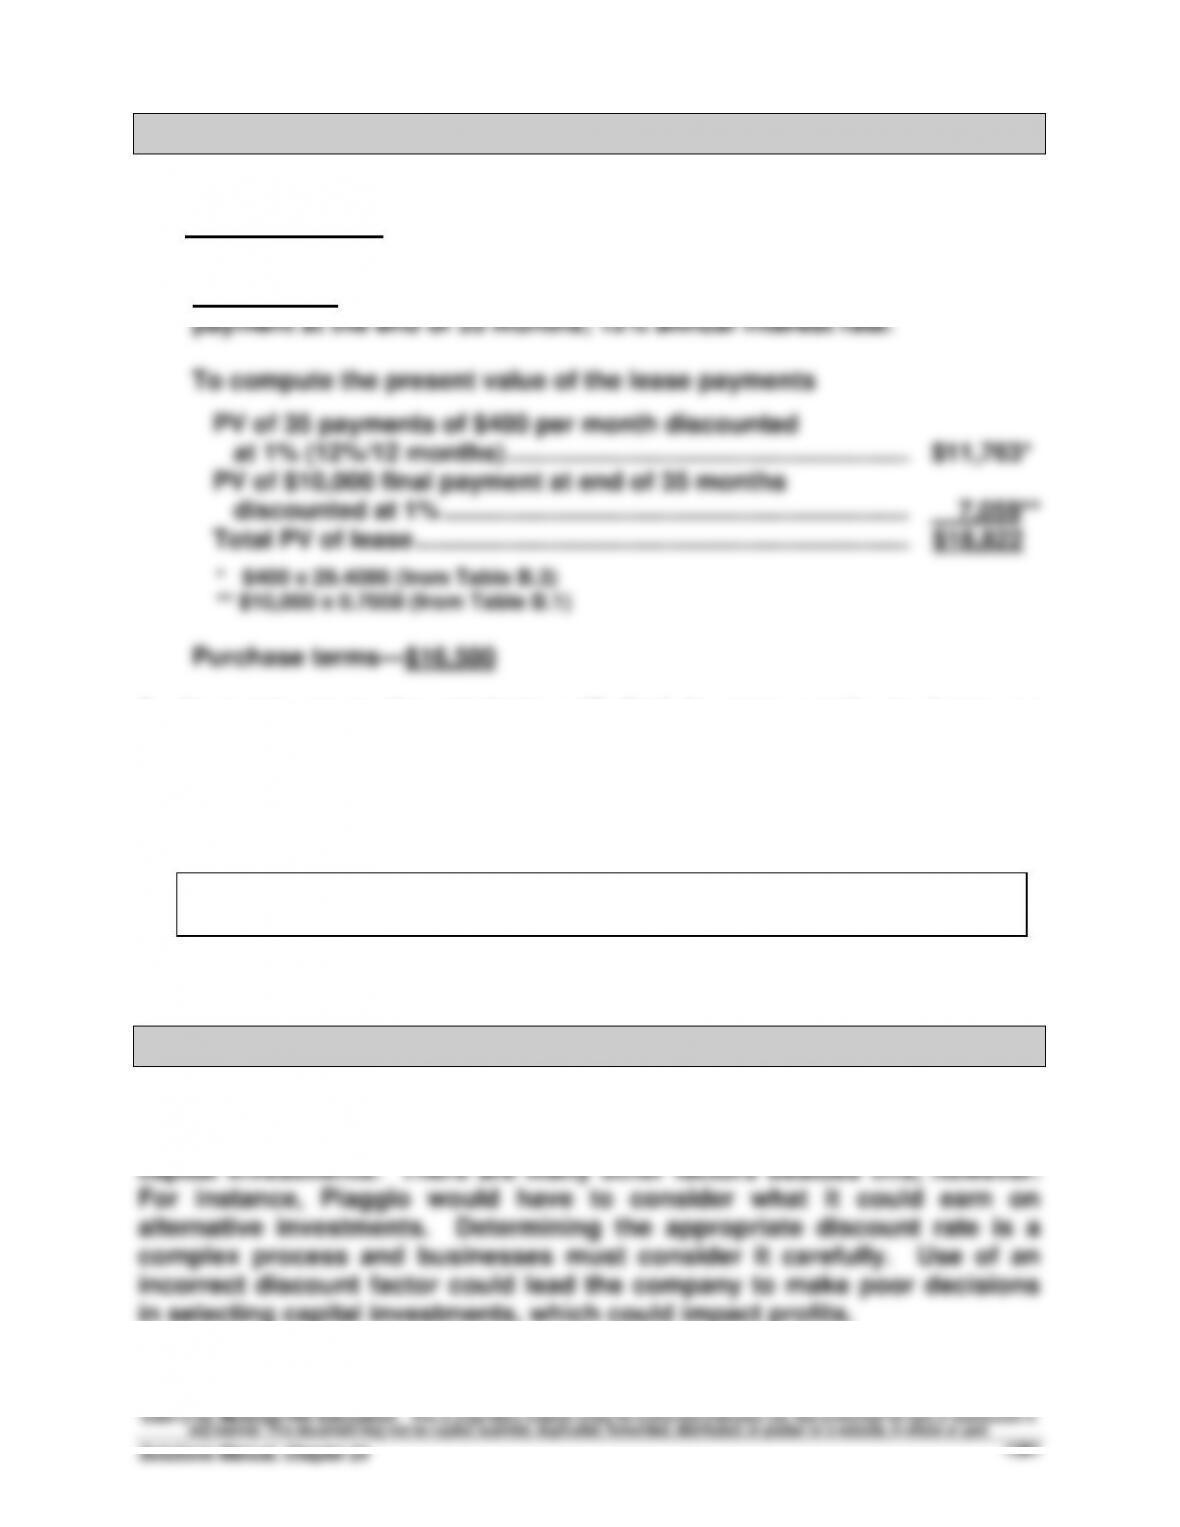
Lease terms—$400 per month for 35 months; plus $10,000 final
payment at the end of 35 months; 12% annual interest rate.
To compute the present value of the lease payments
PV of 35 payments of $400 per month discounted
at 1% (12%/12 months) ................................................................
$11,763*
PV of $10,000 final payment at end of 35 months
discounted at 1% ............................................................................
7,059**
Total PV of lease ................................................................................
$18,822
* $400 x 29.4086 (from Table B.3)
** $10,000 x 0.7059 (from Table B.1)
Purchase terms—$16,500
2. In most cases the students will find it more costly to lease an
automobile than to purchase it outright. Also, getting the salesperson
to negotiate the outright purchase of the automobile is sometimes
challenging once you’ve shown interest in leasing. This is because of
the usually higher profit margin associated with leasing.
Using the sample numbers from part 1, the PV of the lease is $18,822,
which is $2,322 more than the outright purchase price of $16,500.
Global Decision — BTN 24-9
Piaggio would probably use the 6.5% interest rate as one factor in
determining the discount rate to use in evaluating the cash flows from any
in selecting capital investments, which could impact profits.

©2013 by McGraw-Hill Education. This is proprietary material solely for authorized instructor use. Not authorized for sale or distribution in
any manner. This document may not be copied, scanned, duplicated, forwarded, distributed, or posted on a website, in whole or part.
Financial & Managerial Accounting, 5th Edition
1382


