Problem 24-2A (55 minutes)
Part 1
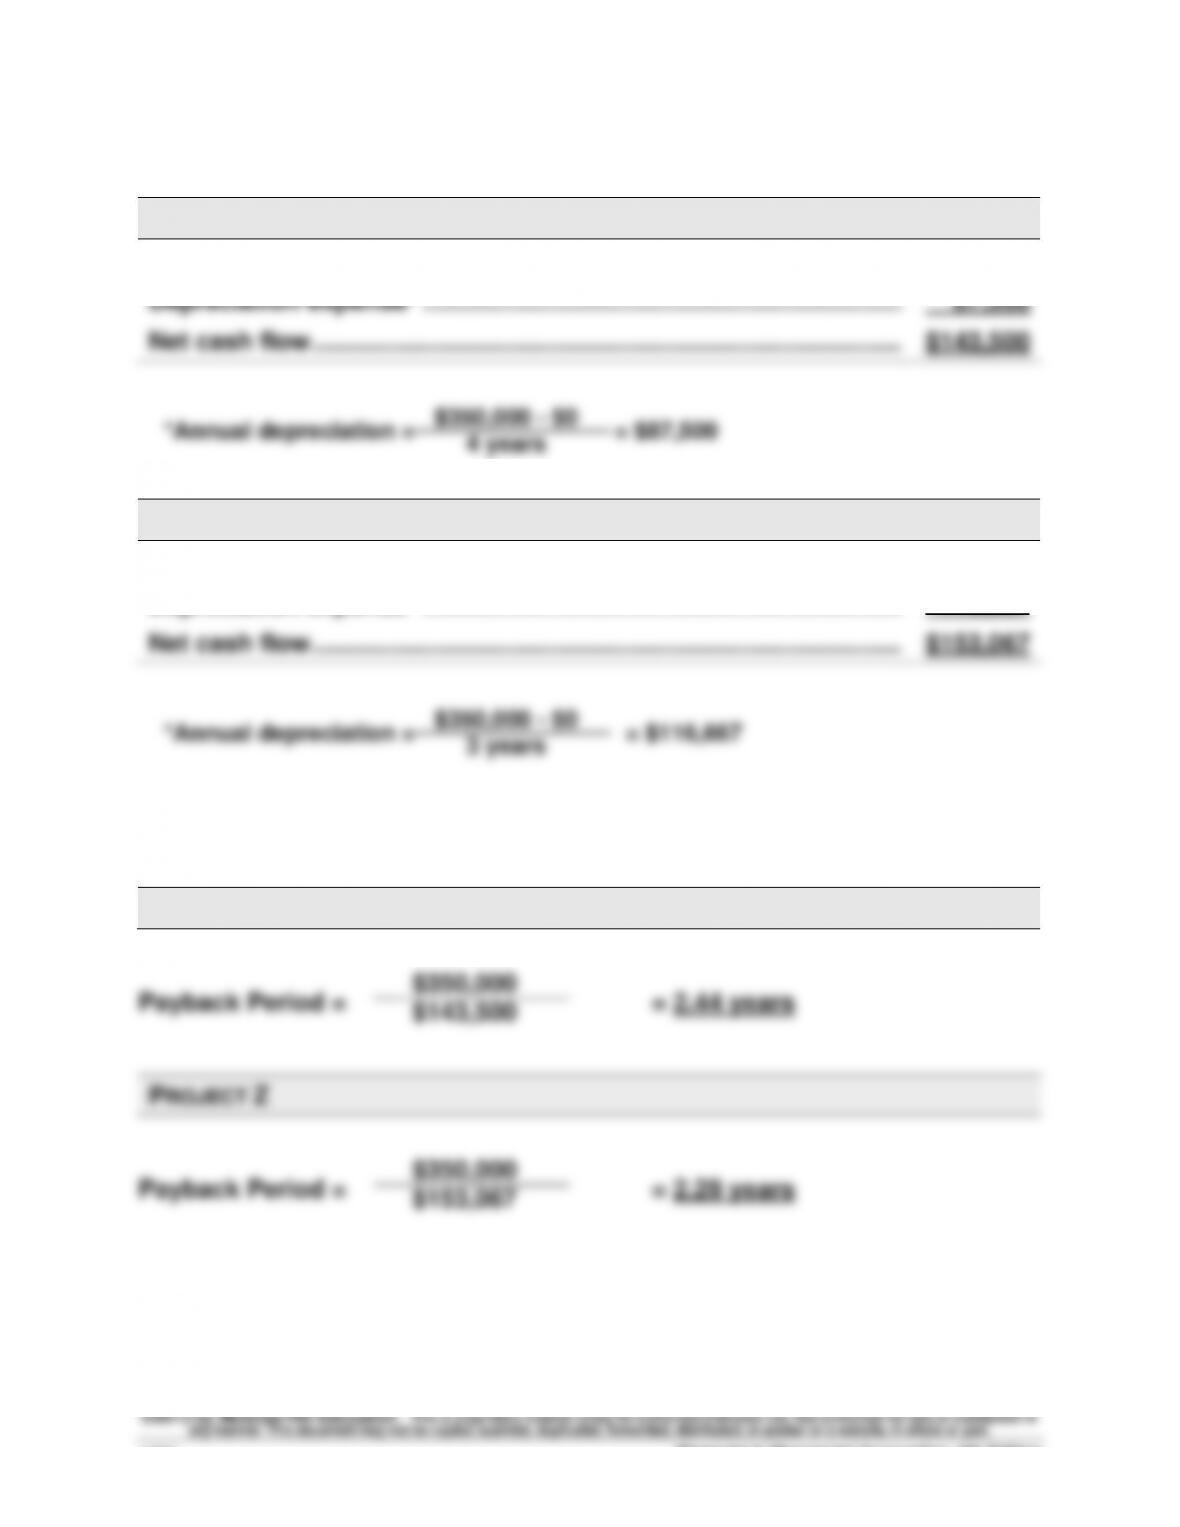
PROJECT Y
Net income ……………………………………………………………………………...
$ 56,000
Depreciation expense* …………………………………………………………….
87,500
Net cash flow …………………………………………………………………………..
$143,500
PROJECT Z
Net income ……………………………………………………………………………...
$ 36,400
Depreciation expense* …………………………………………………………….
116,667
Net cash flow …………………………………………………………………………..
$153,067
3 years
Part 2
PROJECT Y
PROJECT Z
4 years
Problem 24–2A (Continued)
Part 3
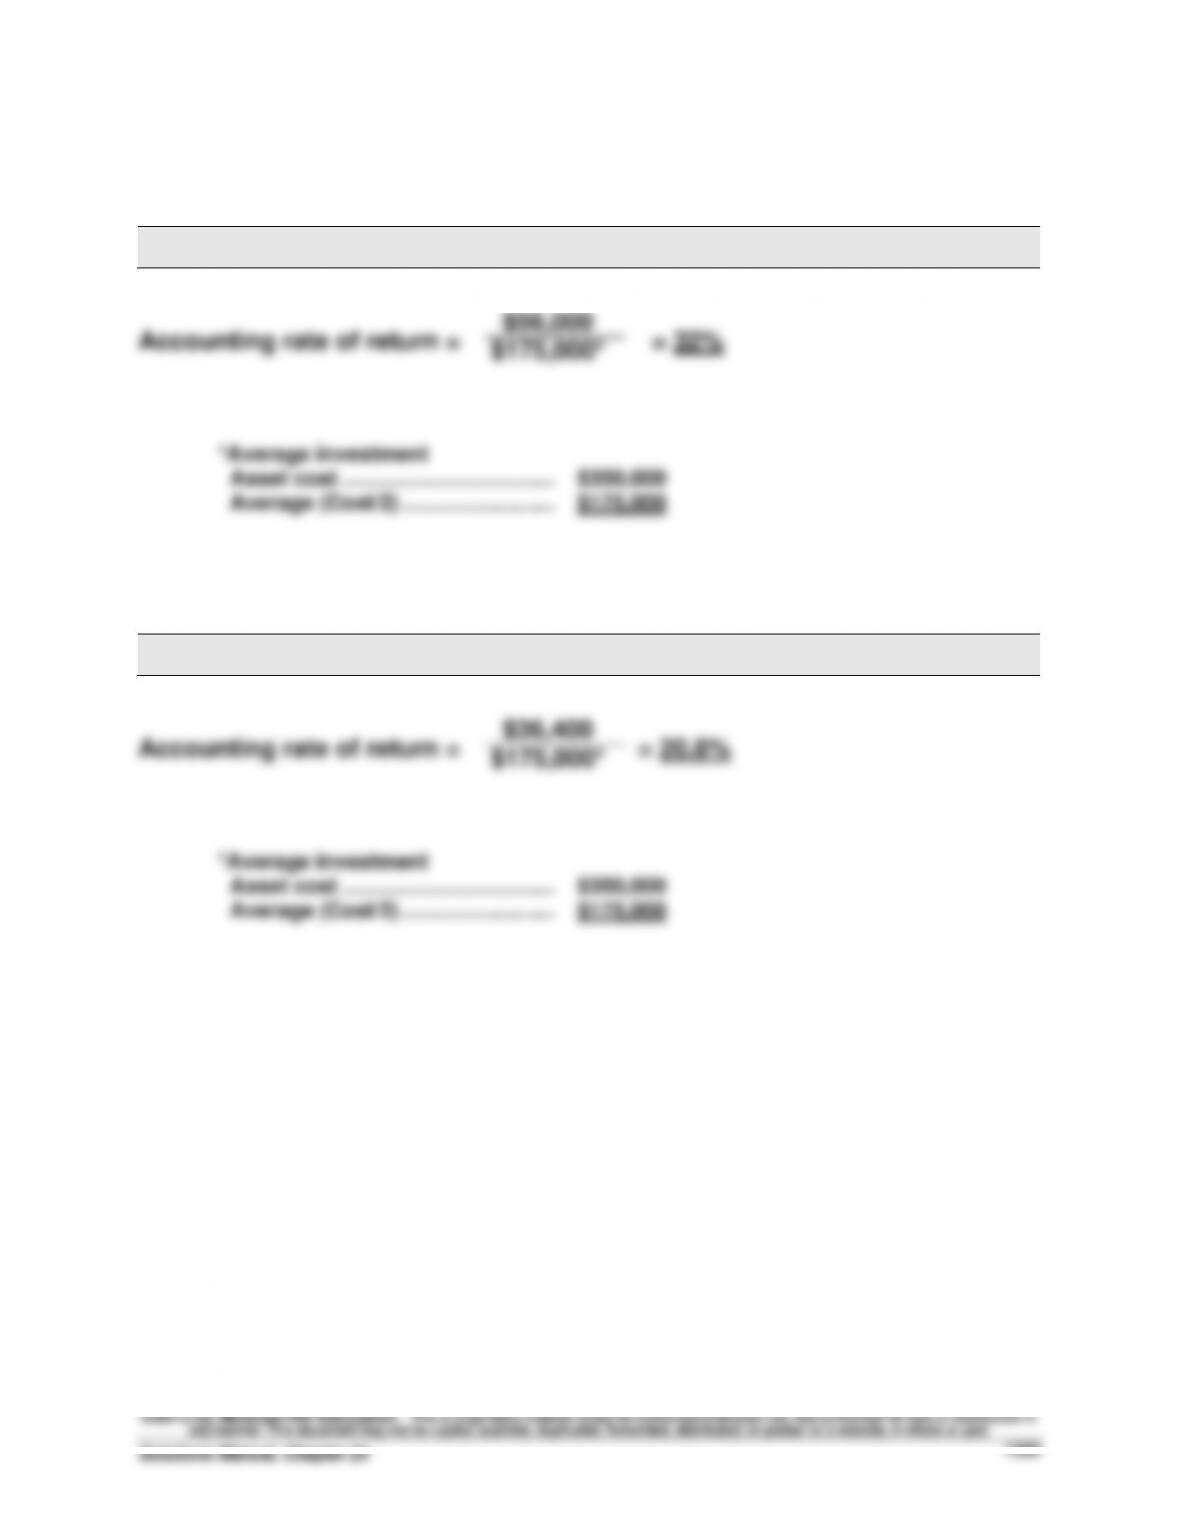
PROJECT Y
PROJECT Z
Financial & Managerial Accounting, 5th Edition
1356
Problem 24–2A (Continued)
Part 4
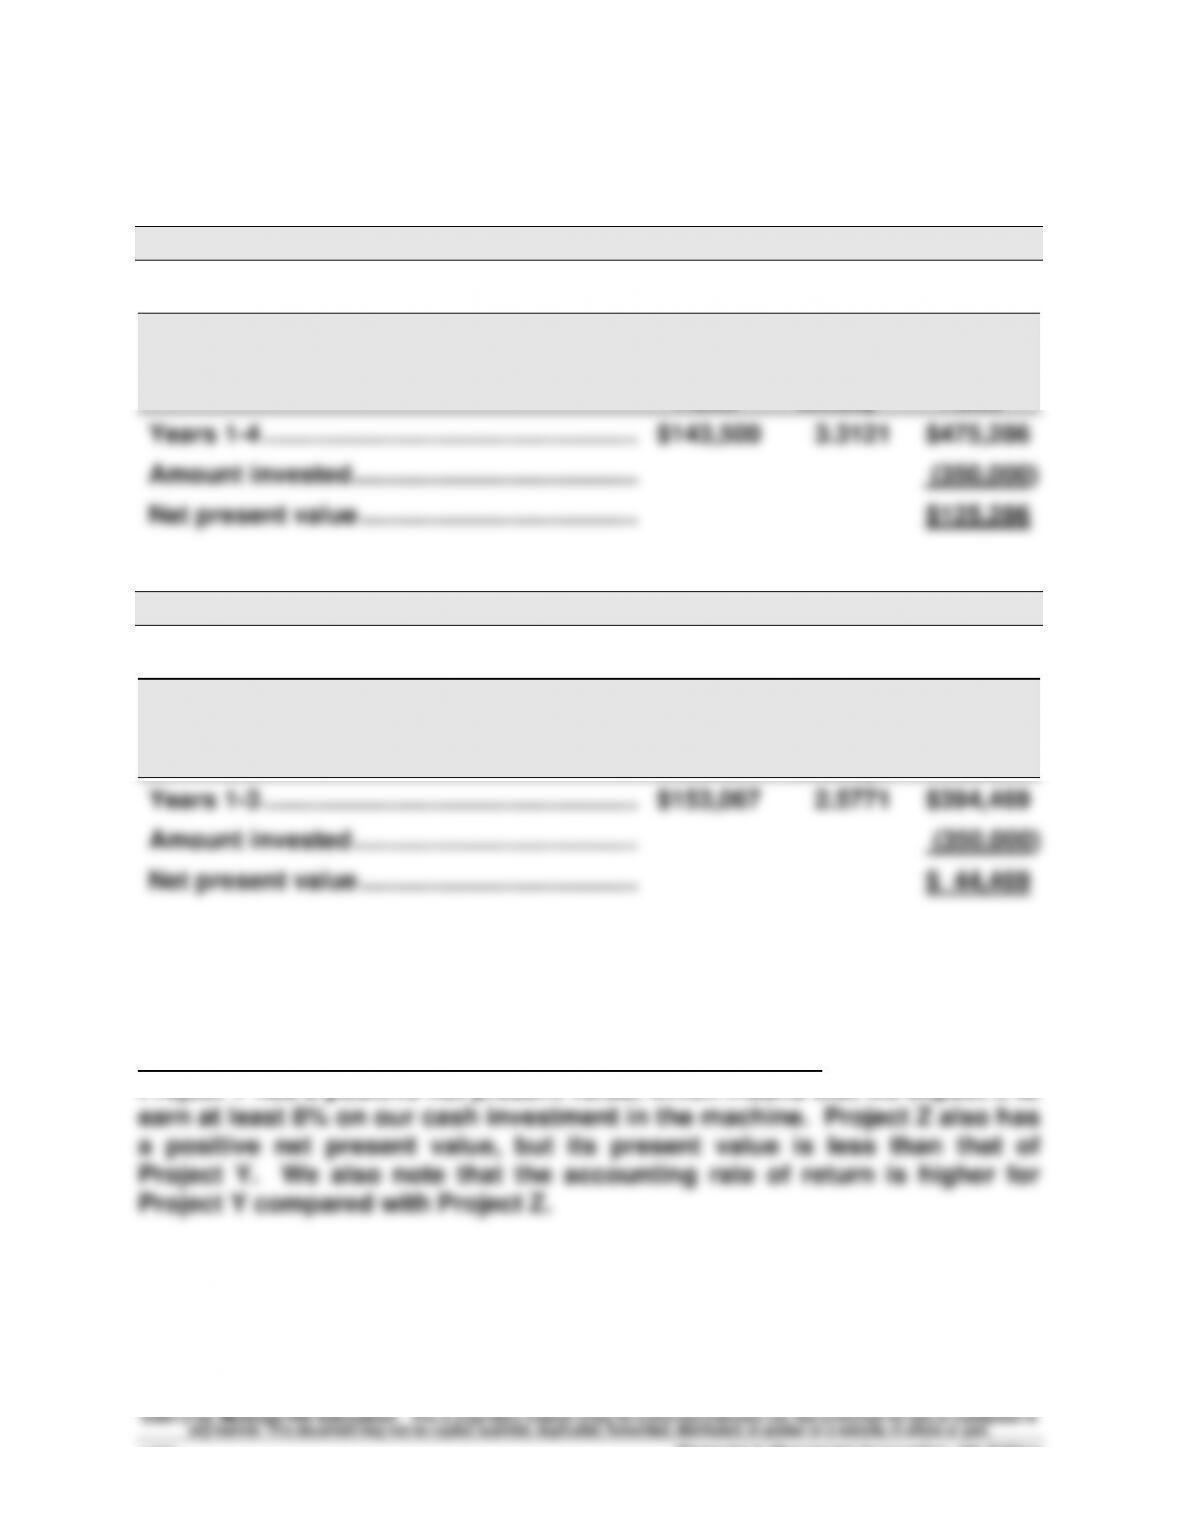
PROJECT Y
Present Value of Net Cash Flows
Present
Present
Value of
Value of
Net Cash
Flows
1 at 8%
Annuity
Net Cash
Flows
Years 1-4 ………………………………………………
$143,500
3.3121
$475,286
Amount invested …………………………………..
(350,000)
Net present value ………………………………….
$125,286
PROJECT Z
Present Value of Net Cash Flows
Present
Present
Value of
Value of
Net Cash
Flows
1 at 8%
Annuity
Net Cash
Flows
Years 1-3 ………………………………………………
$153,067
2.5771
$394,469
Amount invested …………………………………..
(350,000)
Net present value ………………………………….
$ 44,469
Part 5
Recommendation to management is to pursue Project Y. This is because
Project Y has a positive net present value, which means that we expect it to
Problem 24-3A (60 minutes)
Part 1
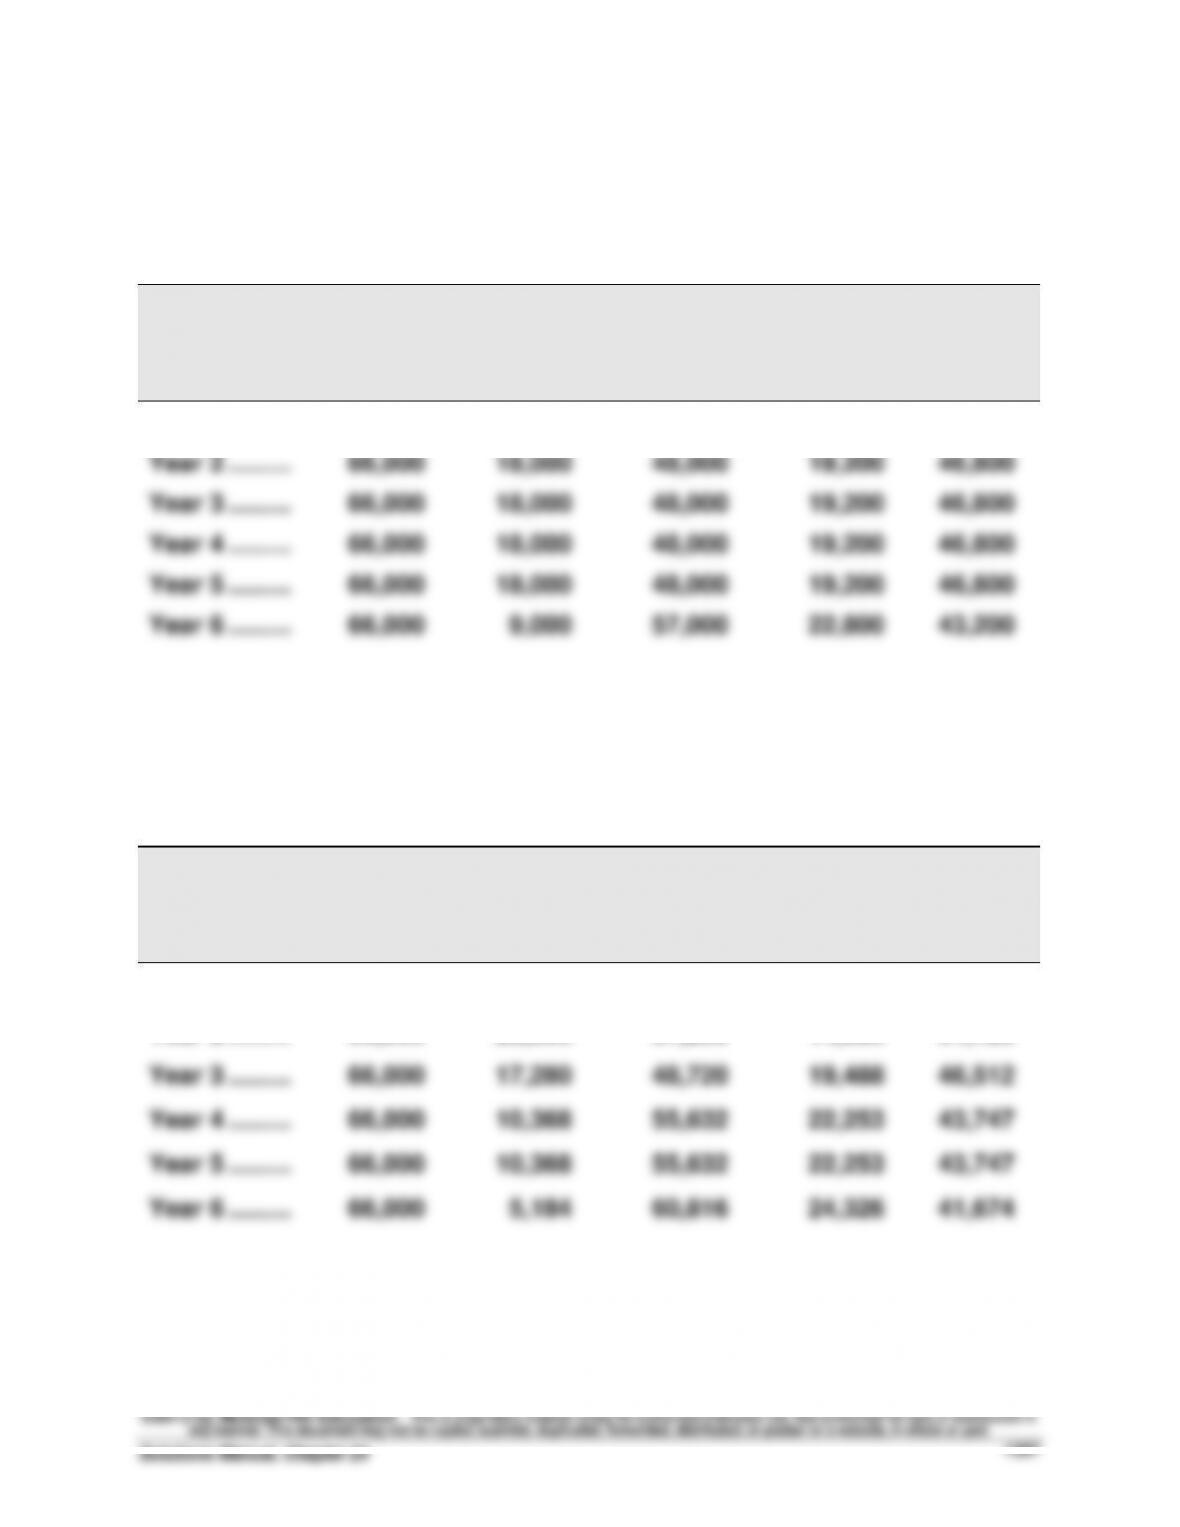
RESULTS USING STRAIGHT-LINE DEPRECIATION
(a)
Income
Before
Deprec.
(b)
Straight–
Line
Deprec.
(c)
Taxable
Income
(a) – (b)
(d)
40%
Income
Taxes
(e)
Net Cash
Flows
(a) – (d)
Year 1 ……….………………
$66,000
$ 9,000
$57,000
$22,800
$43,200
Year 2 ……….………………
66,000
18,000
48,000
19,200
46,800
Year 3 ……….………………
66,000
18,000
48,000
19,200
46,800
Year 4 ……….………………
66,000
18,000
48,000
19,200
46,800
Year 5 ……….………………
66,000
18,000
48,000
19,200
46,800
Year 6 ……….………………
66,000
9,000
57,000
22,800
43,200
Part 2
RESULTS USING MACRS DEPRECIATION
(a)
Income
Before
Deprec.
(b)
MACRS
Deprec.
(c)
Taxable
Income
(a) – (b)
(d)
40%
Income
Taxes
(e)
Net Cash
Flows
(a) – (d)
Year 1 ……….………………
$66,000
$18,000
$48,000
$19,200
$46,800
Year 2 ……….………………
66,000
28,800
37,200
14,880
51,120
Year 3 ……….………………
66,000
17,280
48,720
19,488
46,512
Year 4 ……….………………
66,000
10,368
55,632
22,253
43,747
Year 5 ……….………………
66,000
10,368
55,632
22,253
43,747
Year 6 ……….………………
66,000
5,184
60,816
24,326
41,674
Financial & Managerial Accounting, 5th Edition
1358
Problem 24–3A (Continued)
Part 3
NET PRESENT VALUE OF ASSET USING STRAIGHT-LINE DEPRECIATION
Present
Present
Value of
Net Cash
Flows
Value of
1 at 10%
Net Cash
Flows
Year 1 ………………………………………………….
$ 43,200
0.9091
$ 39,273
Year 2 ………………………………………………….
46,800
0.8264
38,676
Year 3 ………………………………………………….
46,800
0.7513
35,161
Year 4 ………………………………………………….
46,800
0.6830
31,964
Year 5 ………………………………………………….
46,800
0.6209
29,058
Year 6 ………………………………………………….
43,200
0.5645
24,386
Totals ………………………………………………….
$273,600
198,518
Amount invested ………………………………….
(90,000)
Net present value …………………………………
$108,518
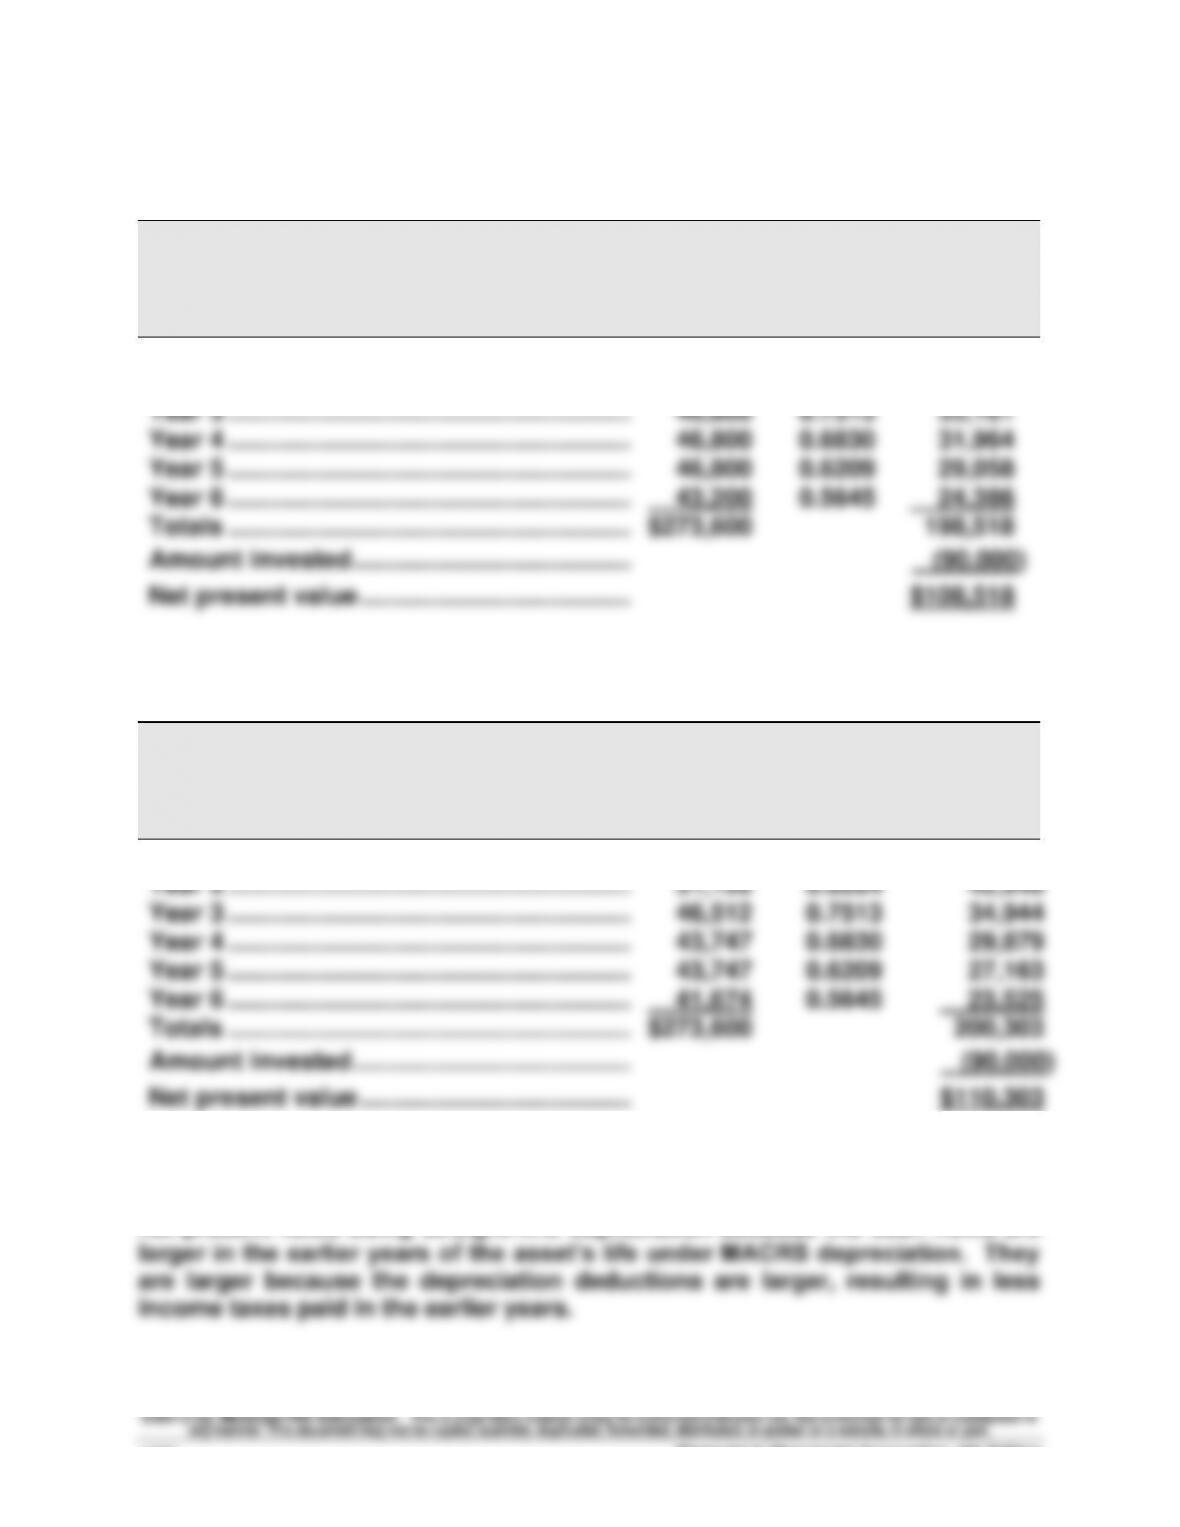
Part 4
NET PRESENT VALUE OF ASSET USING MACRS DEPRECIATION
Present
Present
Value of
Net Cash
Flows
Value of
1 at 10%
Net Cash
Flows
Year 1 ………………………………………………….
$ 46,800
0.9091
$ 42,546
Year 2 ………………………………………………….
51,120
0.8264
42,246
Year 3 ………………………………………………….
46,512
0.7513
34,944
Year 4 ………………………………………………….
43,747
0.6830
29,879
Year 5 ………………………………………………….
43,747
0.6209
27,163
Year 6 ………………………………………………….
41,674
0.5645
23,525
Totals ………………………………………………….
$273,600
200,303
Amount invested ………………………………….
(90,000)
Net present value …………………………………
$110,303
Part 5
Analysis: The net present value using MACRS depreciation is greater than the
net present value using straight-line depreciation because the cash flows are
Problem 24-4A (45 minutes)
Part 1
Alternative 1: Keep the old machine and have it overhauled
Item
Period
Cash
Flow
Present
Value Factor
at 10%
Present
Value of
Cash Flows
Revenues …………………………..
1 – 5
$95,000
3.7908
$360,126
Operating costs ………………….
1 – 5
(42,000)
3.7908
(159,214)
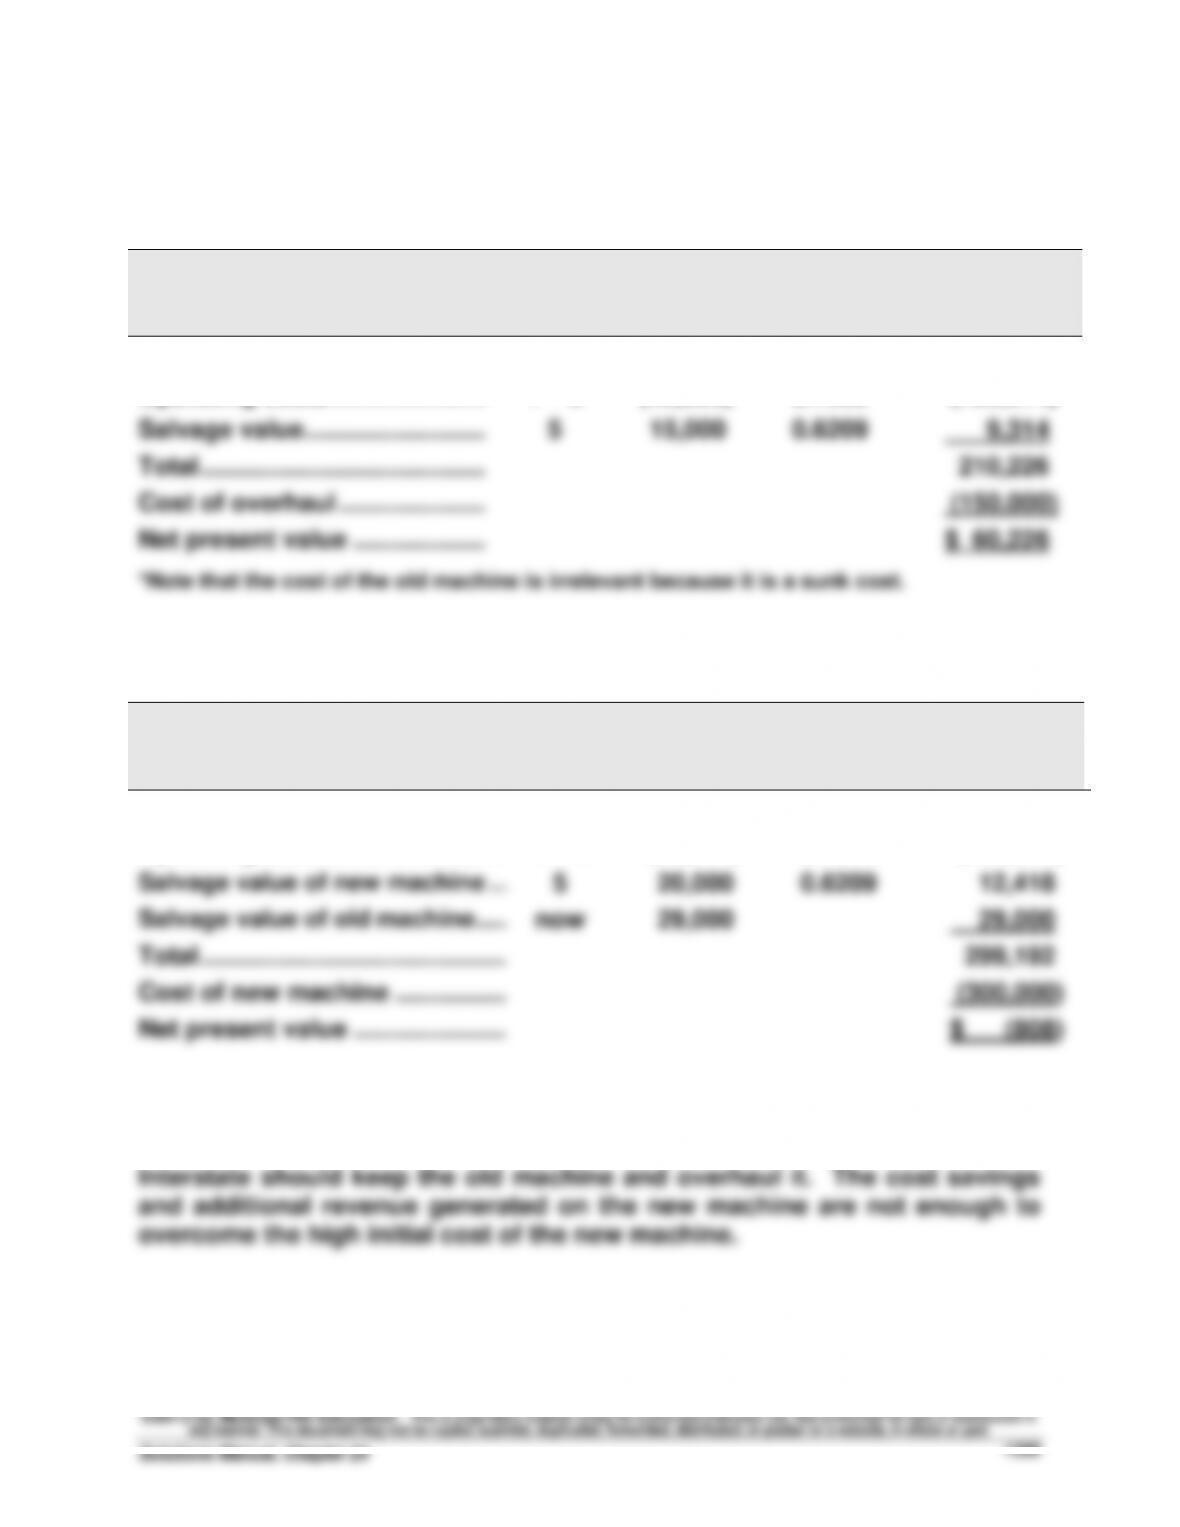
Salvage value ……………………..
5
15,000
0.6209
9,314
Total …………………………………..
210,226
Cost of overhaul …………………
(150,000)
Net present value ……………….
$ 60,226
Part 2
Alternative 2: Sell the old machine and buy a new one
Item
Period
Cash
Flow
Present
Value Factor
at 10%
Present
Value of
Cash Flows
Revenues ……………………………..…….
1 – 5
$100,000
3.7908
$379,080
Operating costs …………………….…….
1 – 5
(32,000)
3.7908
(121,306)
Salvage value of new machine ………
5
20,000
0.6209
12,418
Salvage value of old machine …..……
now
29,000
29,000
Total ……………………………………..…….
299,192
Cost of new machine …………….…….
(300,000)
Net present value ………………….…….
$ (808)
Part 3
Financial & Managerial Accounting, 5th Edition
1360
Problem 24-5A (40 minutes)
Part 1: Payback period
Period
Cash flow
Cumulative cash flow
0 ………………………………………………………..…………
$(250,000)
$(250,000)
1 ………………………………………………………..…………
47,000
(203,000)
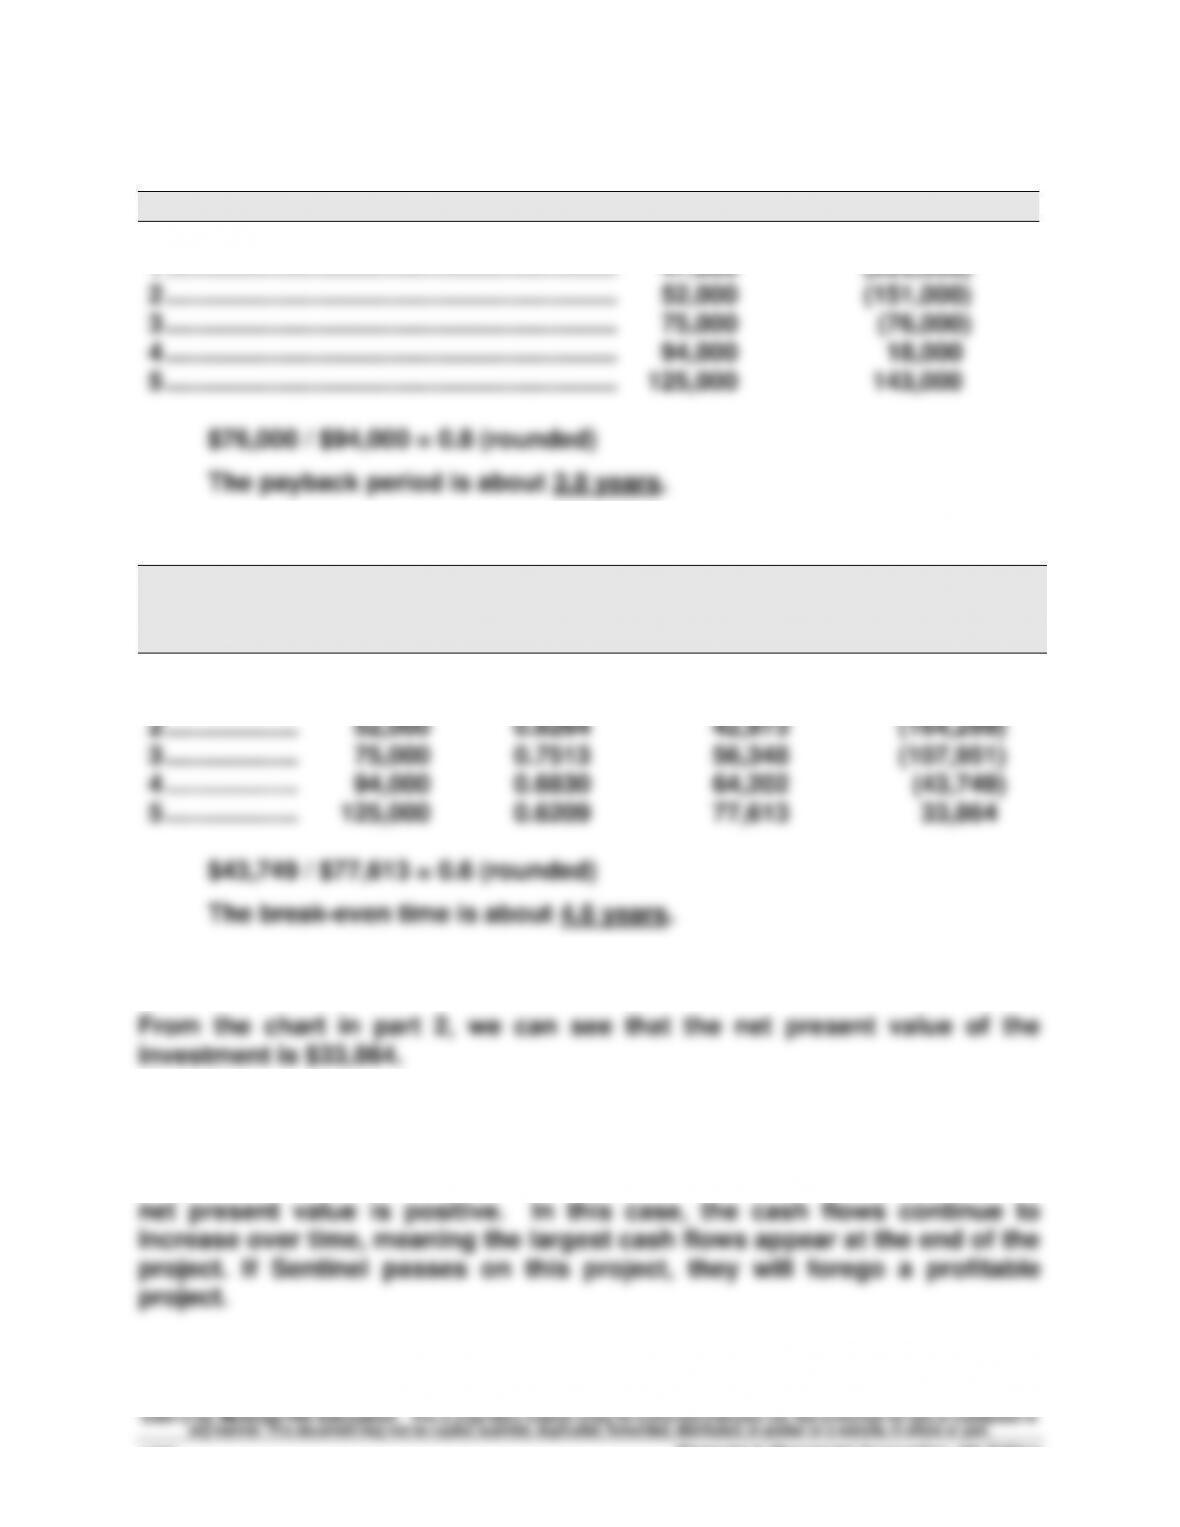
2 ………………………………………………………..…………
52,000
(151,000)
3 ………………………………………………………..…………
75,000
(76,000)
4 ………………………………………………………..…………
94,000
18,000
5 ………………………………………………………..…………
125,000
143,000
$76,000 / $94,000 = 0.8 (rounded)
The payback period is about 3.8 years.
Part 2: Break-even time
Period
Cash Flow
Present Value
of 1 at 10%
Present Value
of Cash Flows
Cumulative
Present Value
of Cash Flows
0 ……………….
$(250,000)
1.0000
$(250,000)
$(250,000)
1 ……………….
47,000
0.9091
42,728
(207,272)
2 ……………….
52,000
0.8264
42,973
(164,299)
3 ……………….
75,000
0.7513
56,348
(107,951)
4 ……………….
94,000
0.6830
64,202
(43,749)
5 ……………….
125,000
0.6209
77,613
33,864
$43,749 / $77,613 = 0.6 (rounded)
The break-even time is about 4.6 years.
Part 3: Net present value
Part 4
If the company requires a payback period of 3 years for any project, this
project fails that test. However, a case could be made for the project as the
Problem 24-6A (40 minutes)
Part 1: Payback period
Period
Cash flow
Cumulative cash flow
0 ………………………………………………………..…………
$(250,000)
$(250,000)
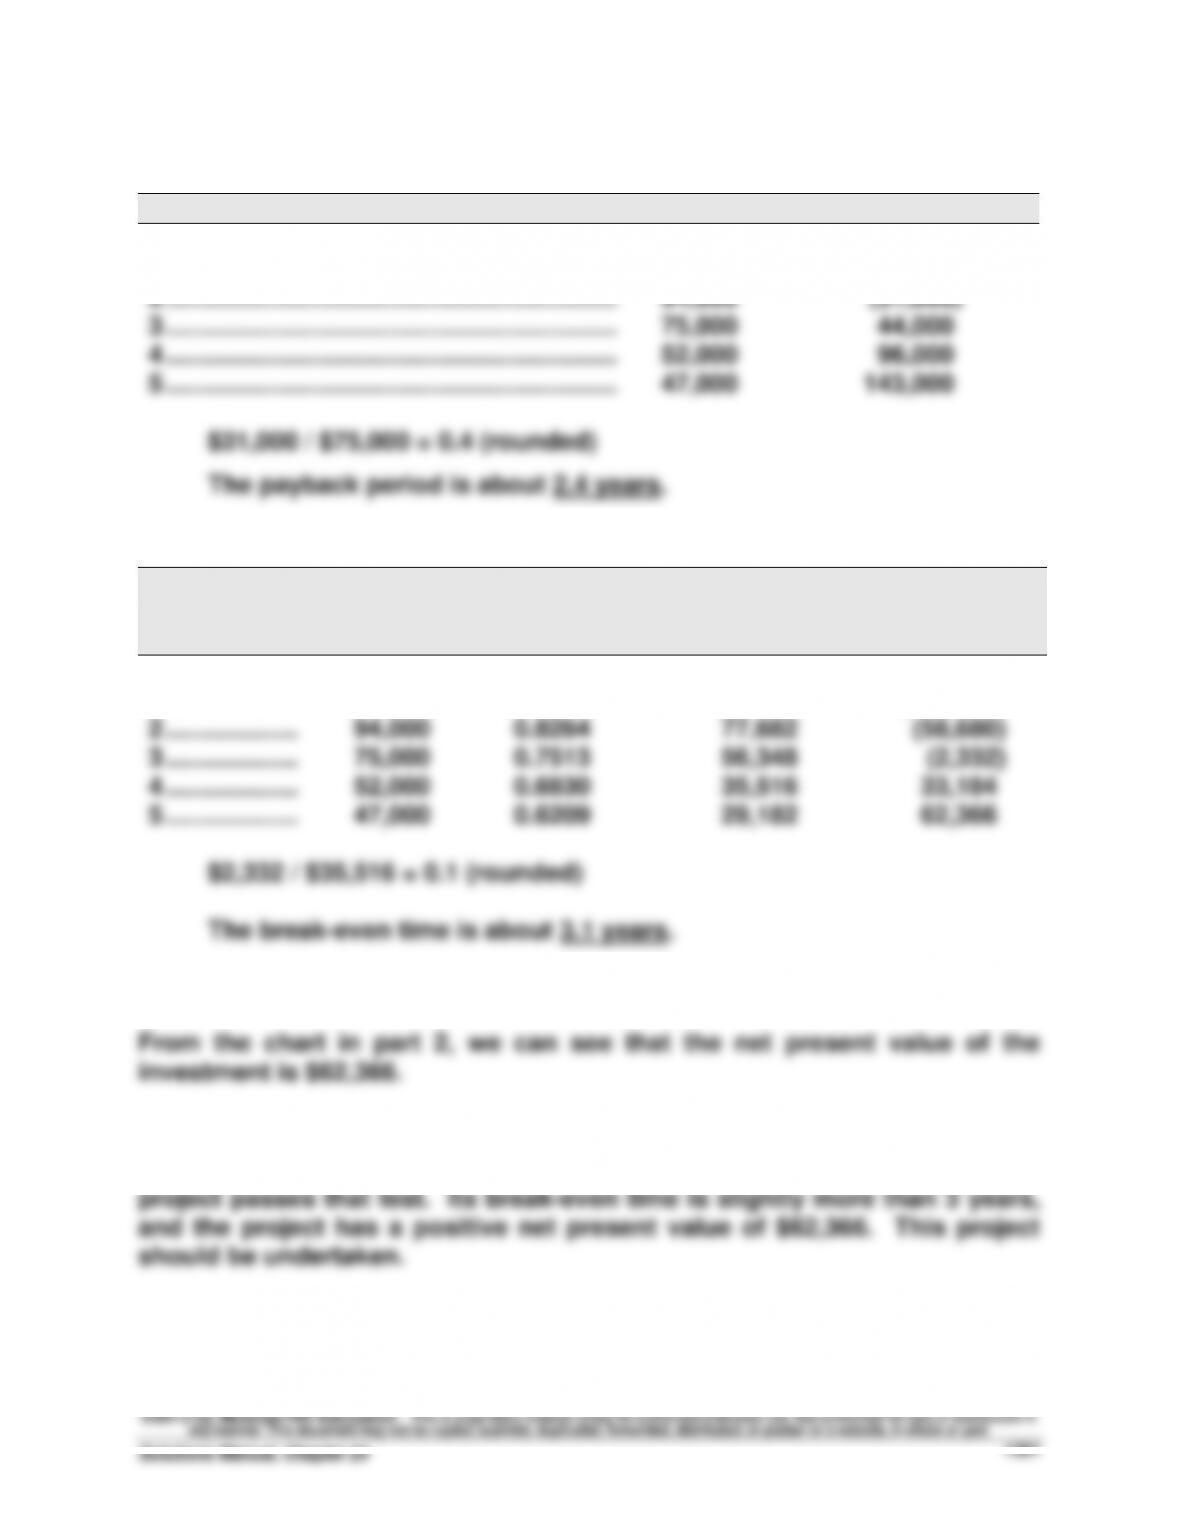
1 ………………………………………………………..…………
125,000
(125,000)
2 ………………………………………………………..…………
94,000
(31,000)
3 ………………………………………………………..…………
75,000
44,000
4 ………………………………………………………..…………
52,000
96,000
5 ………………………………………………………..…………
47,000
143,000
$31,000 / $75,000 = 0.4 (rounded)
The payback period is about 2.4 years.
Part 2: Break-even time
Period
Cash Flow
Present Value
of 1 at 10%
Present Value
of Cash Flows
Cumulative
Present Value
of Cash Flows
0 ……………….
$(250,000)
1.0000
$(250,000)
$(250,000)
1 ……………….
125,000
0.9091
113,638
(136,362)
2 ……………….
94,000
0.8264
77,682
(58,680)
3 ……………….
75,000
0.7513
56,348
(2,332)
4 ……………….
52,000
0.6830
35,516
33,184
5 ……………….
47,000
0.6209
29,182
62,366
$2,332 / $35,516 = 0.1 (rounded)
The break-even time is about 3.1 years.
Part 3: Net present value
Part 4
If the company requires a payback period of 3 years for any project, this
Financial & Managerial Accounting, 5th Edition
1362
Problem 24-6A (Concluded)
Part 5
While the total cash flows are identical to those in Problem 24-5A, the cash
flows are reversed, with the largest cash flows coming in the early years of
PROBLEM SET B
Problem 24-1B (50 minutes)
Part 1
Part 2
Net
Net Cash
Income
Flow
Expected annual sales of new product ………………..…
$1,150,000
$1,150,000
Expected annual costs of new product
Direct materials ………………………………………………..…
300,000
300,000
Direct labor ……………………………………………………….
420,000
420,000
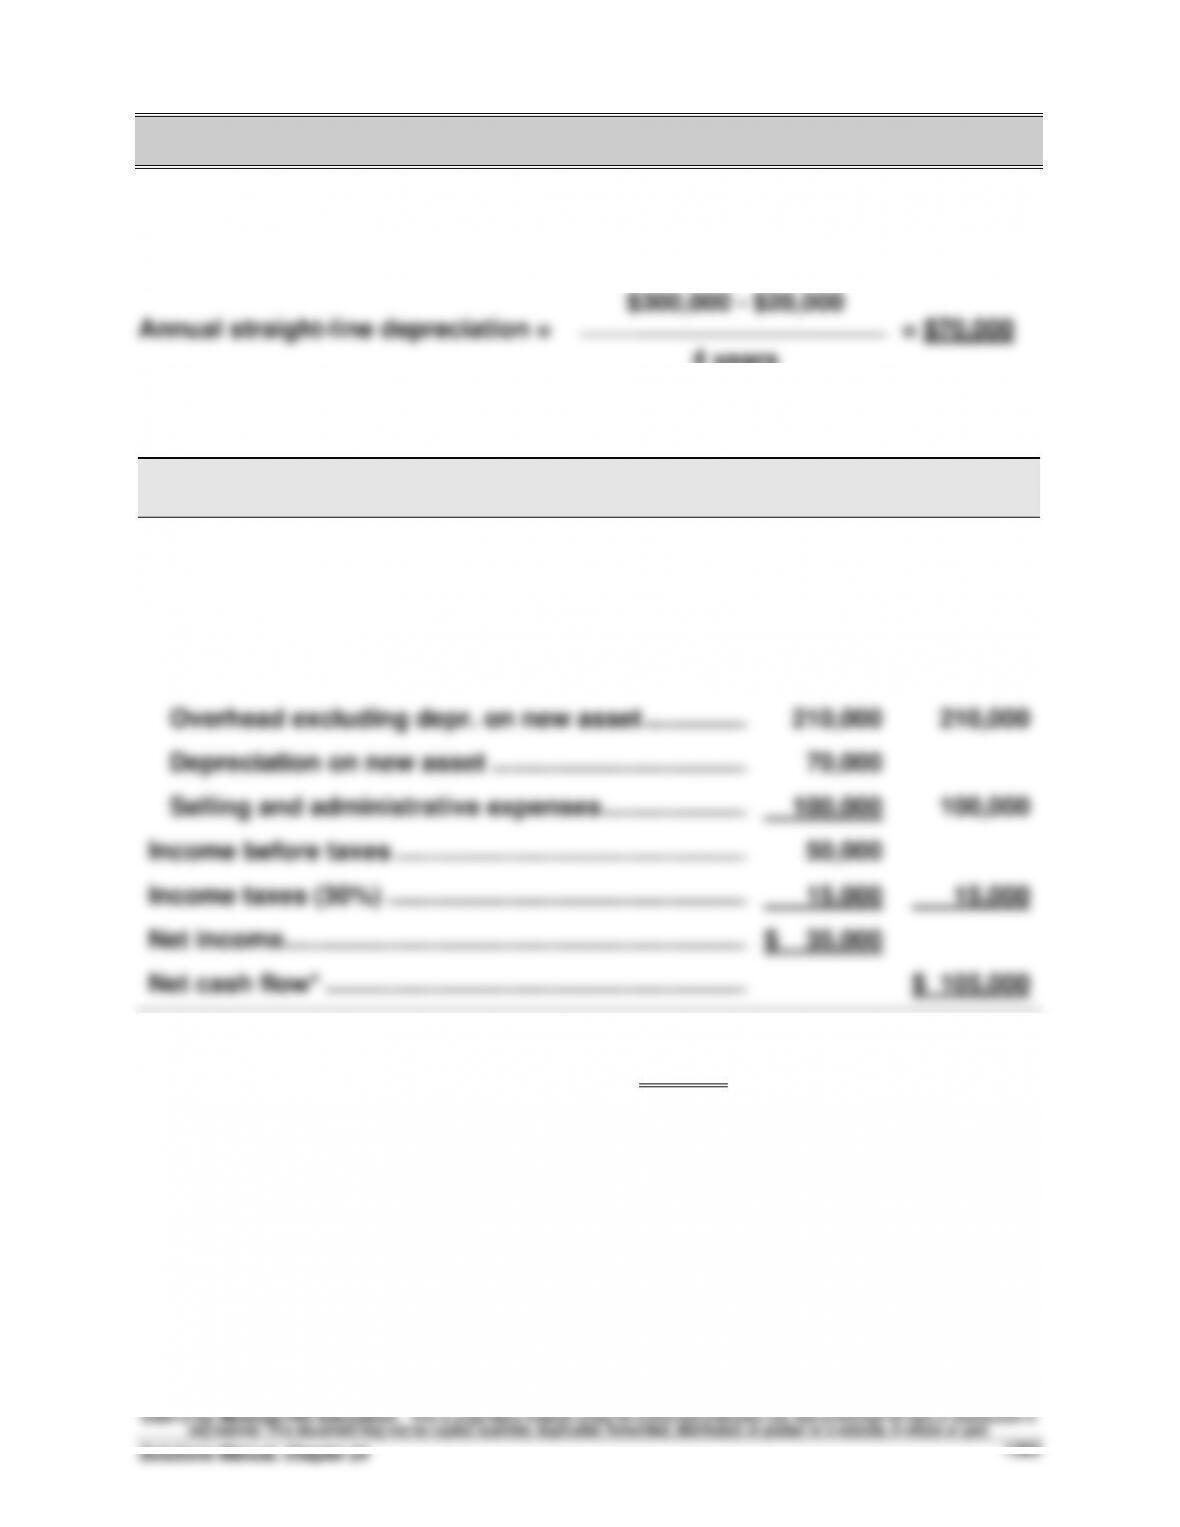
Overhead excluding depr. on new asset ………………
210,000
210,000
Depreciation on new asset ……………………………….…
70,000
Selling and administrative expenses ……………………
100,000
100,000
Income before taxes ………………………………………………
50,000
Income taxes (30%) …………………………………………….…
15,000
15,000
Net income ………………………………………………………….…
$ 35,000
Net cash flow* …………………………………………………….…
$ 105,000
*Alternatively, annual net cash flow can be computed as:
Net income + Depreciation = $35,000 + $70,000 = $105,000
4 years
Financial & Managerial Accounting, 5th Edition
1364
Problem 24-1B (Continued)
Part 3
Part 4
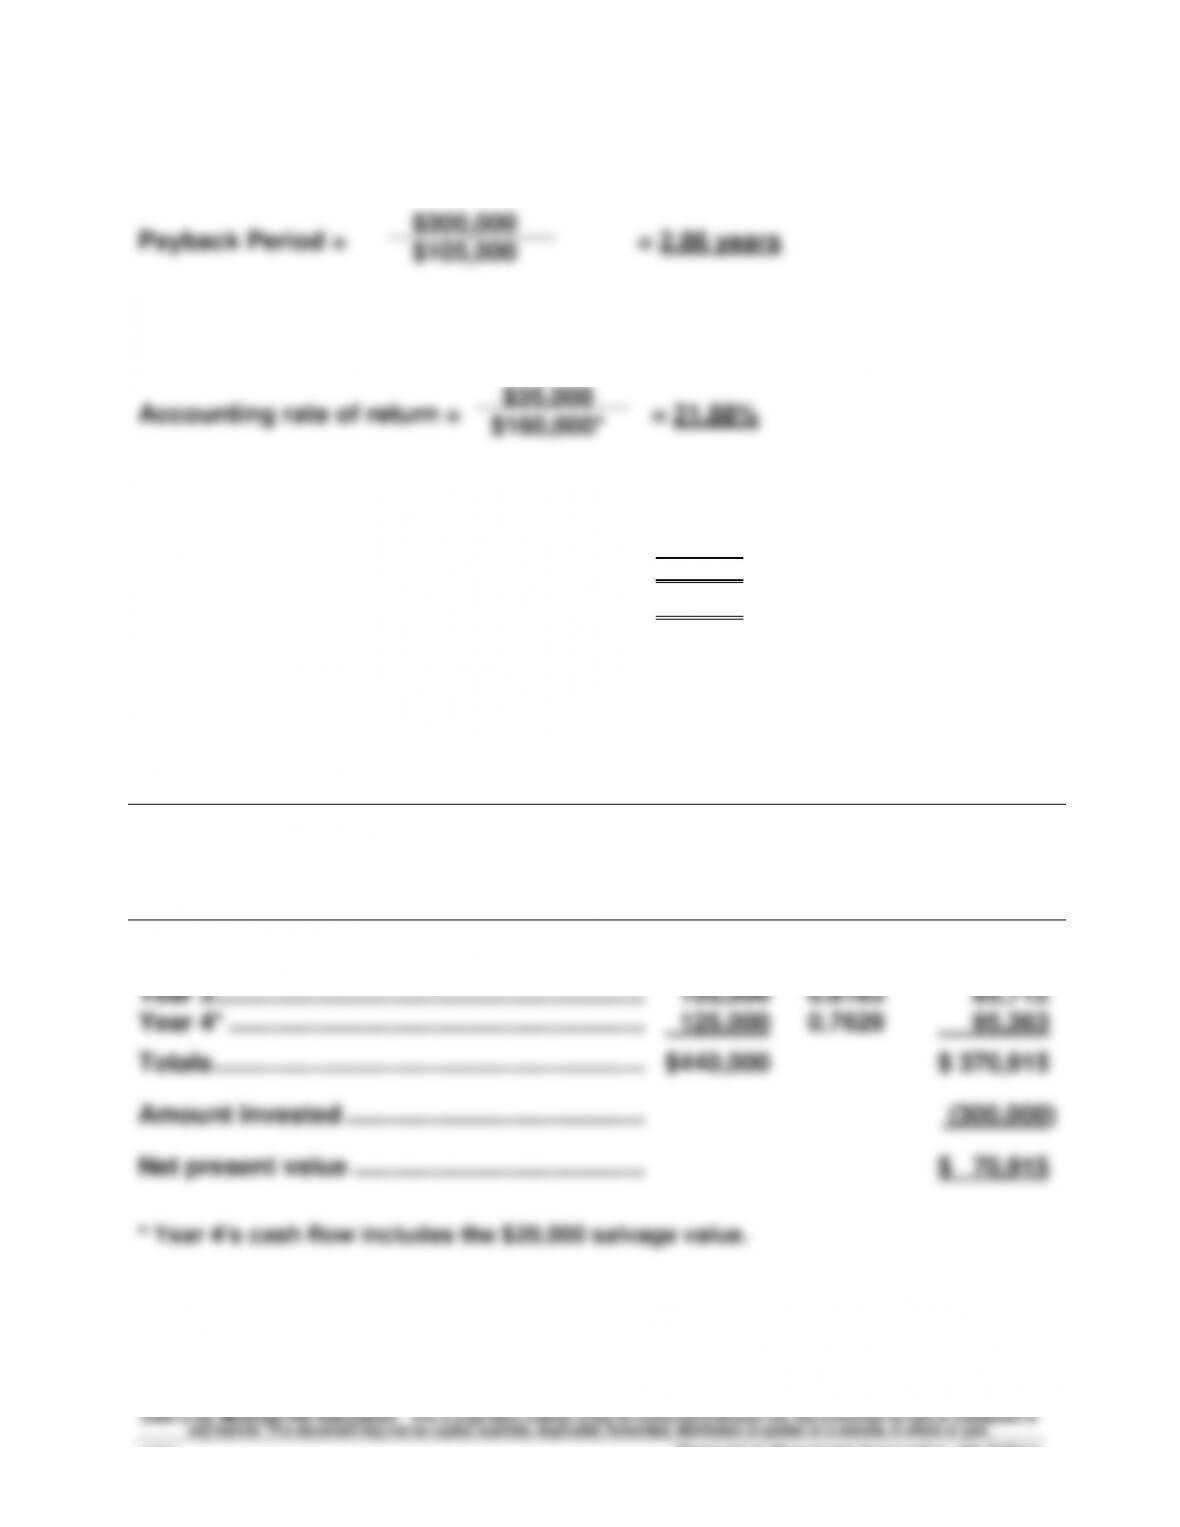
*Average investment
Asset cost …………………………………………………...
$300,000
Final year’s book value ………………………………...
20,000
Sum ……………………………………………………………..
$320,000
Average (Sum /2) ………………………………………....
$160,000
Part 5
Present Value of Net Cash Flows
Present
Present
Value of
Net Cash
Flows
Value of
1 at 7%
Net Cash
Flows
Year 1 ……………………………………………………..
$105,000
0.9346
$ 98,133
Year 2 ……………………………………………………..
105,000
0.8734
91,707
Year 3 ……………………………………………………..
105,000
0.8163
85,712
Year 4* ……………………………………………………
125,000
0.7629
95,363
Totals ……………………………………………………..
$440,000
$ 370,915
Amount invested …………………………………….
(300,000)
Net present value ……………………………………
$ 70,915
* Year 4’s cash flow includes the $20,000 salvage value.
Problem 24-2B (55 minutes)
Part 1
PROJECT A
Net income ………………………………………………………………………………..…
$39,900
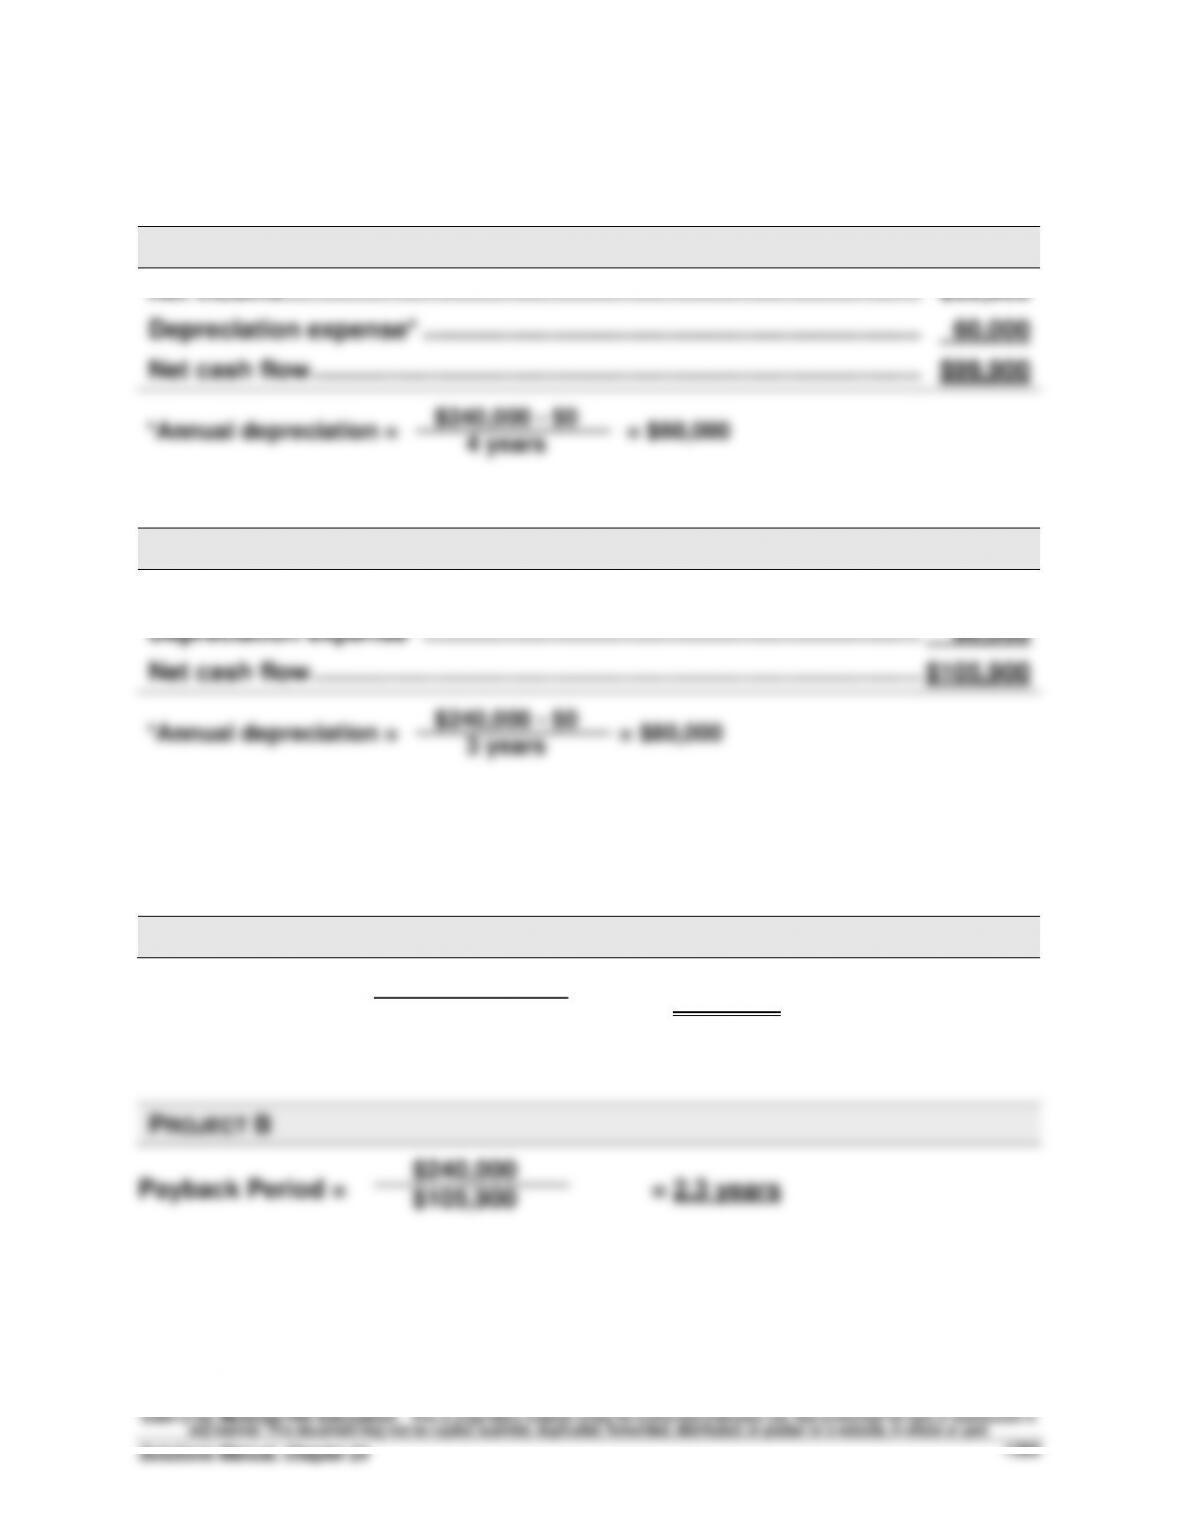
Depreciation expense* …………………………………………………………………
60,000
Net cash flow …………………………………………………………………………….…
$99,900
PROJECT B
Net income ………………………………………………………………………………..…
$ 25,900
Depreciation expense* …………………………………………………………………
80,000
Net cash flow …………………………………………………………………………….…
$105,900
Part 2
PROJECT A
Payback Period = = 2.4 years
$240,000
$105,900
$240,000
$ 99,900
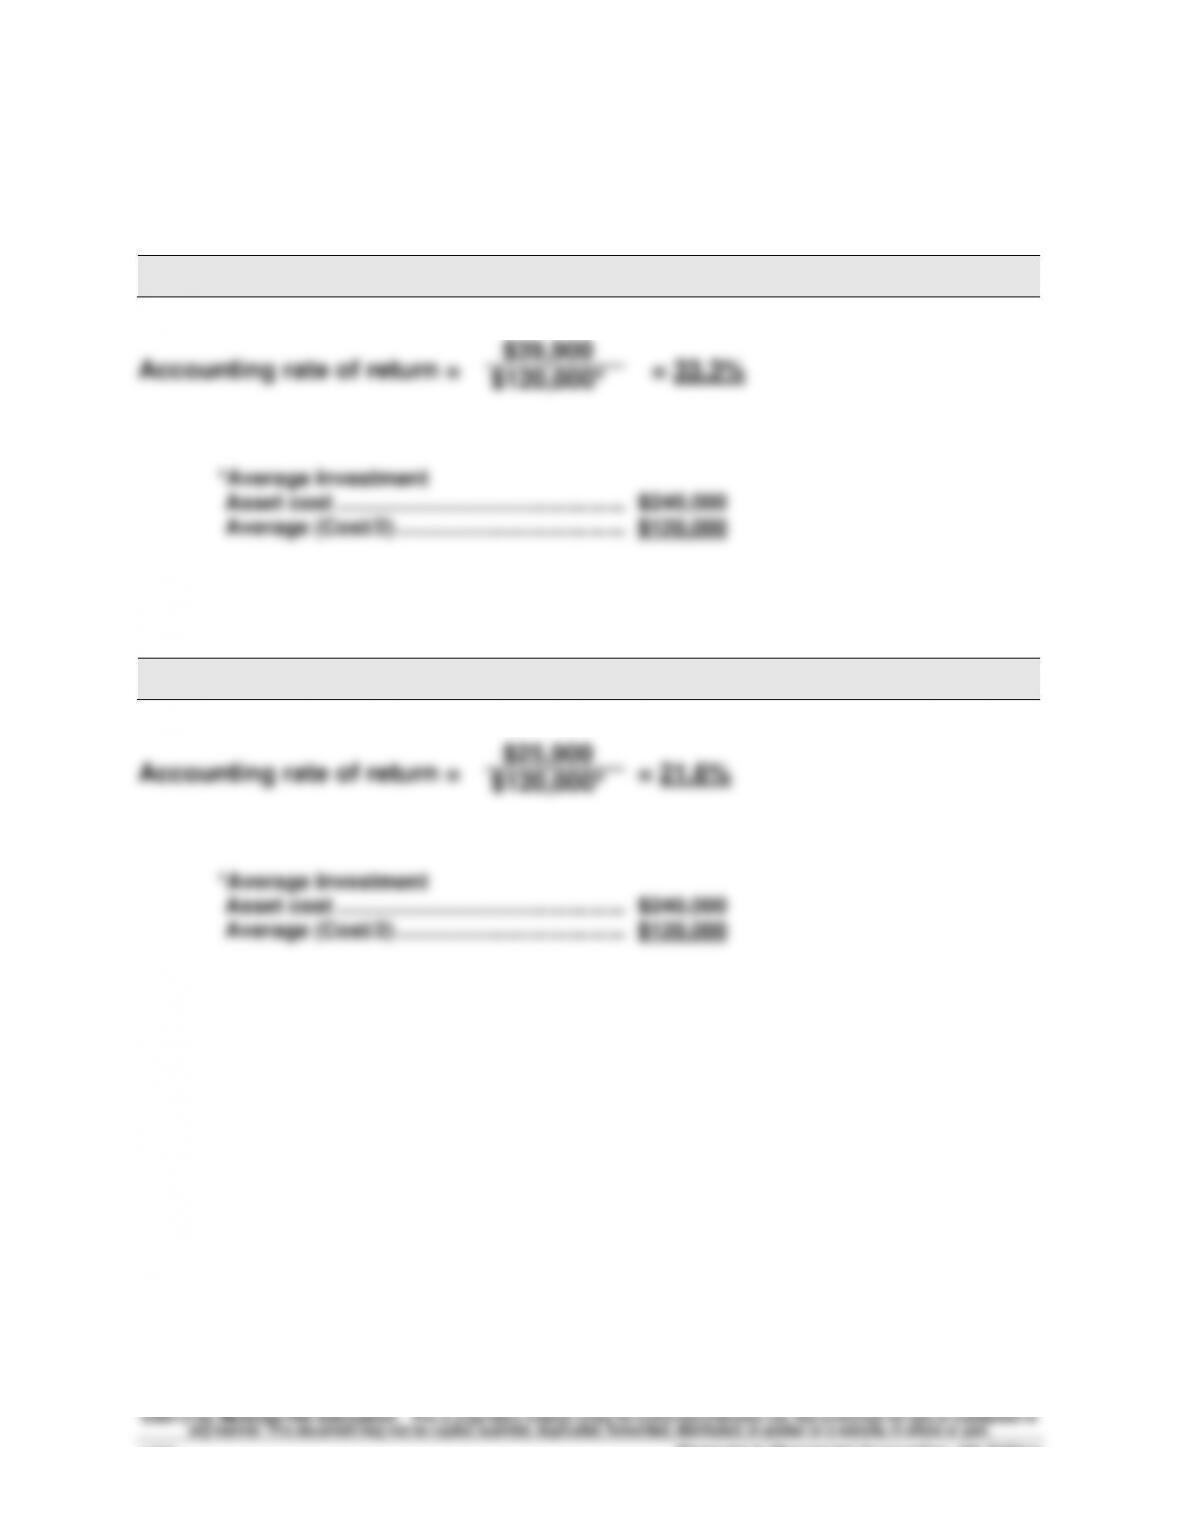
PROJECT B
Problem 24–2B (Continued)
Part 3
PROJECT A
Problem 24-2B (Continued)
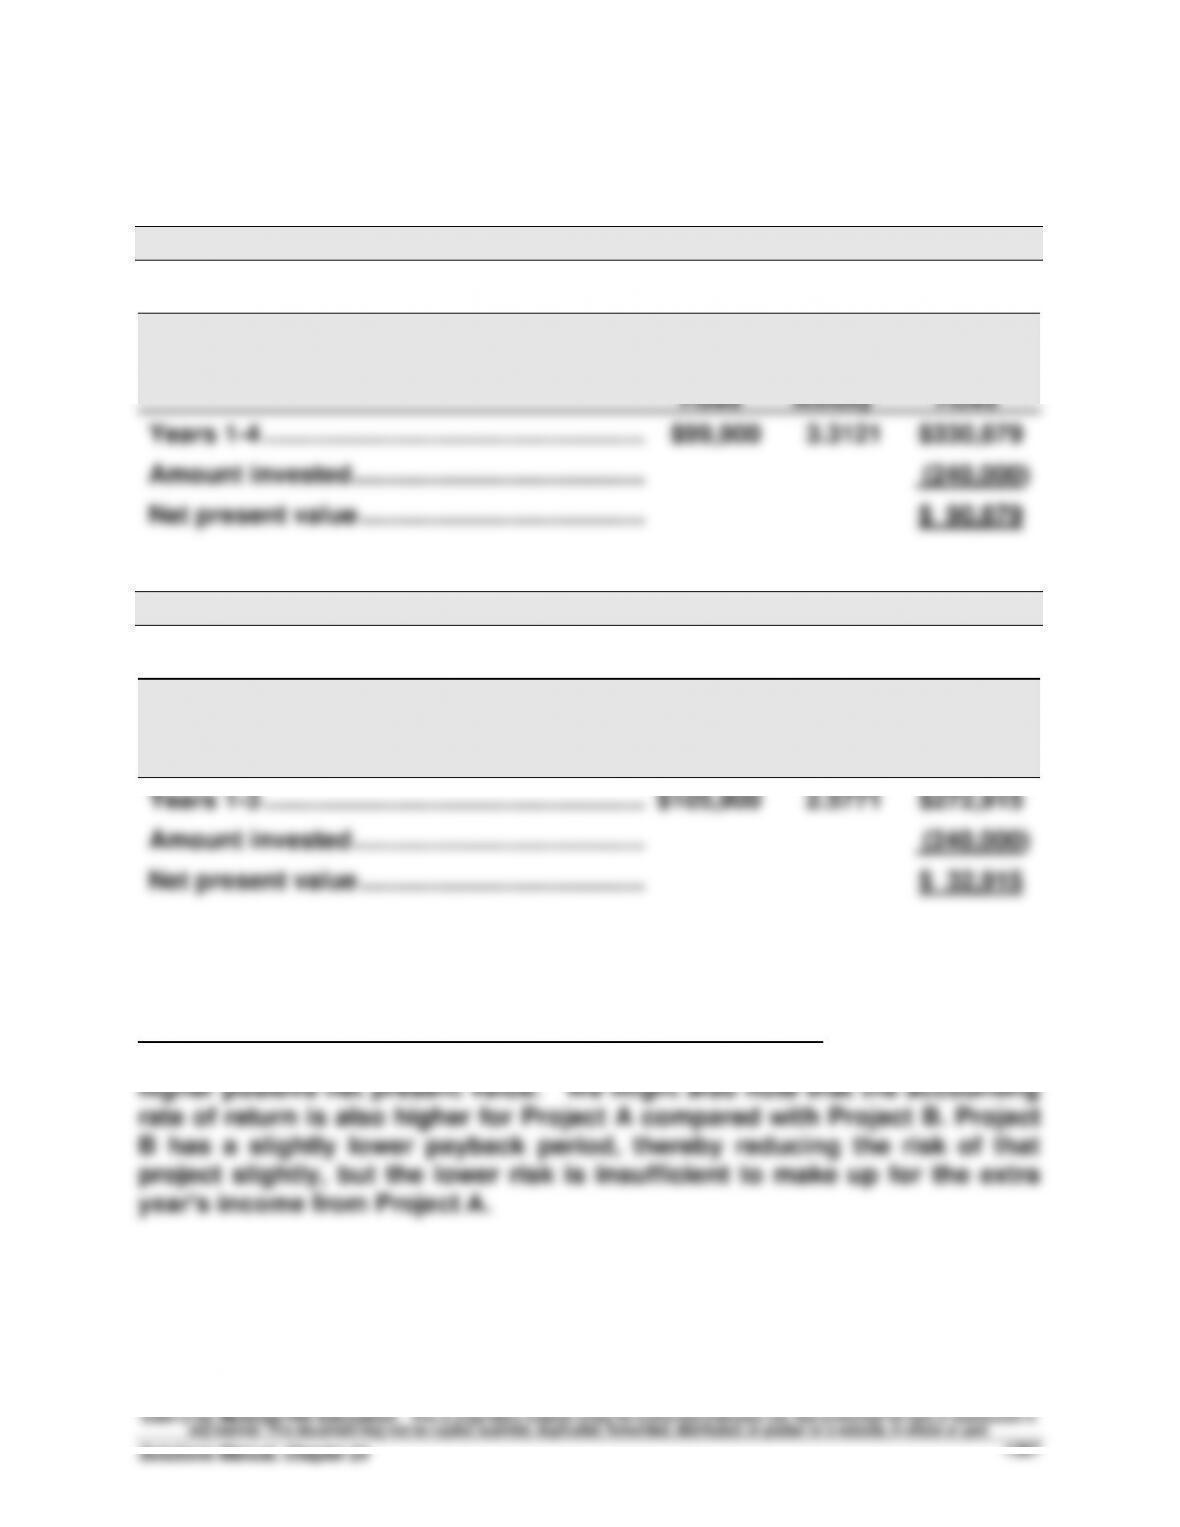
Part 4
PROJECT A
Present Value of Net Cash Flows
Present
Present
Value of
Value of
Net Cash
Flows
1 at 8%
Annuity
Net Cash
Flows
Years 1-4 ……………………………………………….
$99,900
3.3121
$330,879
Amount invested ……………………………………
(240,000)
Net present value …………………………………..
$ 90,879
PROJECT B
Present Value of Net Cash Flows
Present
Present
Value of
Value of
Net Cash
Flows
1 at 8%
Annuity
Net Cash
Flows
Years 1-3 ……………………………………………….
$105,900
2.5771
$272,915
Amount invested ……………………………………
(240,000)
Net present value …………………………………..
$ 32,915
Part 5
Recommendation to management is to pursue Project A. This is because
although both projects have a positive net present value, Project A has a
Financial & Managerial Accounting, 5th Edition
1368
Problem 24-3B (60 minutes)
Part 1
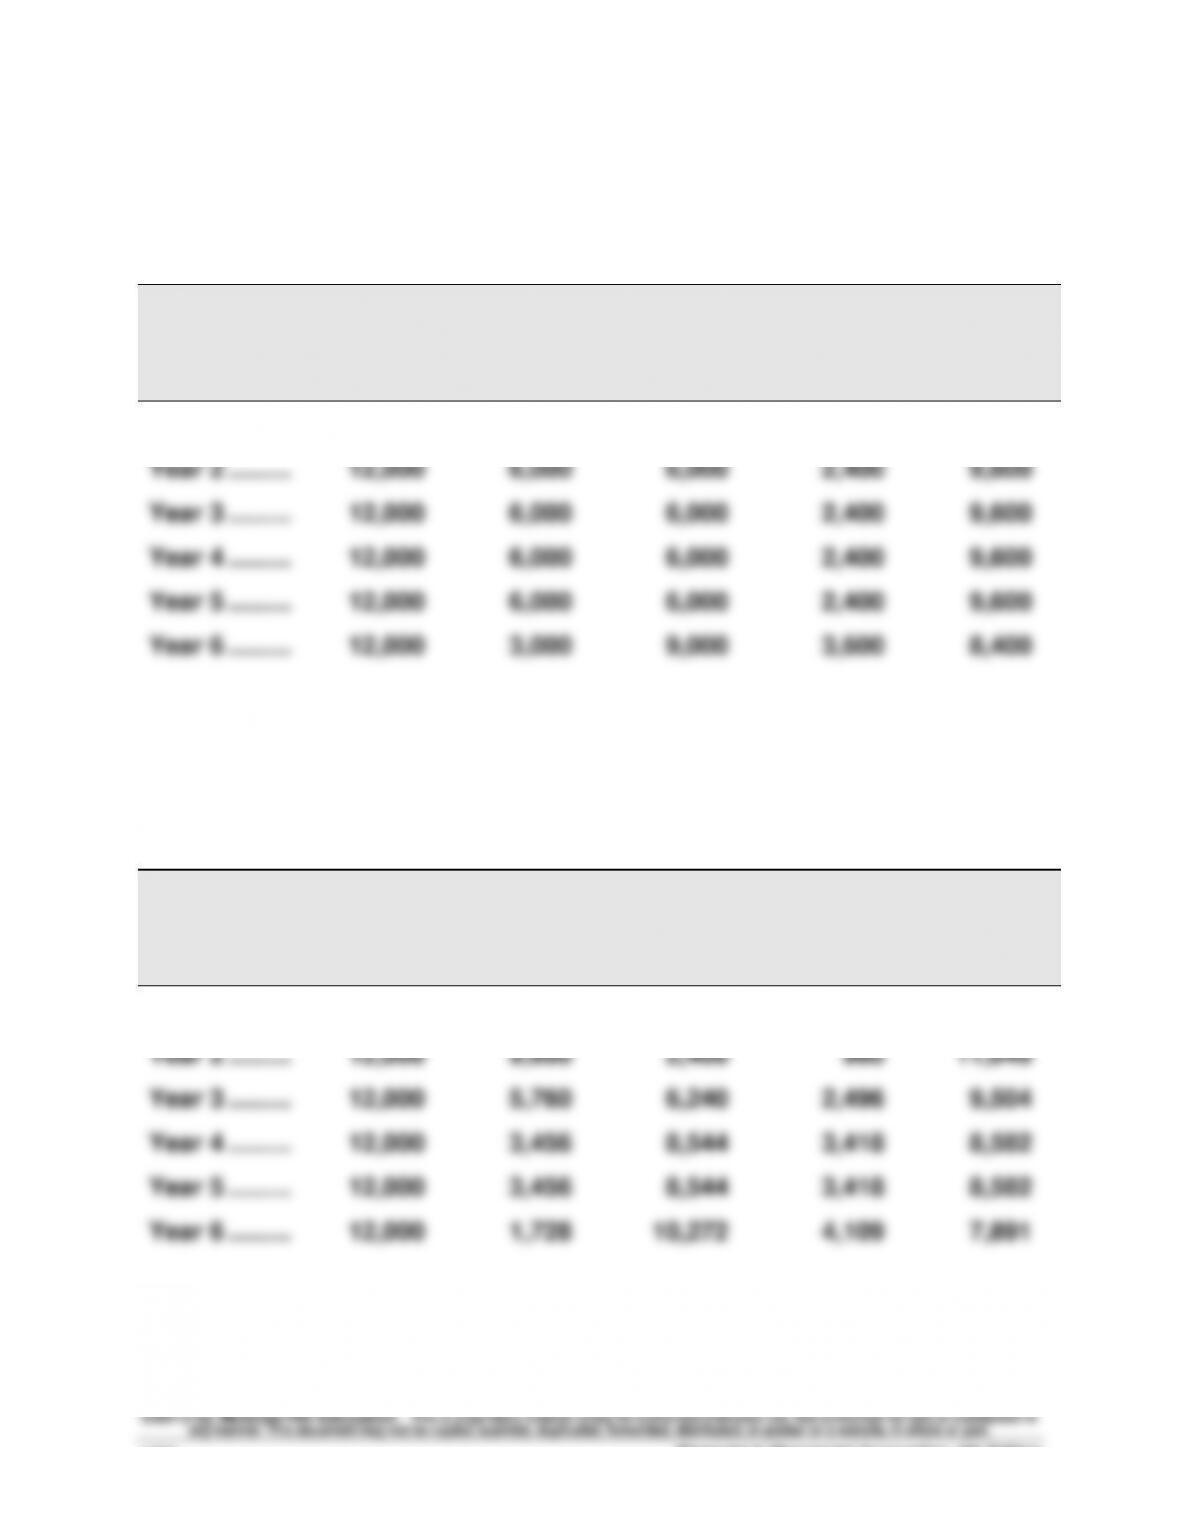
RESULTS USING STRAIGHT-LINE DEPRECIATION
(a)
Income
Before
Deprec.
(b)
Straight–
Line
Deprec.
(c)
Taxable
Income
(a) – (b)
(d)
40%
Income
Taxes
(e)
Net Cash
Flows
(a) – (d)
Year 1 ……….………………
$12,000
$3,000
$ 9,000
$3,600
$8,400
Year 2 ……….………………
12,000
6,000
6,000
2,400
9,600
Year 3 ……….………………
12,000
6,000
6,000
2,400
9,600
Year 4 ……….………………
12,000
6,000
6,000
2,400
9,600
Year 5 ……….………………
12,000
6,000
6,000
2,400
9,600
Year 6 ……….………………
12,000
3,000
9,000
3,600
8,400
Part 2
RESULTS USING MACRS DEPRECIATION
(a)
Income
Before
Deprec.
(b)
MACRS
Deprec.
(c)
Taxable
Income
(a) – (b)
(d)
40%
Income
Taxes
(e)
Net Cash
Flows
(a) – (d)
Year 1 ……….………………
$12,000
$6,000
$ 6,000
$2,400
$ 9,600
Year 2 ……….………………
12,000
9,600
2,400
960
11,040
Year 3 ……….………………
12,000
5,760
6,240
2,496
9,504
Year 4 ……….………………
12,000
3,456
8,544
3,418
8,582
Year 5 ……….………………
12,000
3,456
8,544
3,418
8,582
Year 6 ……….………………
12,000
1,728
10,272
4,109
7,891