Chapter 24
Capital Budgeting and Investment
Analysis
QUESTIONS
1. Capital budgeting decisions require careful analysis because they are generally
3. Capital budgeting decisions are risky because: (1) the outcomes are uncertain,
5. A shorter payback period is desirable because management prefers to reduce
the risk that the investment might not be profitable over the long run. As a result
6. If net income is earned evenly throughout each year and straight-line
7. When the present value of expected net cash flows, discounted at 10%, exceeds
the amount invested it indicates that the expected rate of return on the
Financial & Managerial Accounting, 5th Edition
1340
QUICK STUDIES
Quick Study 24-1 (10 minutes)
Quick Study 24-2 (10 minutes)
1. If all else is equal, Investment A would be preferred over Investment B
2. However, if the investments are different, then there are at least four
reasons why Investment B might be preferred over Investment A:
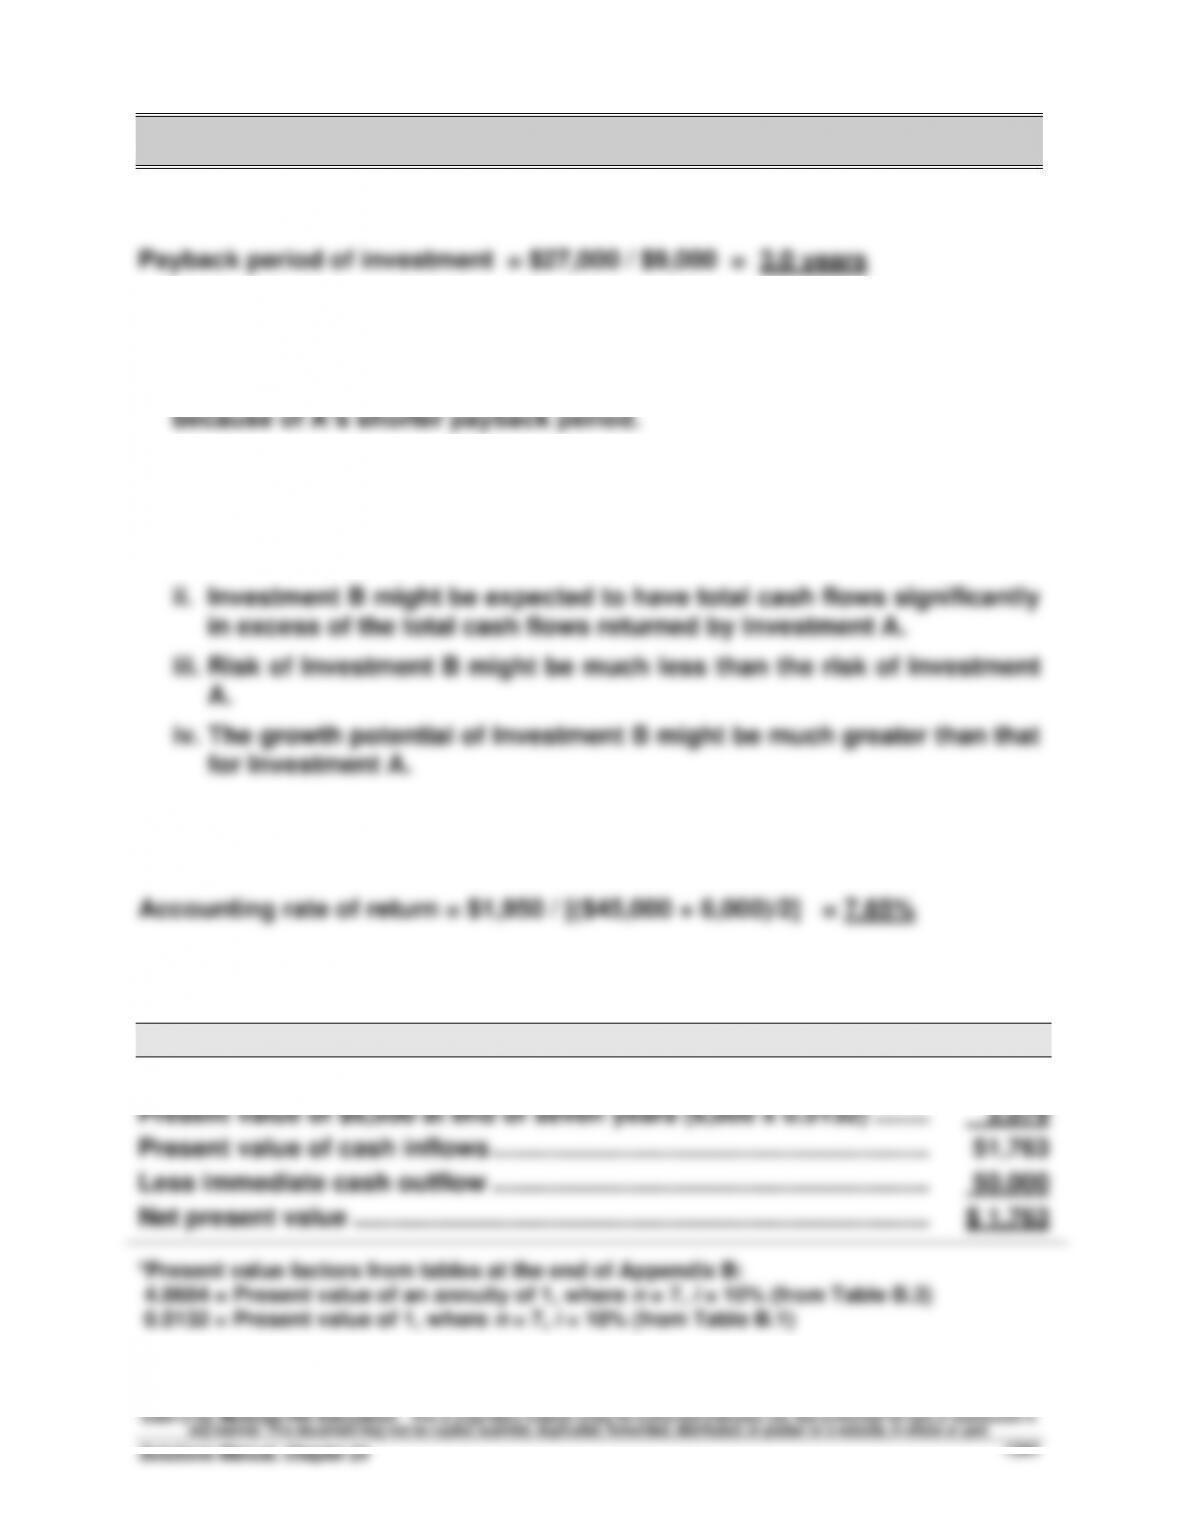
i. The present value of cash flows from Investment B might greatly
exceed the present value of cash flows from Investment A.
Quick Study 24-3 (10 minutes)
Quick Study 24-4 (15 minutes)
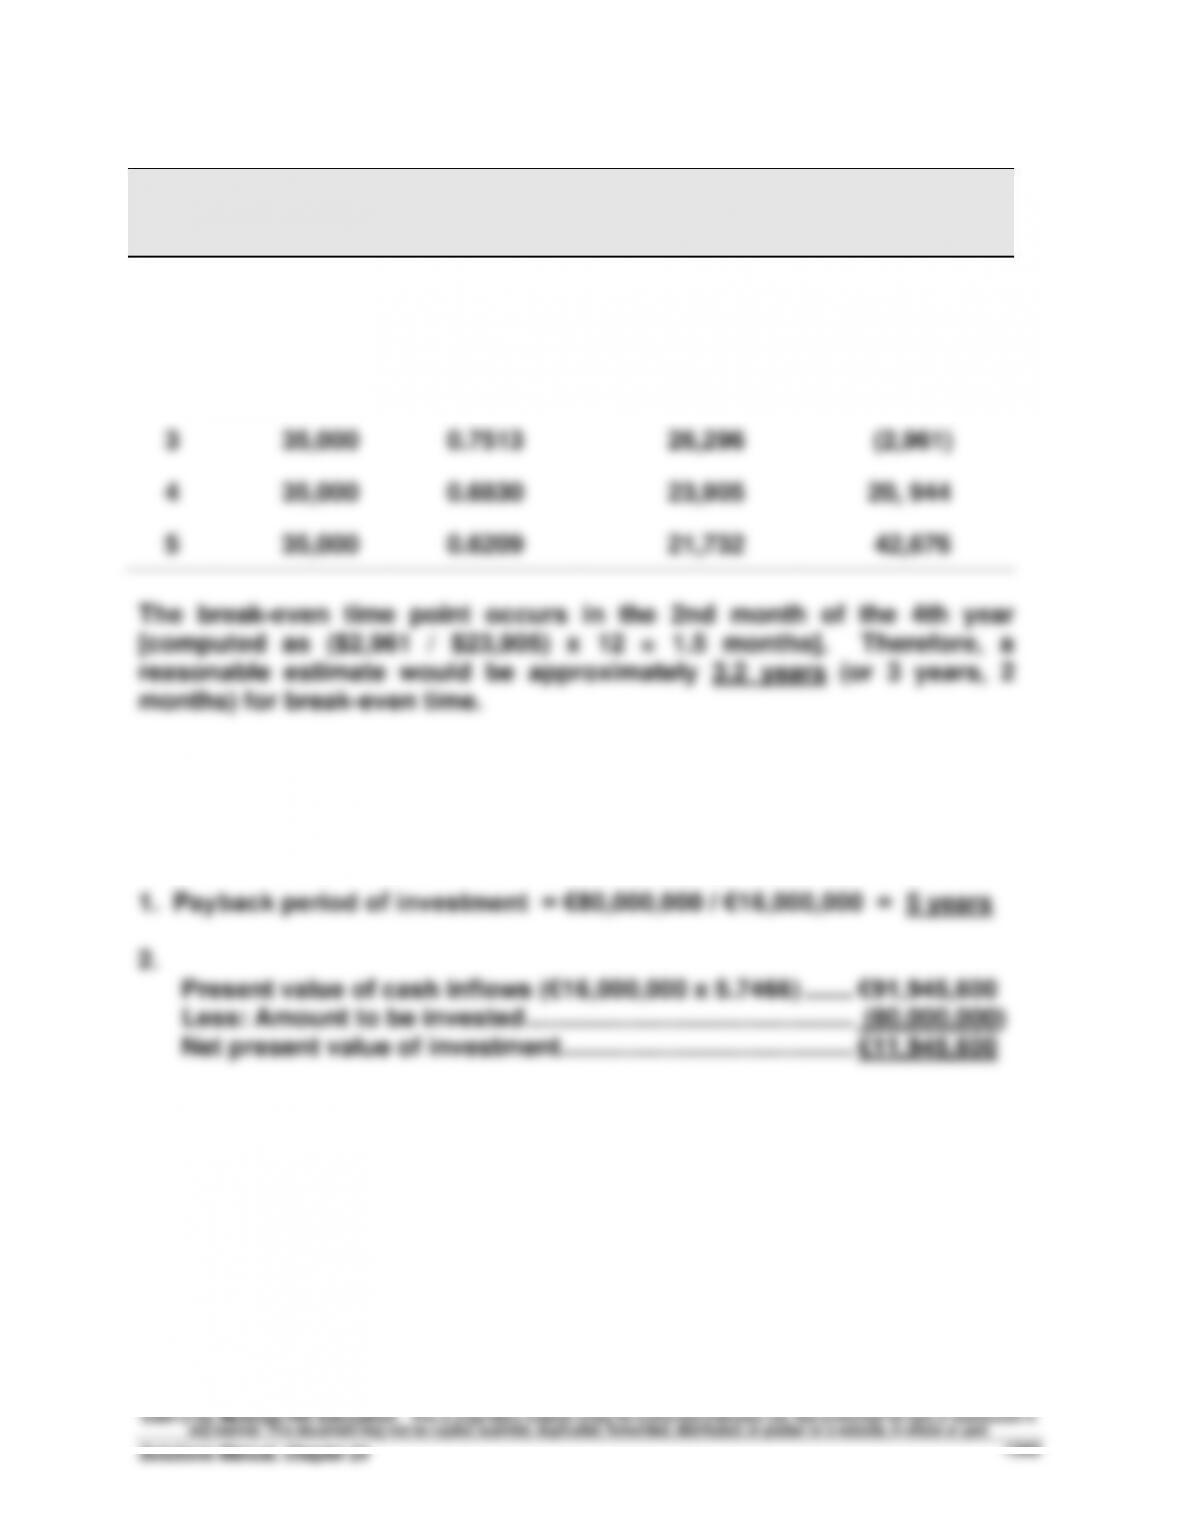
Net present value of investment*
Present value of seven $10,000 cash inflows (10,000 x 4.8684) ……..……
$48,684
Present value of $6,000 at end of seven years (6,000 x 0.5132) ……..……
3,079
Present value of cash inflows ……………………………………………………….
51,763
Less immediate cash outflow ……………………………………………………….
50,000
Net present value ………………………………………………………………………..……
$ 1,763
*Present value factors from tables at the end of Appendix B:
4.8684 = Present value of an annuity of 1, where n = 7, i = 10% (from Table B.3)
0.5132 = Present value of 1, where n = 7, i = 10% (from Table B.1)
Financial & Managerial Accounting, 5th Edition
1342
Quick Study 24-5 (10 minutes)
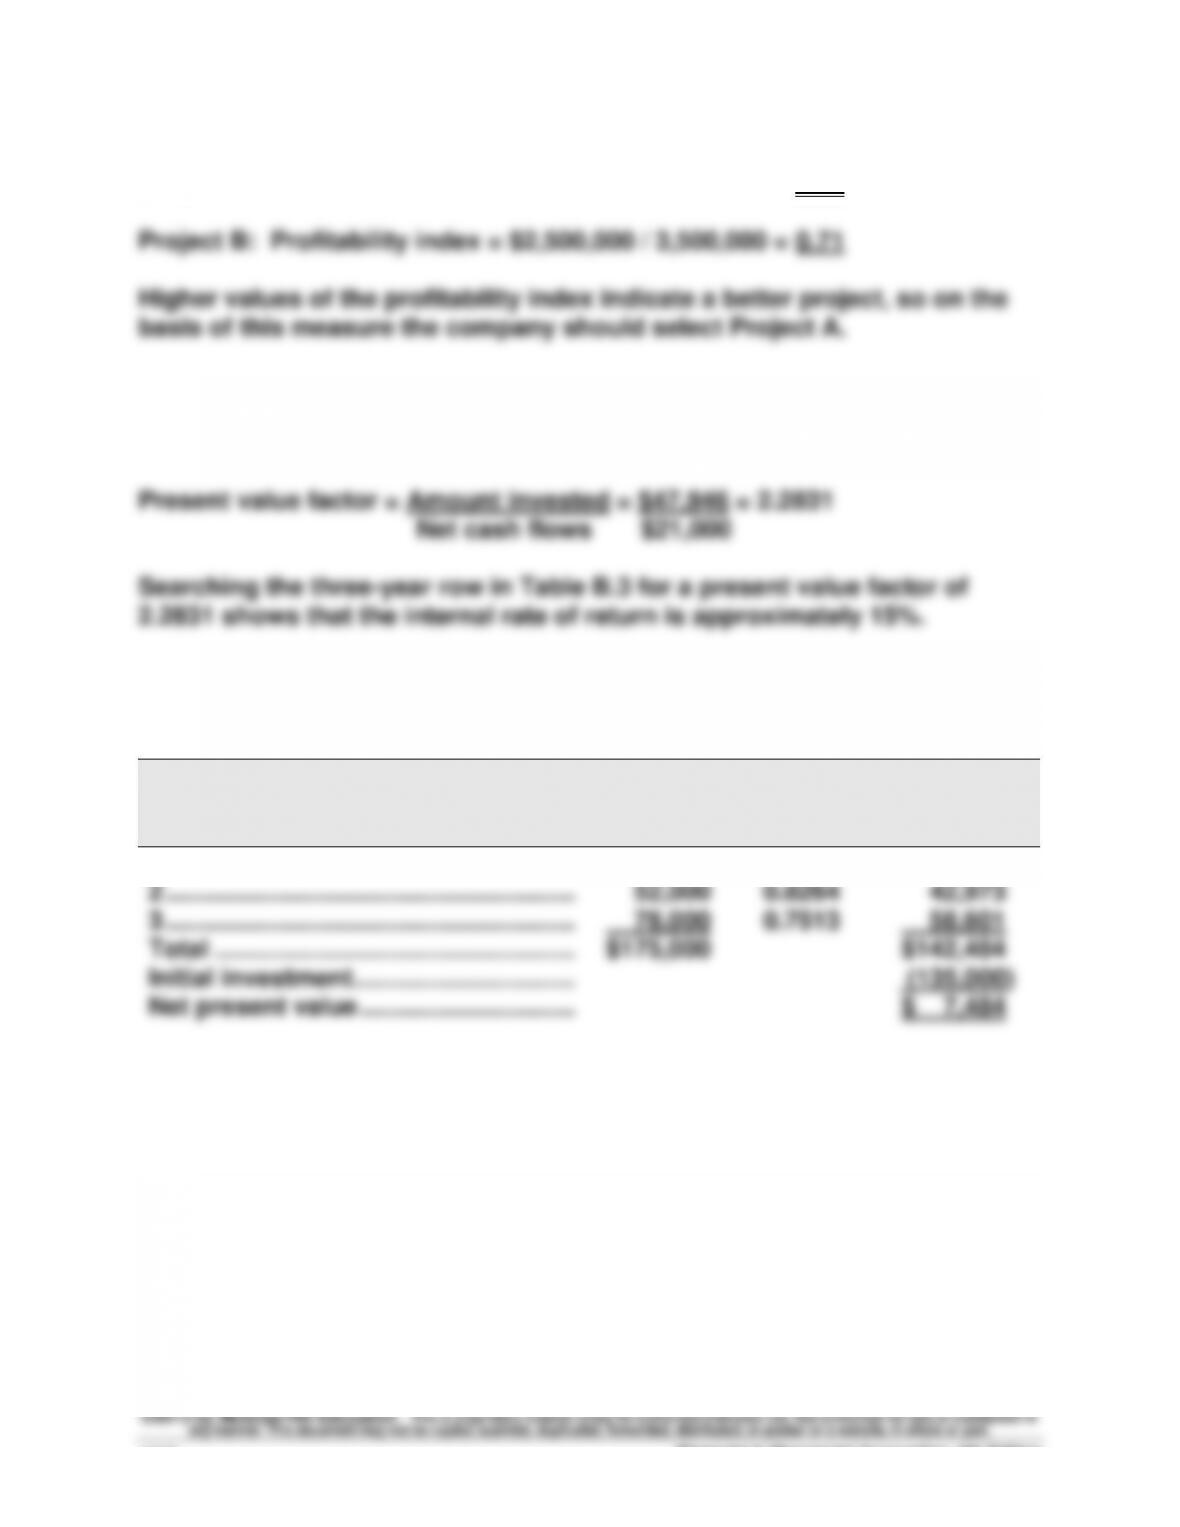
Project A: Profitability index = $1,100,000 / 400,000 = 2.75
Quick Study 24-6 (10 minutes)
Quick Study 24-7 (15 minutes)
Year
Net Cash
Flows
Present
Value of
1 at 10%
Present
Value of Net
Cash Flows
1 …………………………………………………..
$ 45,000
0.9091
$ 40,910
2 …………………………………………………..
52,000
0.8264
42,973
3 …………………………………………………..
78,000
0.7513
58,601
Total …………………………………………….
$175,000
$142,484
Initial investment…………………………..
(135,000)
Net present value ………………………….
$ 7,484
Quick Study 24-8 (15 minutes)
Year
Cash flows
Present value
of 1 at 10%
Present value of
cash flows
Cumulative
present value of
cash flows
0
$(90,000)
1.0000
$(90,000)
$(90,000)
1
35,000
0.9091
31,819
(58,181)
2
35,000
0.8264
28,924
(29,257)
3
35,000
0.7513
26,296
(2,961)
4
35,000
0.6830
23,905
20, 944
5
35,000
0.6209
21,732
42,676
The break-even time point occurs in the 2nd month of the 4th year
[computed as ($2,961 / $23,905) x 12 = 1.5 months]. Therefore, a
reasonable estimate would be approximately 3.2 years (or 3 years, 2
months) for break-even time.
Quick Study 24-9 (15 minutes)
EXERCISES
Exercise 24–1 (20 minutes)
Annual Net
Cumulative
Cash Flows
Cash Flows
Year 1 …………………………..………………………………
$ 60,000
$ 60,000
Year 2 …………………………..………………………………
40,000
100,000
Year 3 …………………………..………………………………
70,000
170,000
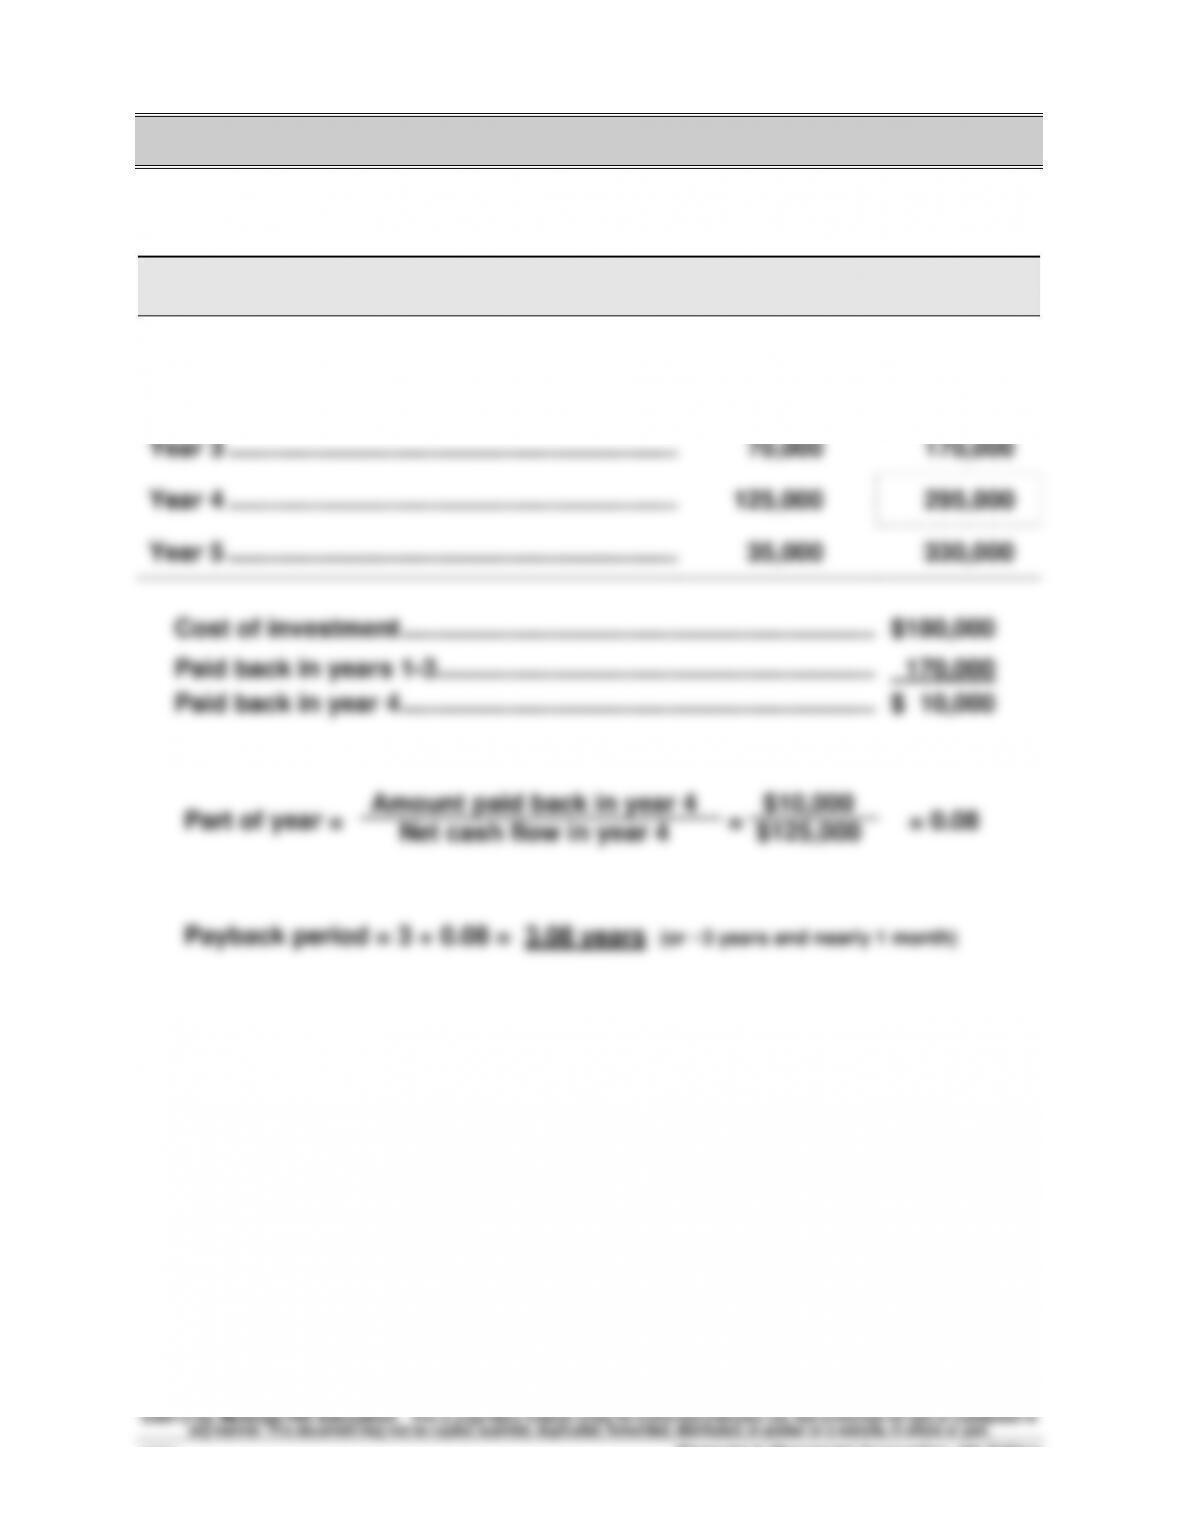
Year 4 …………………………..………………………………
125,000
295,000
Year 5 …………………………..………………………………
35,000
330,000
Exercise 24-2 (30 minutes)
COMPUTATION OF ANNUAL DEPRECIATION EXPENSE
Double-declining balance rate = (100% / 5) x 2 = 40%
Annual Depr.
Beginning
(40% of
Accum. Depr.
Ending
Year
Book Value
Book Value)
at Year-End
Book Value
1
$150,000
$60,000
$ 60,000
$90,000
2
90,000
36,000
96,000
54,000
3
54,000
21,600
117,600
32,400
4
32,400
12,960
130,560
19,440
5
19,440
19,440
150,000
0
ANNUAL CASH FLOWS
Net
Income
Depreciation
Net Cash
Flow
Cumulative
Cash Flow
Year 1
$ 10,000
$60,000
$ 70,000
$ 70,000
Year 2
25,000
36,000
61,000
131,000
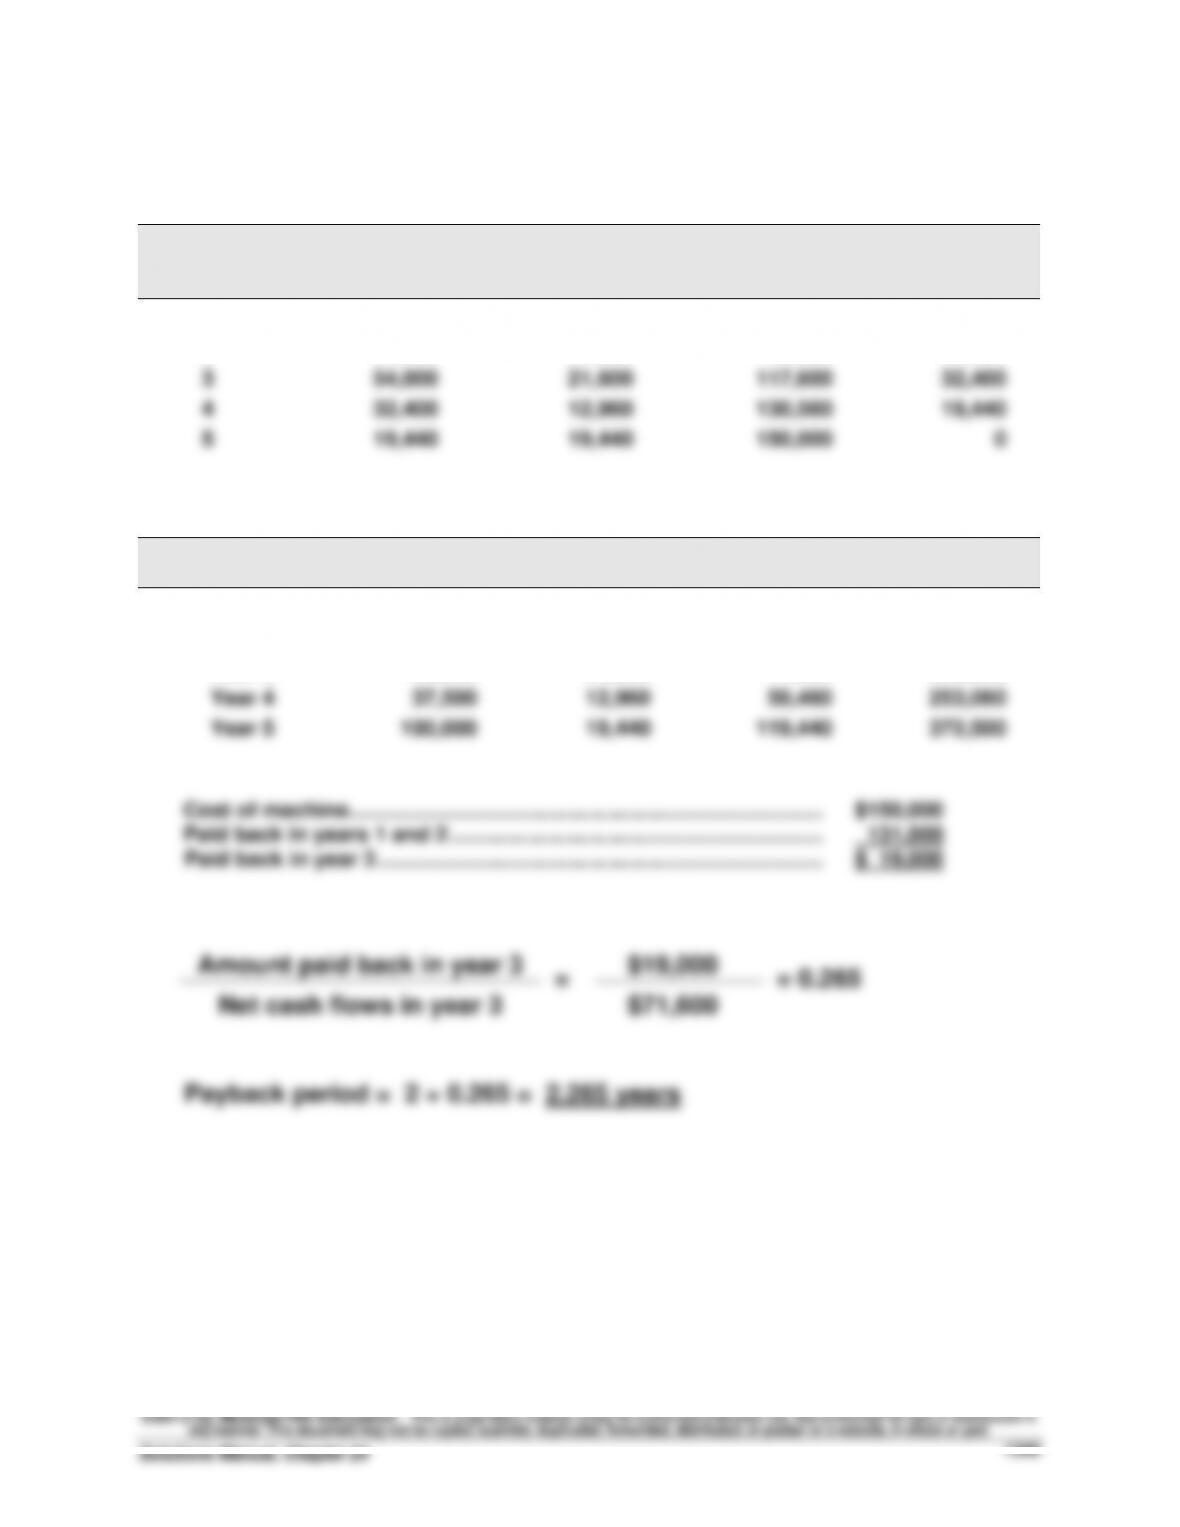
Year 3
50,000
21,600
71,600
202,600
Year 4
37,500
12,960
50,460
253,060
Year 5
100,000
19,440
119,440
372,500
Cost of machine…………………………………………………………………….……..
$150,000
Paid back in years 1 and 2 ……………………………………………………....
131,000
Paid back in year 3 ………………………………………………………………..……..
$ 19,000
= = 0.265
Payback period = 2 + 0.265 = 2.265 years
Amount paid back in year 3
Net cash flows in year 3
$19,000
$71,600
Exercise 24-3 (20 minutes)
a.
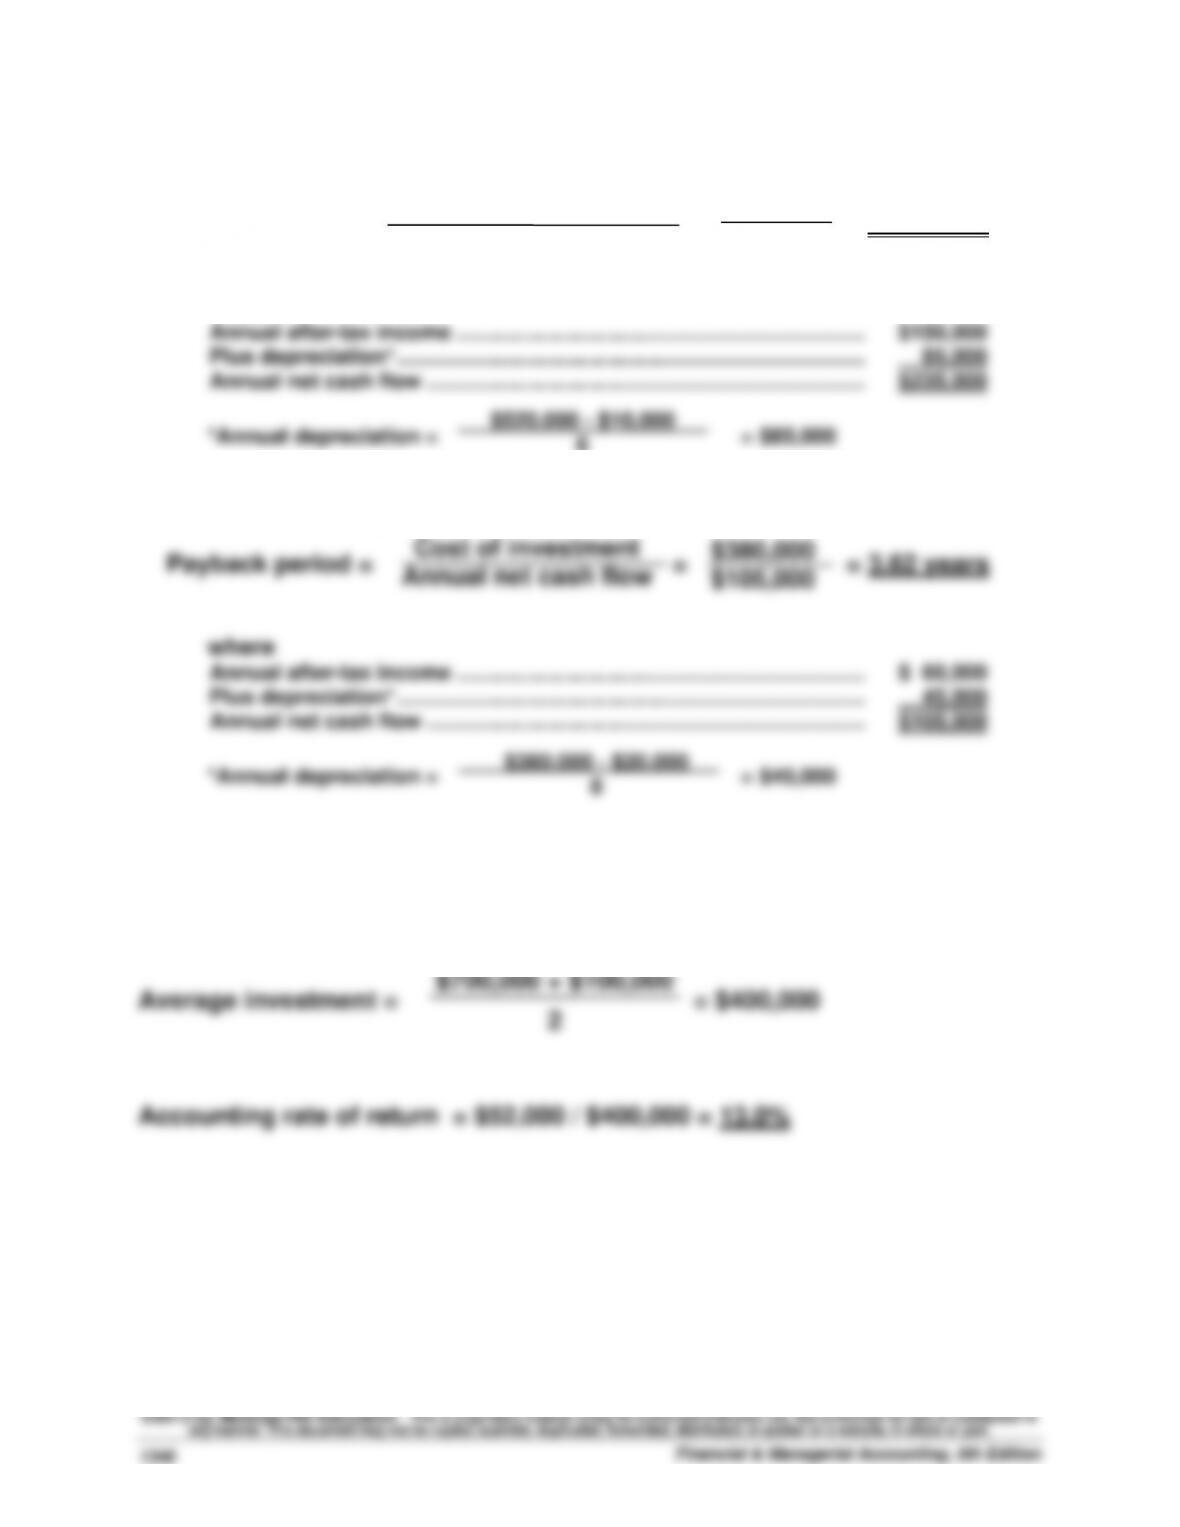
Payback period = = = 2.21 years
where
Annual after-tax income ………………………………………………………………..
$150,000
Plus depreciation* …………………………………………………………………….…..
85,000
Annual net cash flow ………………………………………………………………..…..
$235,000
*Annual depreciation = = $85,000
b.
Annual after-tax income ………………………………………………………………..
$ 60,000
Plus depreciation* …………………………………………………………………….…..
45,000
Annual net cash flow ………………………………………………………………..…..
$105,000
Exercise 24-4 (15 minutes)
Cost of investment
Annual net cash flow
$520,000
$235,000
$520,000 – $10,000
6
Exercise 24-5 (20 minutes)
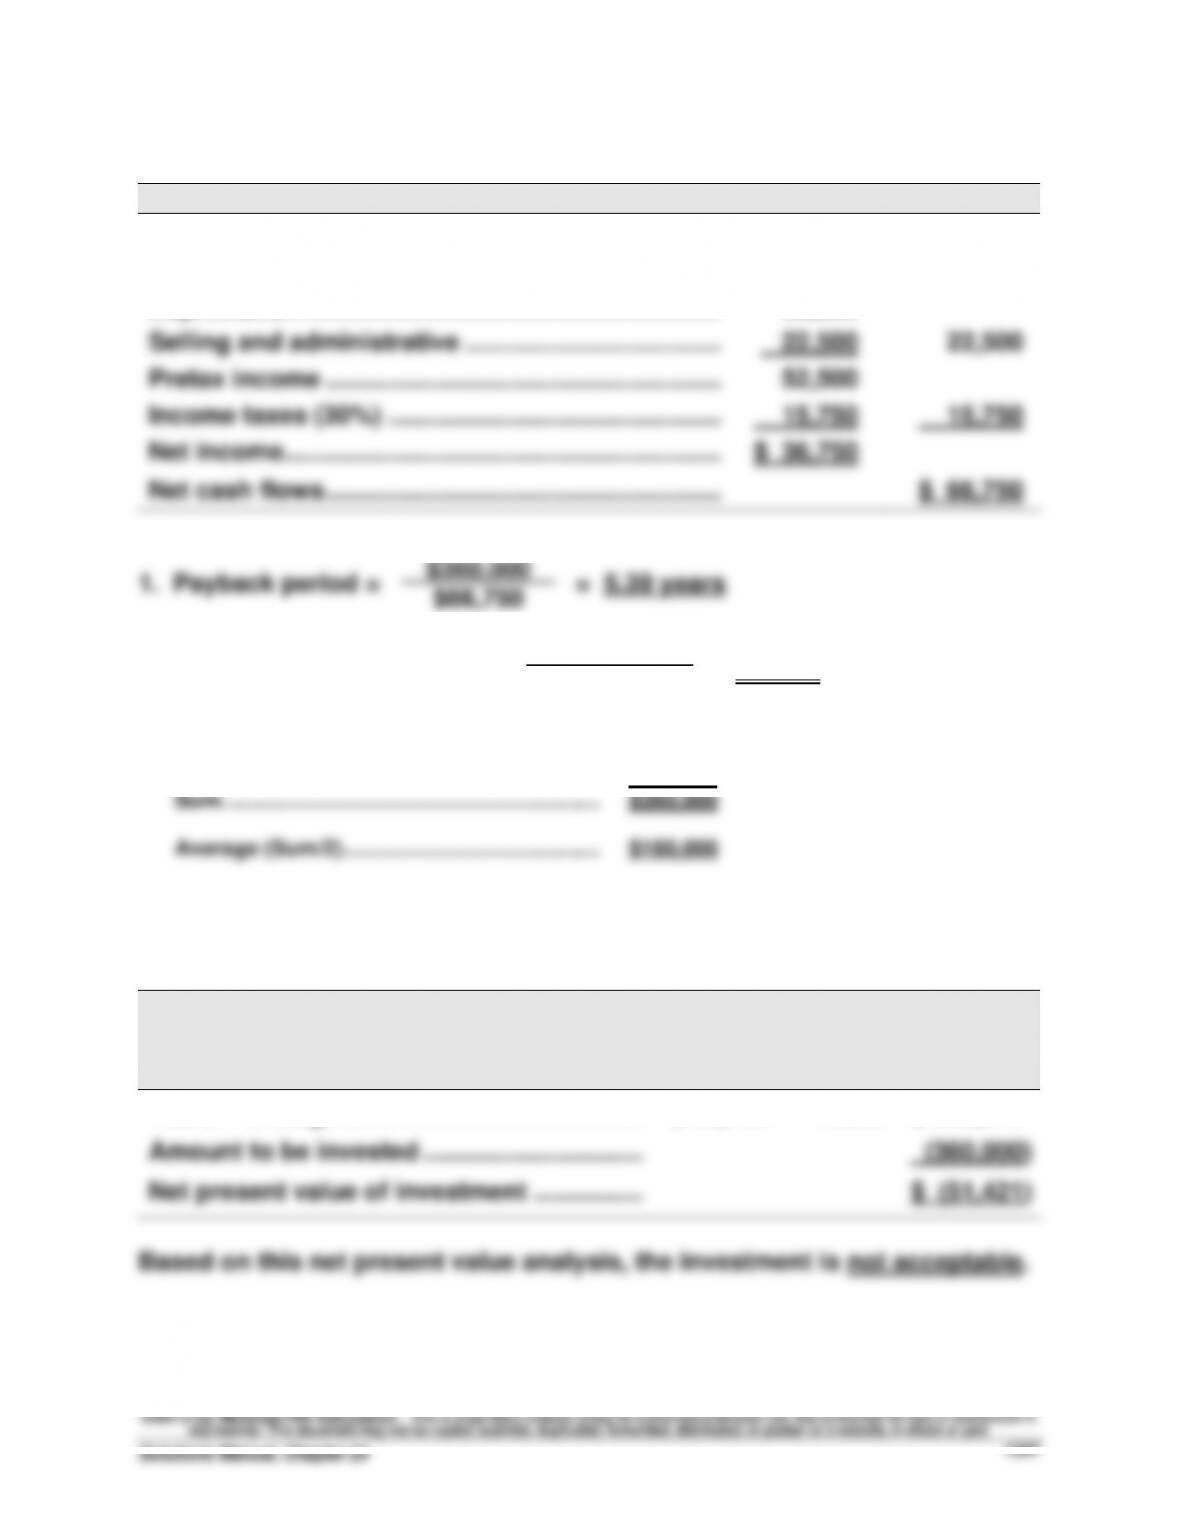
COMPUTING NET CASH FLOWS FROM NET INCOME
Net income
Cash flows
Sales ……………………………………………………………….…….
$225,000
$225,000
Materials, labor & overhead ……………………………..…….
120,000
120,000
Depreciation ……………………………………………………….
30,000
Selling and administrative ……………………………….…….
22,500
22,500
Pretax income ……………………………………………………….
52,500
Income taxes (30%) ……………………………………………….
15,750
15,750
Net income ……………………………………………………….
$ 36,750
Net cash flows ……………………………………………………….
$ 66,750
2. Accounting rate of return = = 20.42%
*Average investment
Cost ……………………………………………………….
$360,000
Salvage ……………………………………………………
0
Sum ……………………………………………………….
$360,000
Average (Sum/2) …………………………..………..…
$180,000
Exercise 24-6 (20 minutes)
Annual
Net Cash
Flows
Present
Value of
Annuity at
8%
Present
Value of
Net Cash
Flows
Years 1 through 6…………………………………..……..
$ 66,750
4.6229
$ 308,579
Amount to be invested …………………………..
(360,000)
Net present value of investment …………….……..
$ (51,421)
Based on this net present value analysis, the investment is not acceptable.
$360,000
$66,750
$36,750
$180,000*
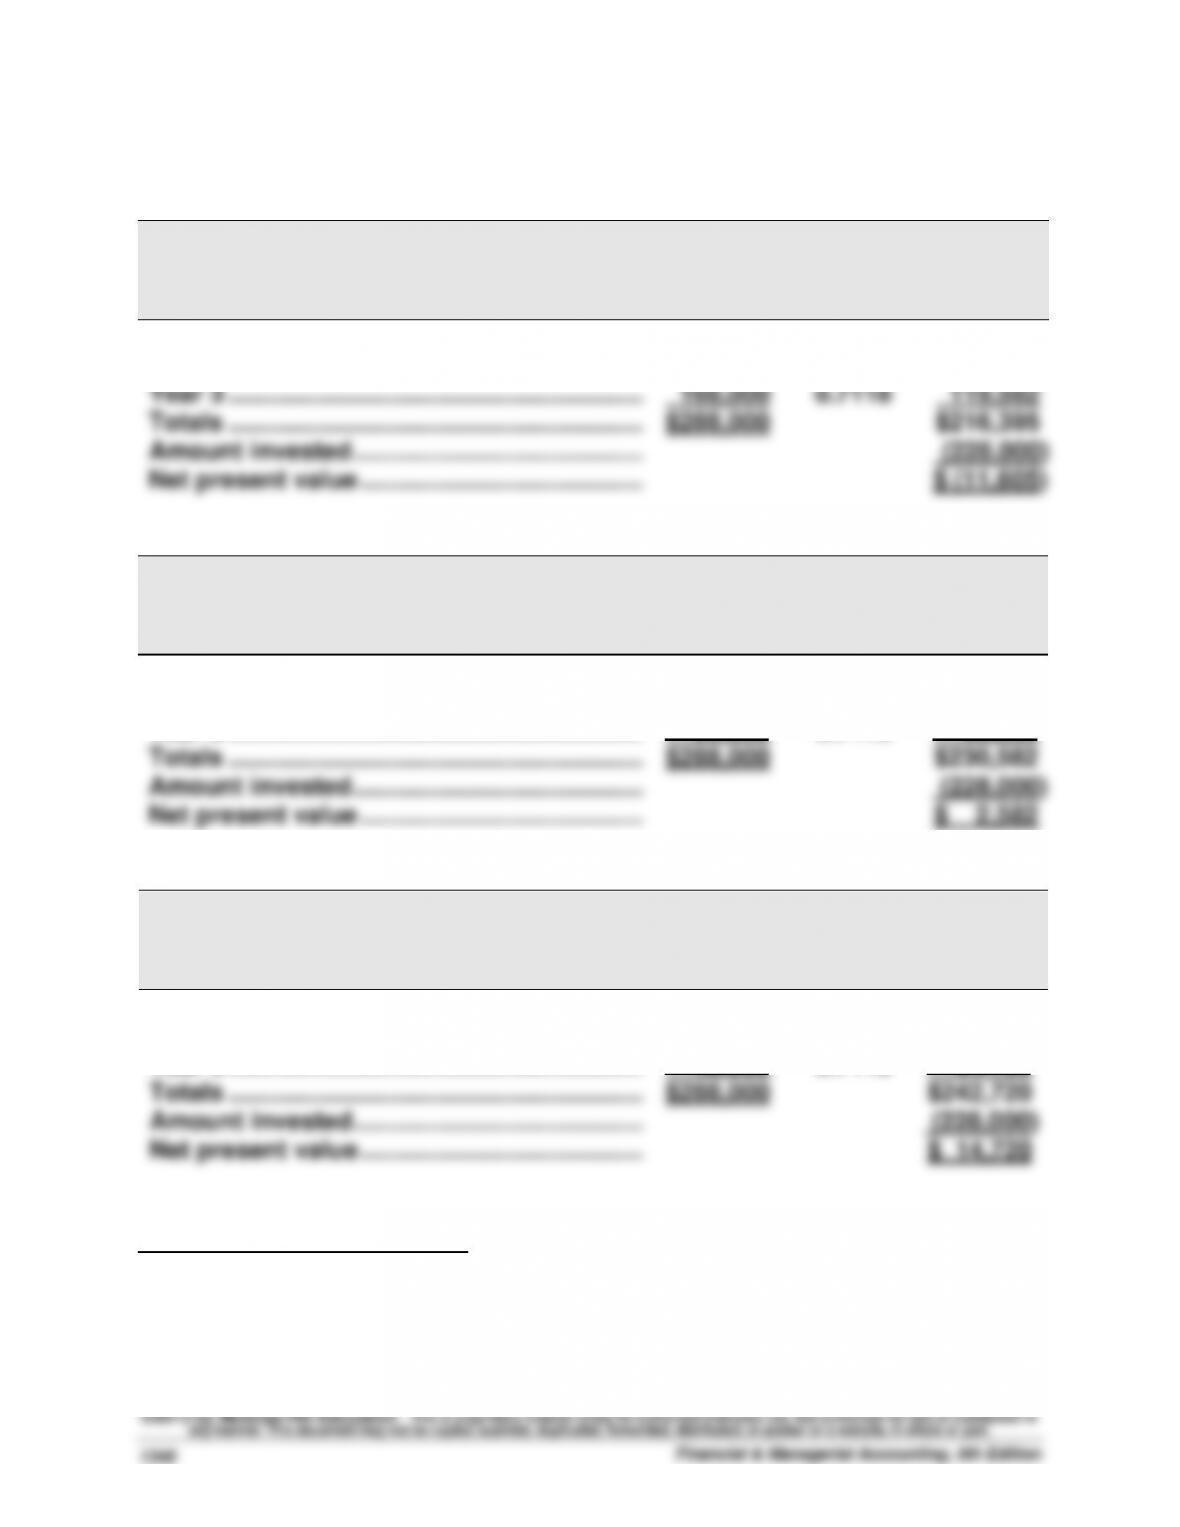
Exercise 24-7 (35 minutes)
1.
PROJECT C1
Net Cash
Flows
Present
Value of 1
at 12%
Present
Value of Net
Cash Flows
Year 1 …………………………..……………………….….
$ 12,000
0.8929
$ 10,715
Year 2 …………………………..……………………….….
108,000
0.7972
86,098
Year 3 …………………………..……………………….….
168,000
0.7118
119,582
Totals ……………………………………………………….
$288,000
$216,395
Amount invested …………………………………………..
(228,000)
Net present value …………………………………..……..
$ (11,605)
PROJECT C2
Net Cash
Flows
Present
Value of 1
at 12%
Present
Value of Net
Cash Flows
Year 1 …………………………..……………………….….
$ 96,000
0.8929
$ 85,718
Year 2 …………………………..……………………….….
96,000
0.7972
76,531
Year 3 …………………………..……………………….….
96,000
0.7118
68,333
Totals ……………………………………………………….
$288,000
$230,582
Amount invested …………………………………………..
(228,000)
Net present value …………………………………..……..
$ 2,582
PROJECT C3
Net Cash
Flows
Present
Value of 1
at 12%
Present
Value of Net
Cash Flows
Year 1 ……………………………………………………….
$180,000
0.8929
$160,722
Year 2 ……………………………………………………….
60,000
0.7972
47,832
Year 3 ……………………………………………………….
48,000
0.7118
34,166
Totals ……………………………………………………….
$288,000
$242,720
Amount invested …………………………………………..
(228,000)
Net present value …………………………..……………..
$ 14,720
Analysis and Interpretation: Both Project C2 and C3 yield a positive net
present value. Accordingly, both C2 and C3 are acceptable investments.
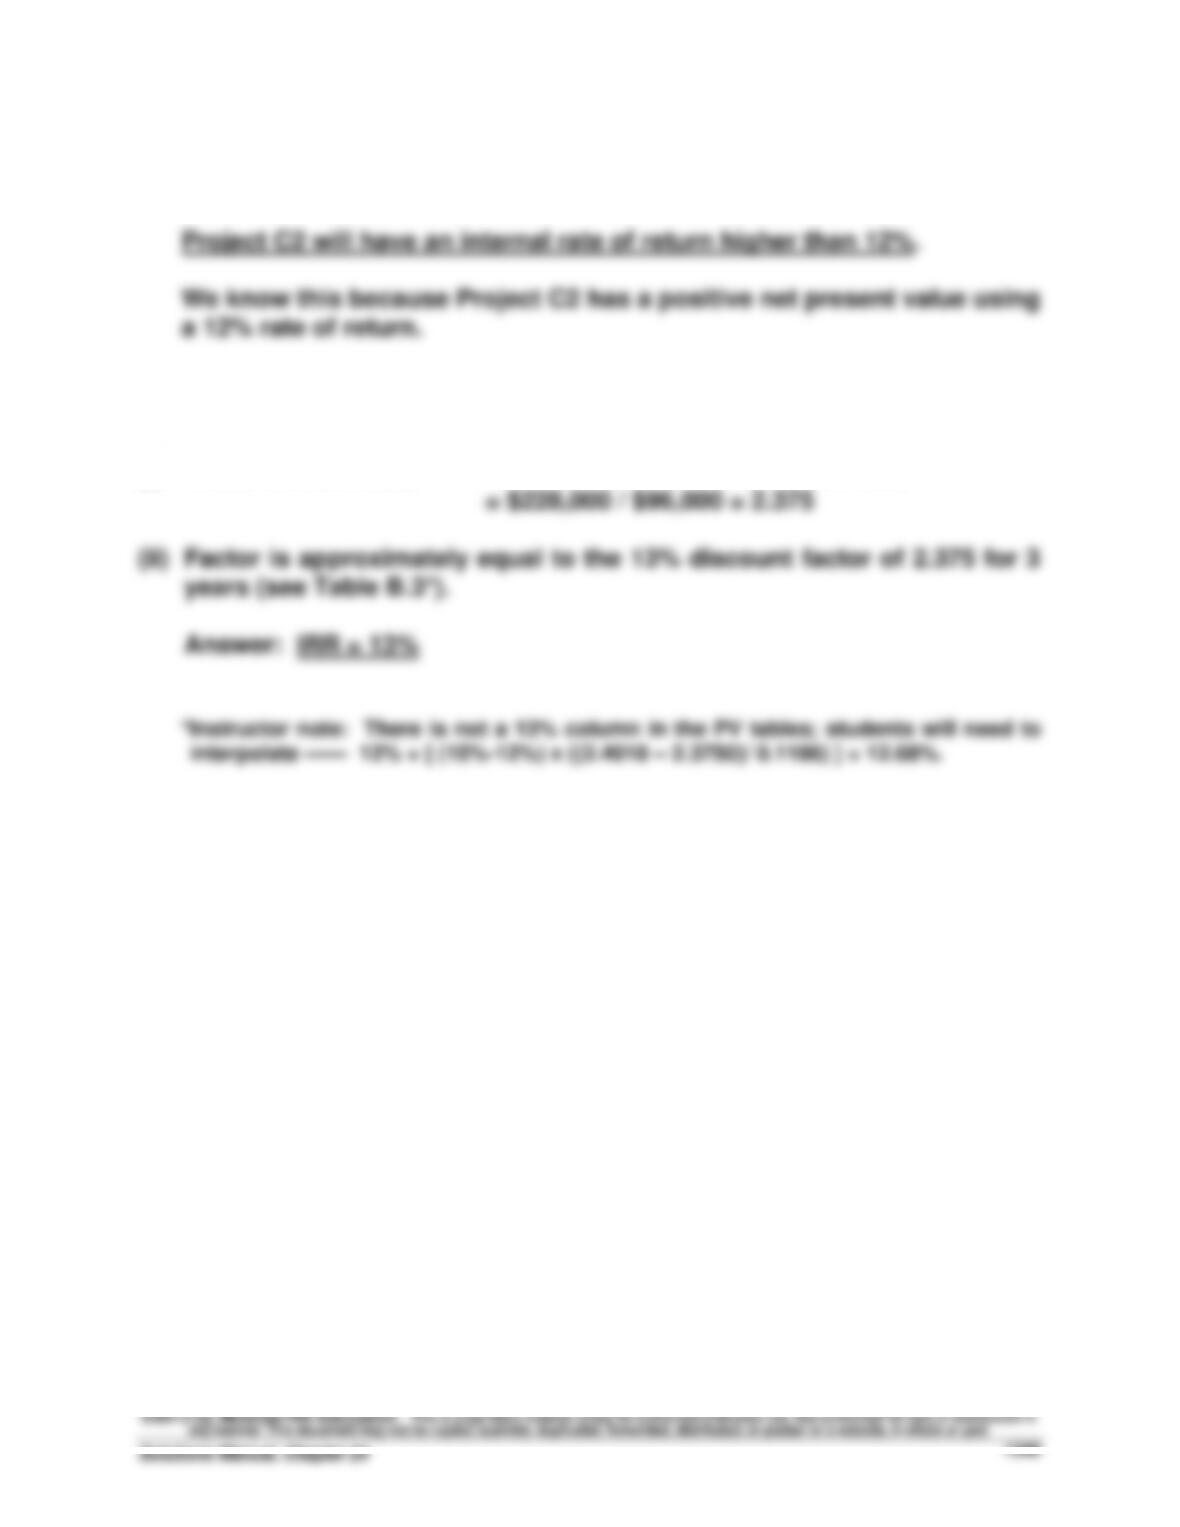
Exercise 24–7 (Continued)
2. INTERNAL RATE OF RETURN VS. NET PRESENT VALUE FOR C2
3. INTERNAL RATE OF RETURN FOR PROJECT C2
(i) Present value factor = Amount invested / Net cash flows
Financial & Managerial Accounting, 5th Edition
1350
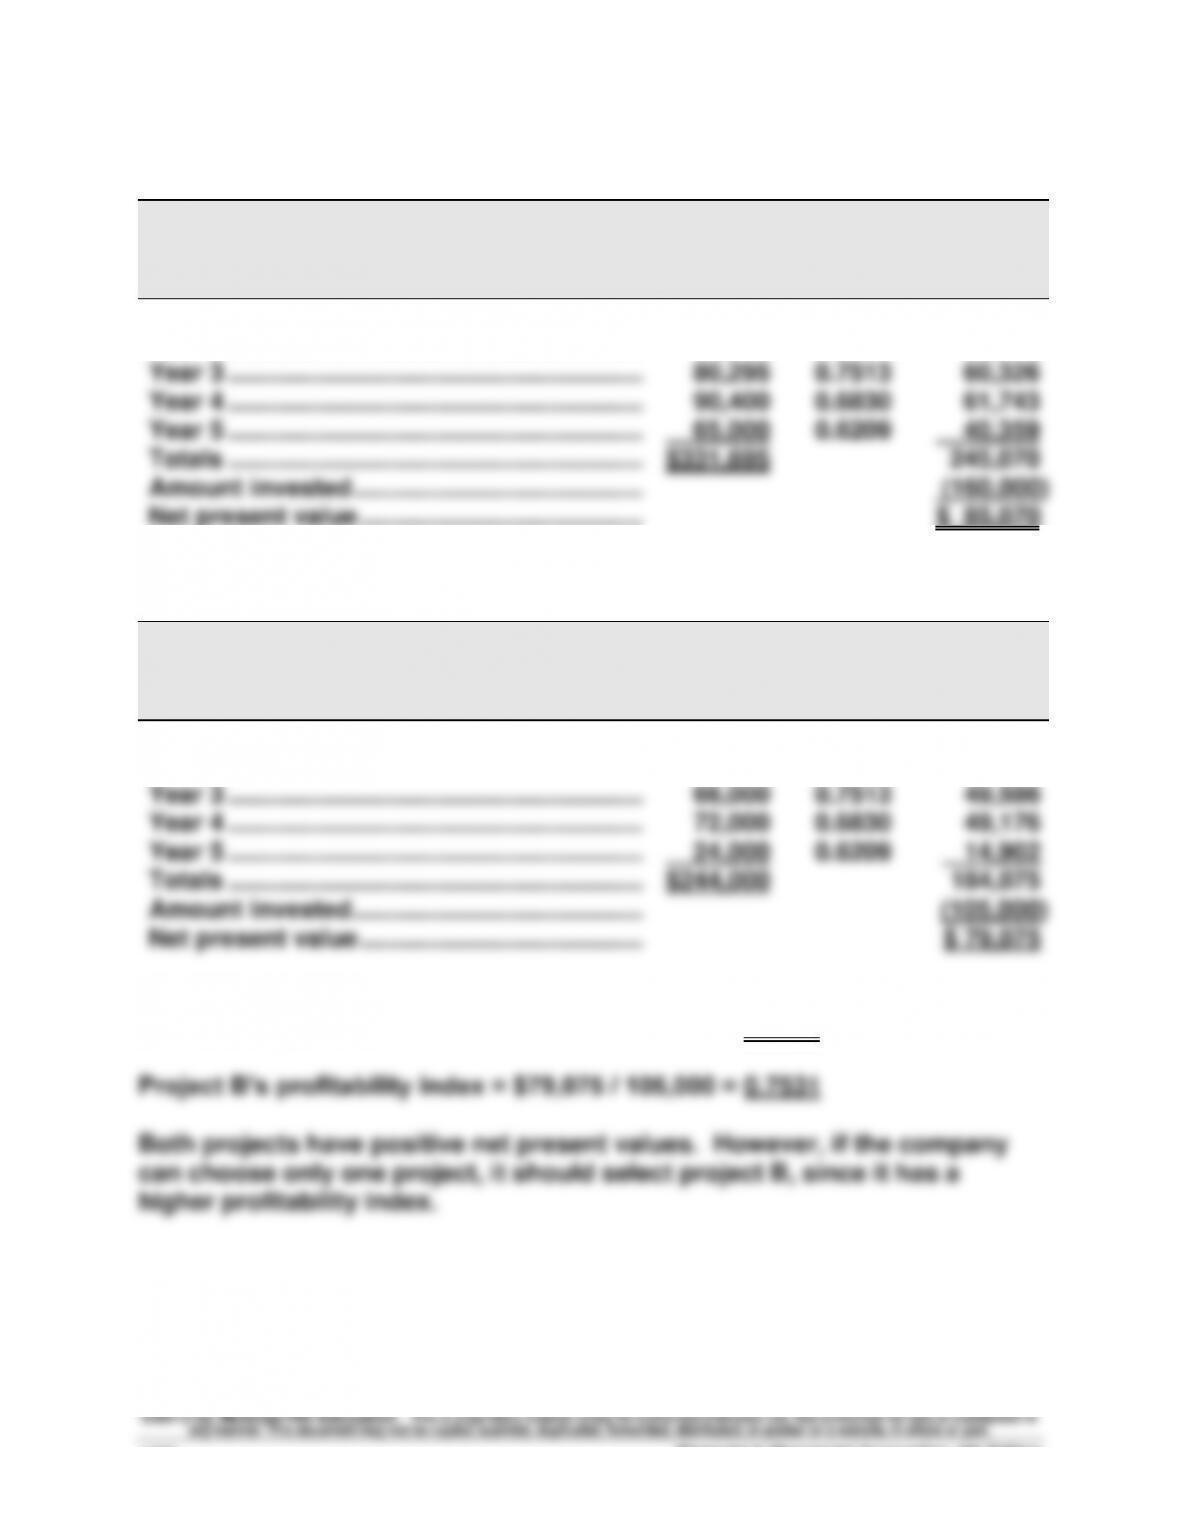
Exercise 24-8 (20 minutes)
PROJECT A
Net Cash
Flows
Present
Value of 1
at 10%
Present
Value of Net
Cash Flows
Year 1 …………………………..……………………….….
$ 40,000
0.9091
$ 36,364
Year 2 …………………………..……………………….….
56,000
0.8264
46,278
Year 3 …………………………..……………………….….
80,295
0.7513
60,326
Year 4 …………………………..……………………….….
90,400
0.6830
61,743
Year 5 …………………………..……………………….….
65,000
0.6209
40,359
Totals ……………………………………………………….
$331,695
245,070
Amount invested …………………………………………..
(160,000)
Net present value …………………………………..……..
$ 85,070
PROJECT B
Net Cash
Flows
Present
Value of 1
at 10%
Present
Value of Net
Cash Flows
Year 1 …………………………..……………………….….
$ 32,000
0.9091
$ 29,091
Year 2 …………………………..……………………….….
50,000
0.8264
41,320
Year 3 …………………………..……………………….….
66,000
0.7513
49,586
Year 4 …………………………..……………………….….
72,000
0.6830
49,176
Year 5 …………………………..……………………….….
24,000
0.6209
14,902
Totals ……………………………………………………….
$244,000
184,075
Amount invested …………………………………………..
(105,000)
Net present value …………………………………..……..
$ 79,075
Project A’s profitability index = $85,070 / 160,000 = 0.5317
Exercise 24-9A (20 minutes)
Using Excel, Project A (B) has an internal rate of return of 26.96 (35.00%).
Project A Project B
A
B
C
D
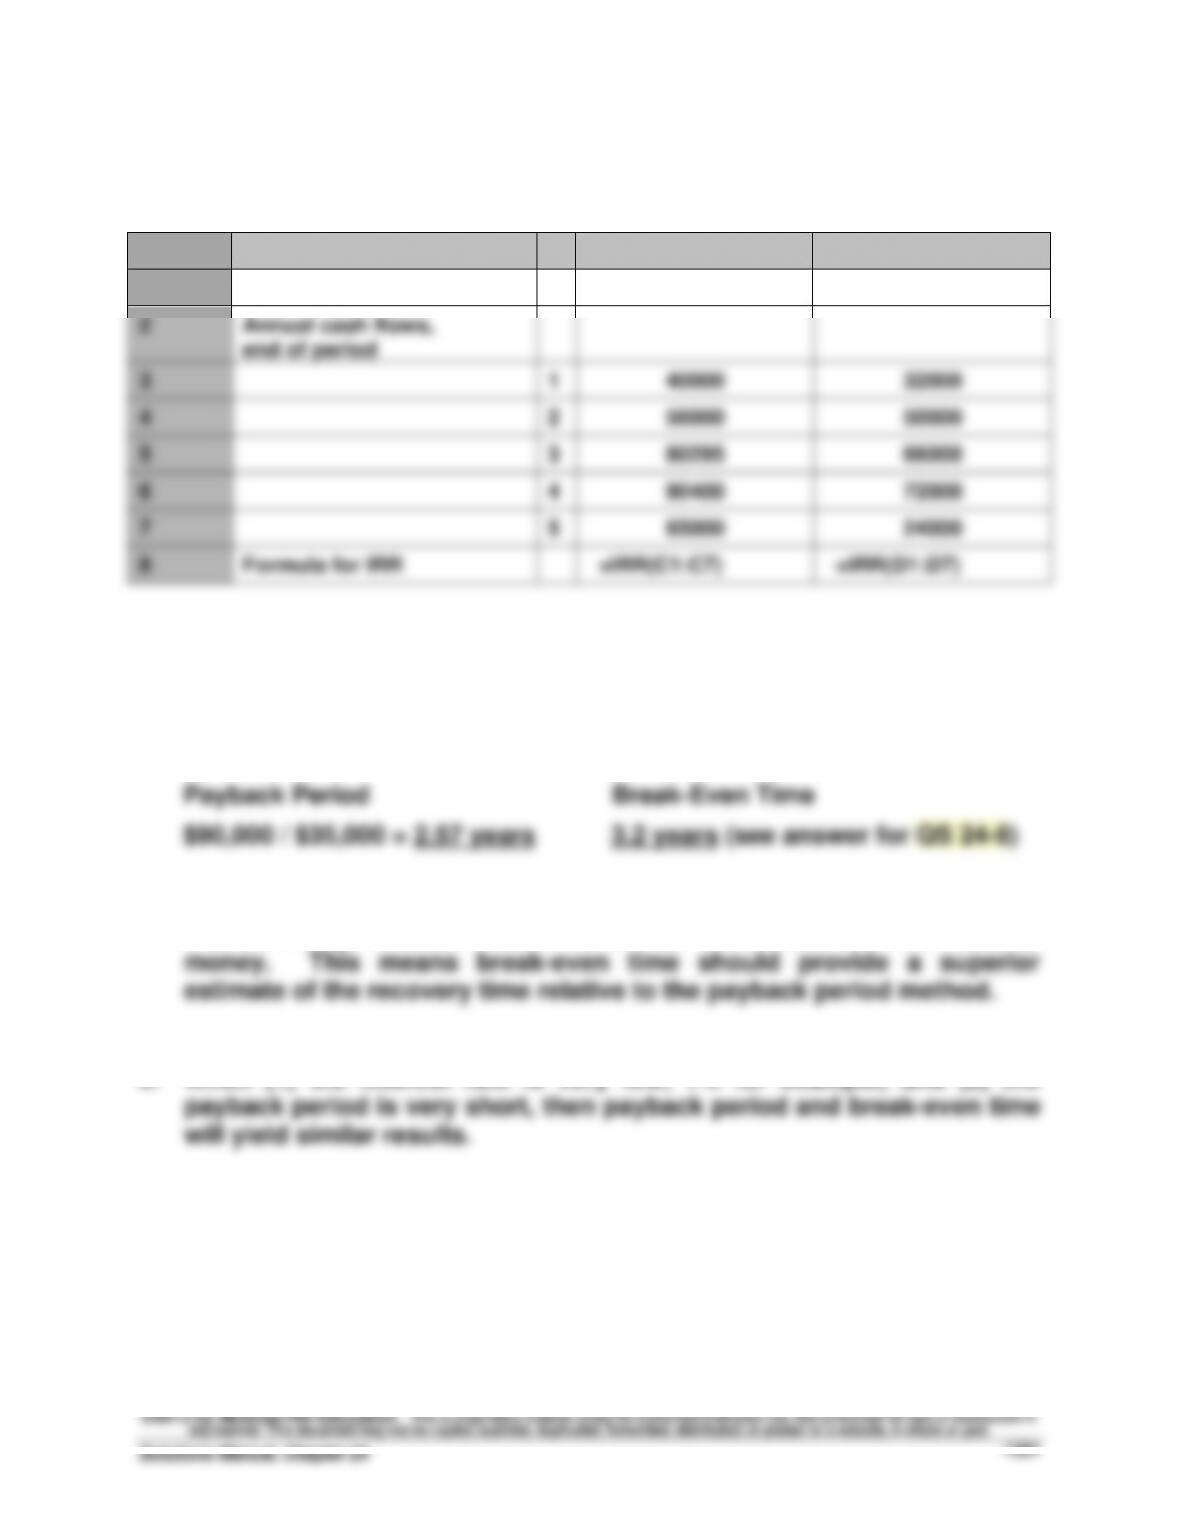
1
Initial investment
–160000
–105000
2
Annual cash flows,
end of period
3
1
40000
32000
4
2
56000
50000
5
3
80295
66000
6
4
90400
72000
7
5
65000
24000
8
Formula for IRR
=IRR(C1:C7)
=IRR(D1:D7)
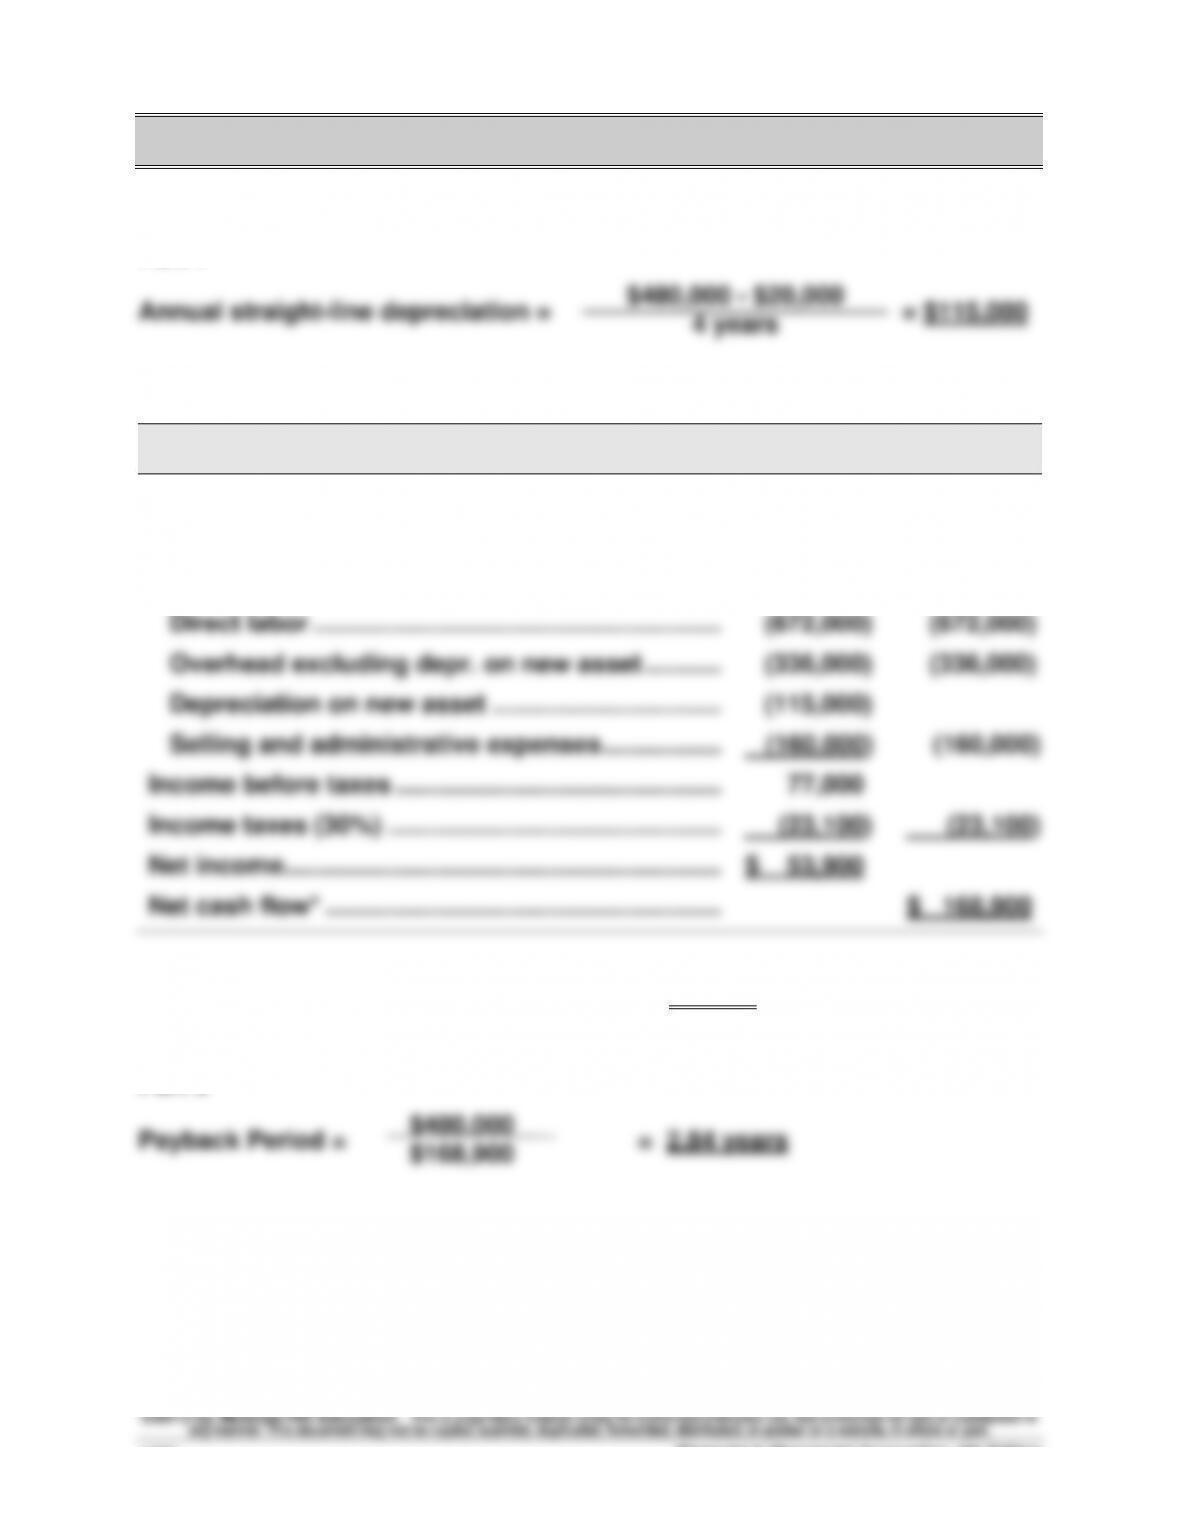
Exercise 24-10 (15 minutes)
1. Recovery time computation
Payback Period
Break-Even Time
$90,000 / $35,000 = 2.57 years
3.2 years (see answer for QS 24-8)
2. The advantage of break-even time is that it considers the time value of
3. When (1) the interest rate is very low, 1% for example, and (2) the
PROBLEM SET A
Problem 24-1A (50 minutes)
Part 1
Part 2
Net
Net Cash
Income
Flow
Expected annual sales of new product ……………...
$1,840,000
$1,840,000
Expected costs of new product
Direct materials ……………………………………………...
(480,000)
(480,000)
Direct labor …………………………………………………....
(672,000)
(672,000)
Overhead excluding depr. on new asset ………....
(336,000)
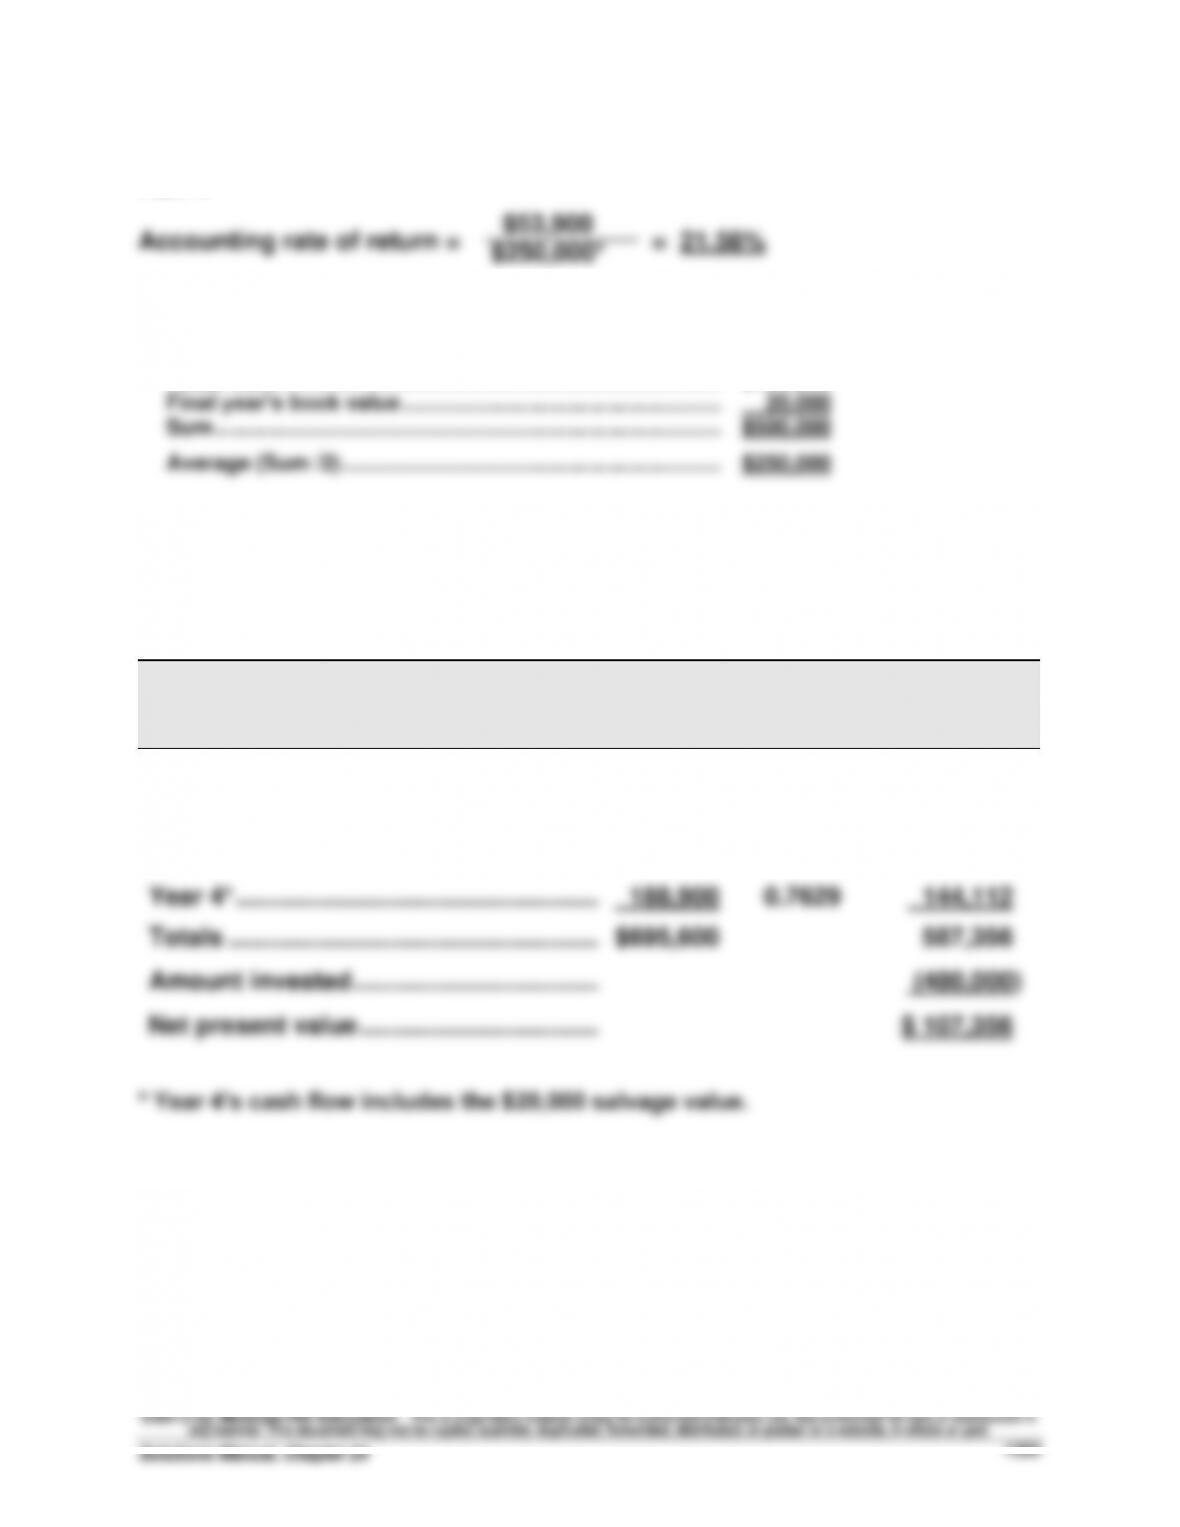
(336,000)
Depreciation on new asset ……………………………..
(115,000)
Selling and administrative expenses ……………....
(160,000)
(160,000)
Income before taxes ………………………………………....
77,000
Income taxes (30%) …………………………………………..
(23,100)
(23,100)
Net income ……………………………………………………….
$ 53,900
Net cash flow* …………………………………………………..
$ 168,900
* Alternatively, annual net cash flow can be computed as
Net income + Depreciation = $53,900 + $115,000 = $168,900
Part 3
Problem 24-1A (Continued)
Part 4
* Average investment
Asset cost ………………………………………………………………..……..
$480,000
Final year’s book value ……………………………………………..……..
20,000
Sum ………………………………………………………………………………..
$500,000
Average (Sum /2) ……………………………………………………….
$250,000
Part 5
Present Value of Net Cash Flows
Present
Present
Net Cash
Value of
Value of Net
Flows
1 at 7%
Cash Flows
Year 1 …………………………..………………….….
$168,900
0.9346
$ 157,854
Year 2 …………………………..………………….….
168,900
0.8734
147,517
Year 3 …………………………..………………….….
168,900
0.8163
137,873
Year 4* ……………………………………………..….
188,900
0.7629
144,112
Totals ………………………………………………….
$695,600
587,356
Amount invested ………………………………….
(480,000)
Net present value ……………………………..….
$ 107,356
* Year 4’s cash flow includes the $20,000 salvage value.
$250,000*