Problem 22–4AB (Continued)
Part 2
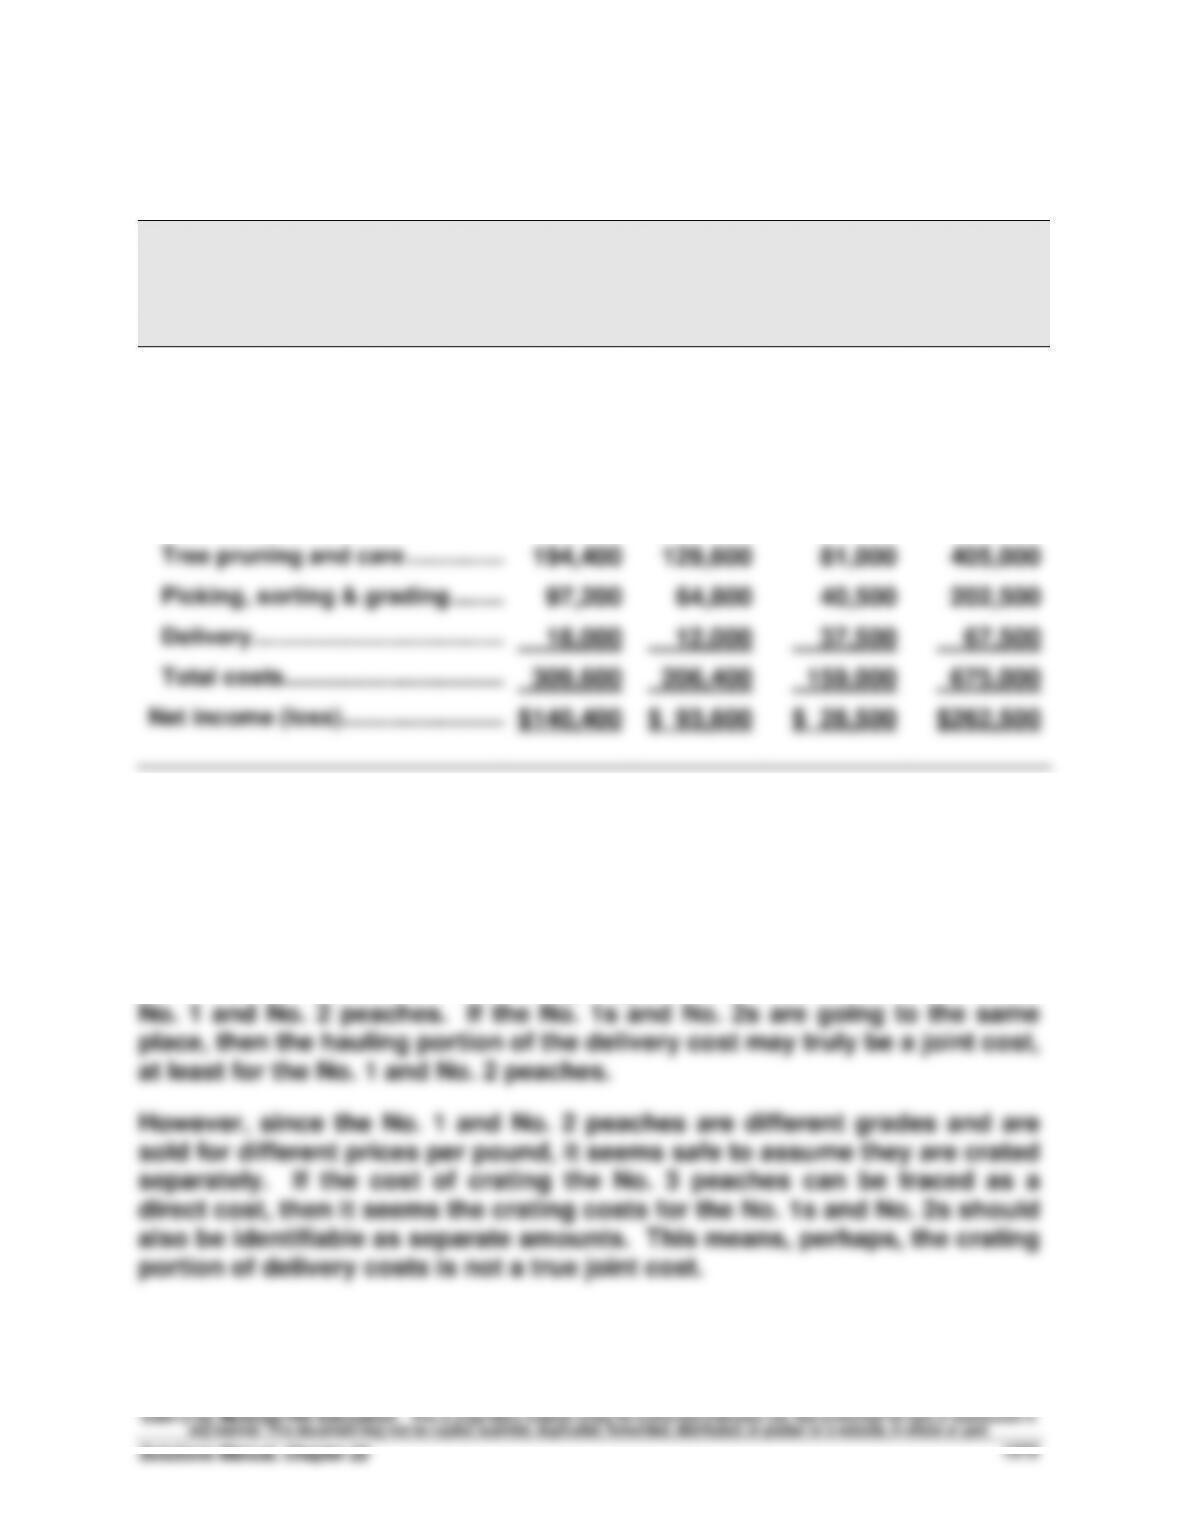
GEORGIA ORCHARDS
Income Statement
For Year Ended December 31, 2013
No. 1
No. 2
No. 3
Combined
Sales (by grade)
No. 1: 300,000 lbs. @ $1.50 …….…..
$450,000
No. 2: 300,000 lbs. @ $1.00 …….…..
$300,000
No. 3: 750,000 lbs. @ $0.25 …….…..
$187,500
Total sales …………………………….…..
$937,500
Costs
Tree pruning and care ………………..
194,400
129,600
81,000
405,000
Picking, sorting & grading ……..…..
97,200
64,800
40,500
202,500
Delivery ……………………………………..
18,000
12,000
37,500
67,500
Total costs …………………………….…..
309,600
206,400
159,000
675,000
Net income (loss) …………………….…..
$140,400
$ 93,600
$ 28,500
$262,500
Part 3
Delivery costs include both crating and hauling costs. Georgia is able to
identify the portion of the cost directly related to the No. 3 peaches,
presumably because the No. 3s are going to a different destination than the
Financial & Managerial Accounting, 5th Edition
1274
Problem 22-5A (15 minutes)
Part 1
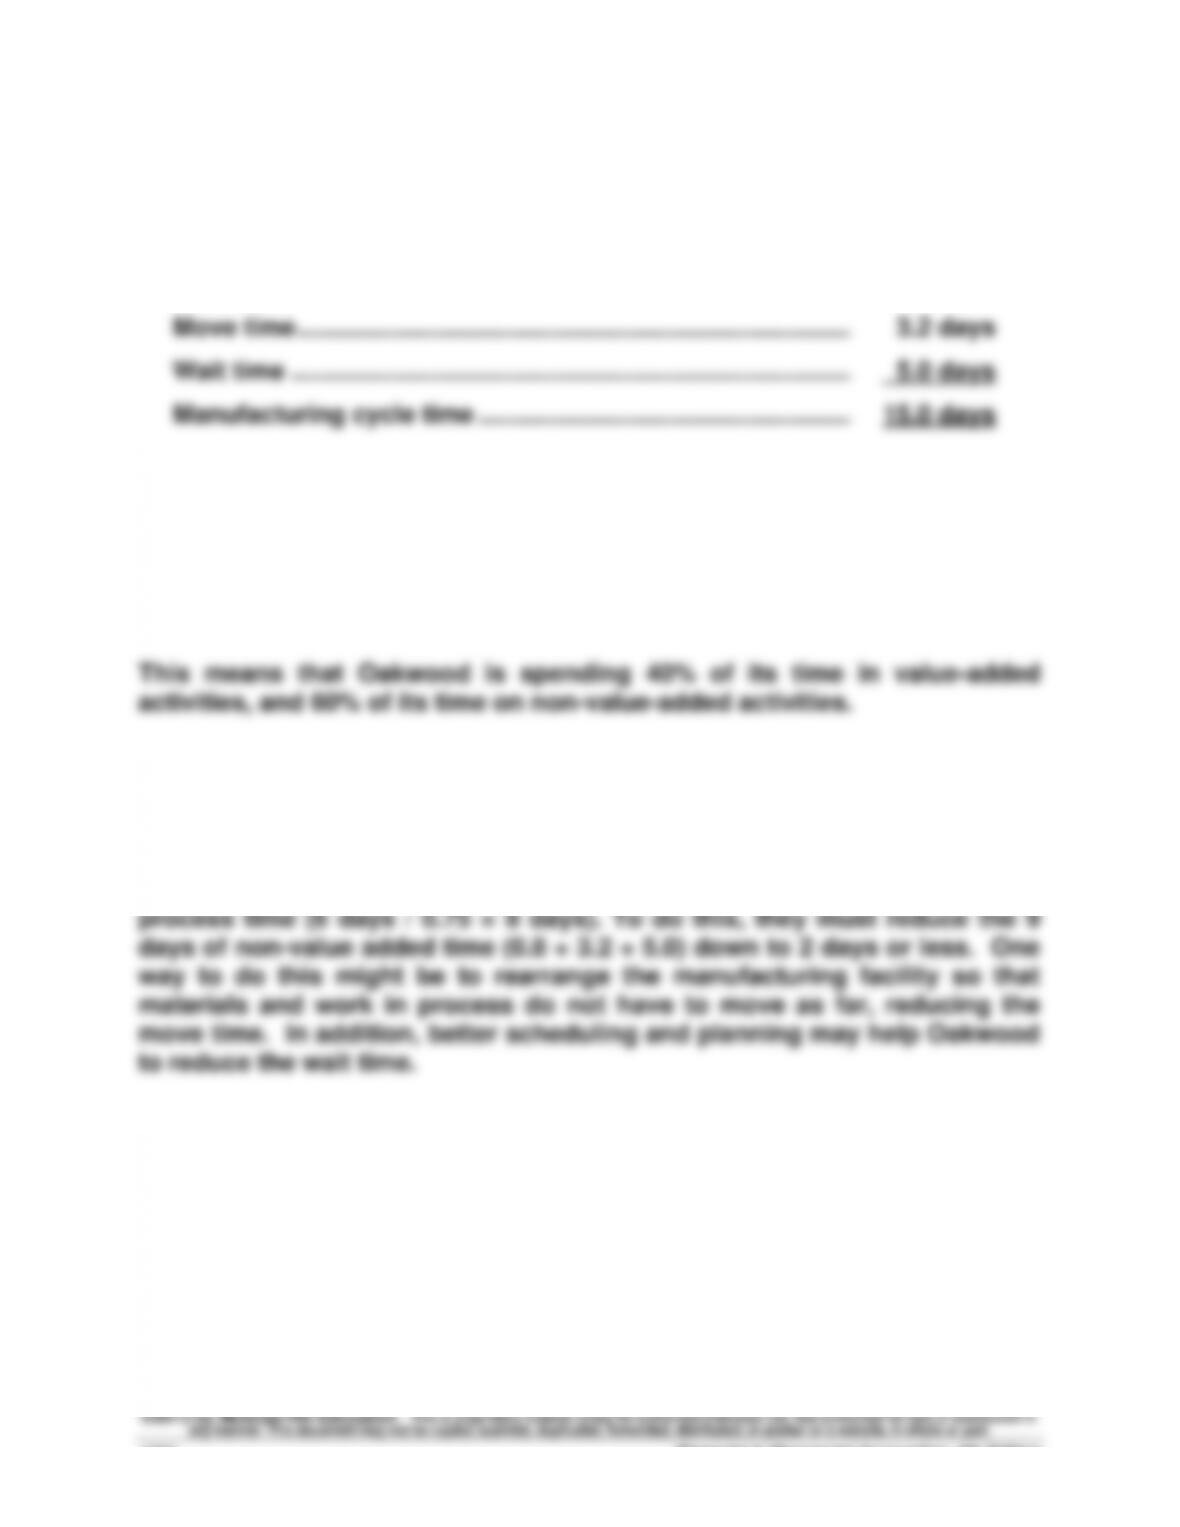
Process time ……………………………………………………………………
6.0 days
Inspection time ……………………………………………………………..…
0.8 days
Move time ……………………………………………………………………..…
3.2 days
Wait time …………………………………………………………………………
5.0 days
Manufacturing cycle time …………………………..………………….…
15.0 days
Part 2
Manufacturing cycle efficiency (6.0 days/ 15.0 days) …………
0.40
Part 3
To increase the manufacturing cycle efficiency to 0.75, Oakwood needs to
reduce the total manufacturing cycle time to 8 days without changing the
Problem 22-6A (45 minutes)
Part 1
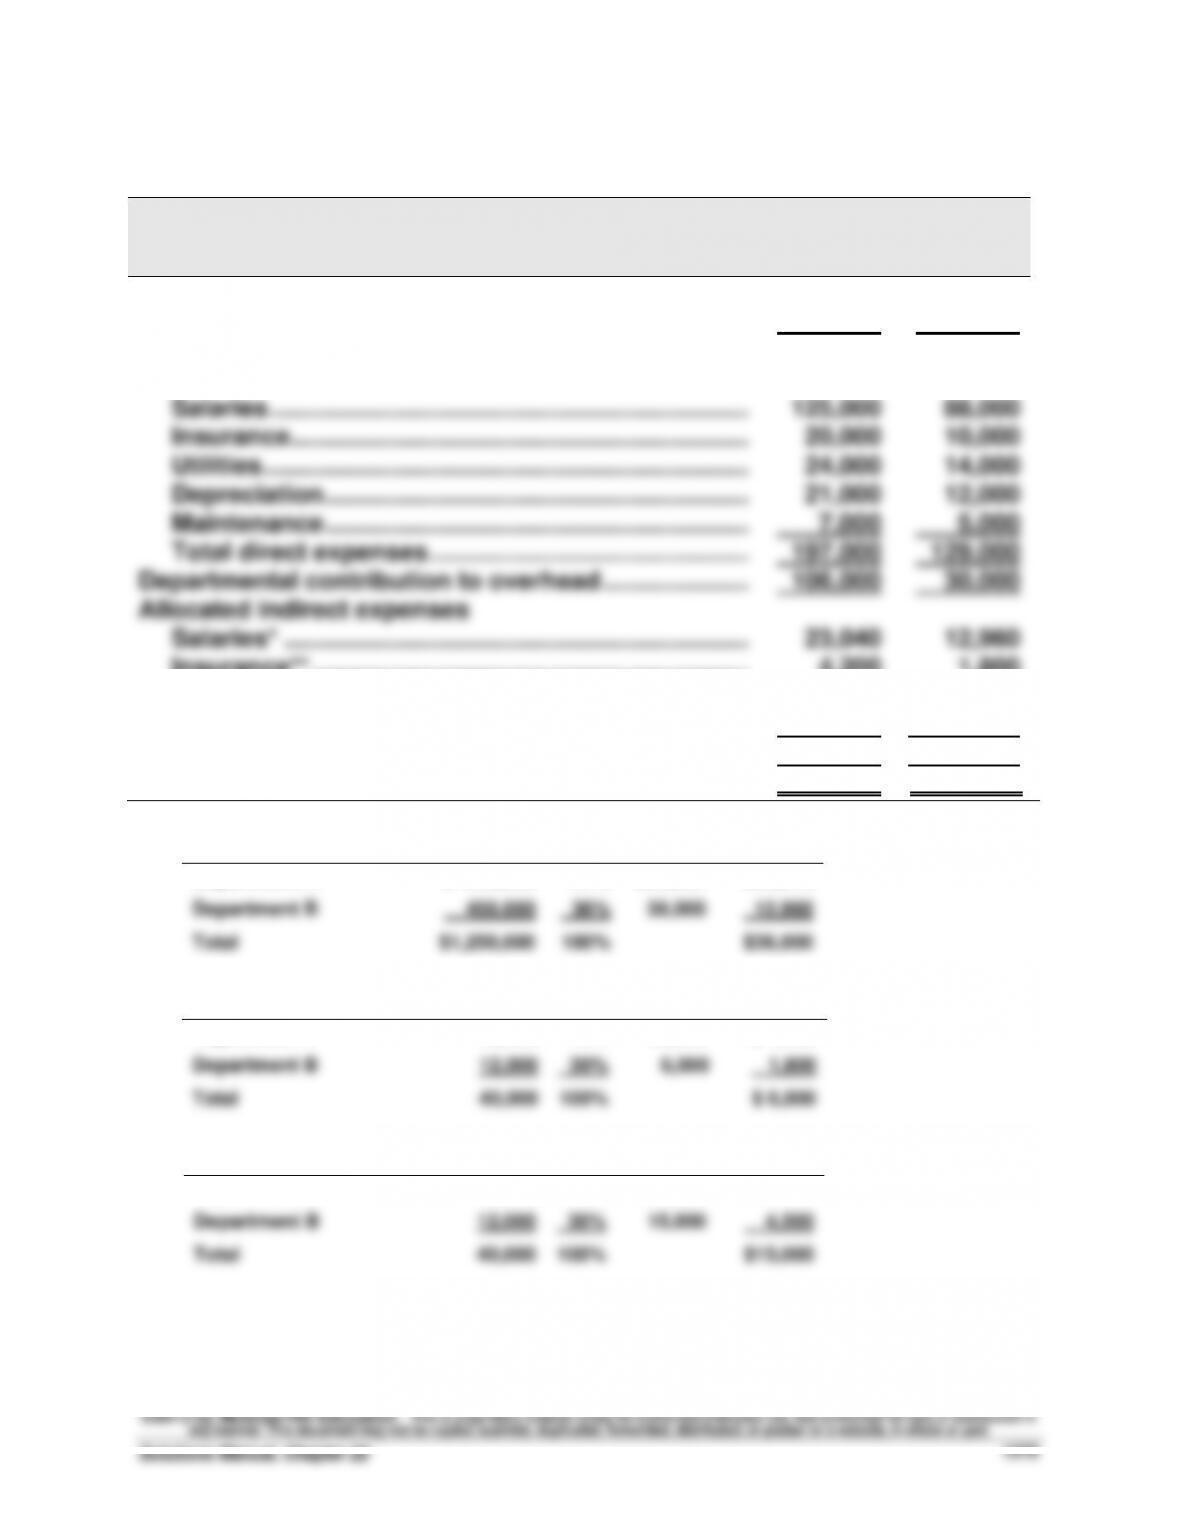
Vortex Company
Departmental Income Statements
Dept. A
Dept. B
Sales ……………………………………………………………………
$800,000
$450,000
Cost of goods sold ……………………………………………….
497,000
291,000
Gross margin ……………………………………………………….
303,000
159,000
Direct expenses
Salaries ……………………………………………………………
125,000
88,000
Insurance ………………………………………………………...
20,000
10,000
Utilities …………………………………………………………….
24,000
14,000
Depreciation …………………………………………………….
21,000
12,000
Maintenance …………………………………………………….
7,000
5,000
Total direct expenses ……………………………………….
197,000
129,000
Departmental contribution to overhead …………………
106,000
30,000
Allocated indirect expenses
Salaries* ………………………………………………………….
23,040
12,960
Insurance** ………………………………………………………
4,200
1,800
Depreciation*** …………………………………………………
10,500
4,500
Office expenses**** ………………………………………….
30,000
20,000
Total allocated indirect expenses ……………………..
67,740
39,260
Departmental net income …………………………..…………
$ 38,260
$ (9,260)
*
Salaries allocation:
Sales
%
Amount
Allocated
Department A
$ 800,000
64%
$36,000
$23,040
Department B
450,000
36%
36,000
12,960
Total
$1,250,000
100%
$36,000
**
Insurance allocation:
Sq. ft.
%
Amount
Allocated
Department A
28,000
70%
$6,000
$ 4,200
Department B
12,000
30%
6,000
1,800
Total
40,000
100%
$ 6,000
***
Depreciation allocation:
Sq. ft.
%
Amount
Allocated
Department A
28,000
70%
$15,000
$10,500
Department B
12,000
30%
15,000
4,500
Total
40,000
100%
$15,000
Financial & Managerial Accounting, 5th Edition
1276
P
Problem 22-6A (Concluded)
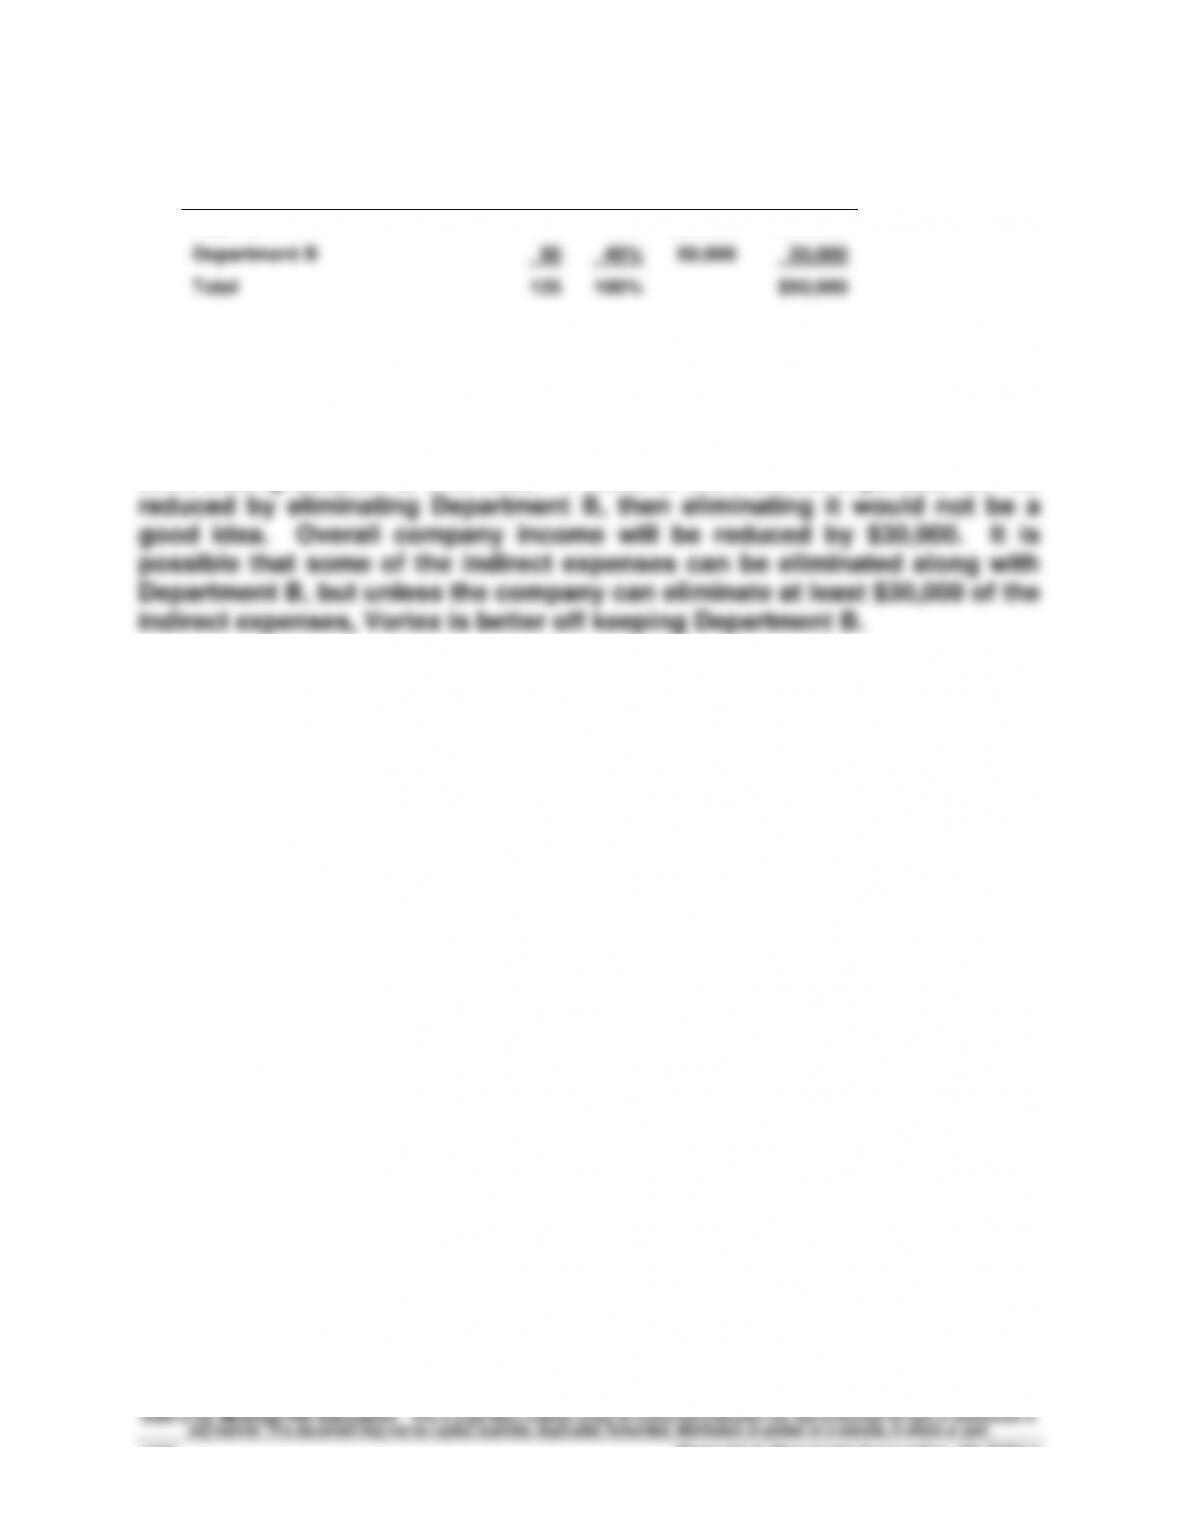
****
Office expense allocation:
Employees
%
Amount
Allocated
Department A
75
60%
$50,000
$30,000
Department B
50
40%
50,000
20,000
Total
125
100%
$50,000
Part 2
Although Department B has a negative departmental income, it is
contributing $30,000 to overhead. If none of the indirect expenses can be
PROBLEM SET B
Problem 22-1B (60 minutes)
Part 1
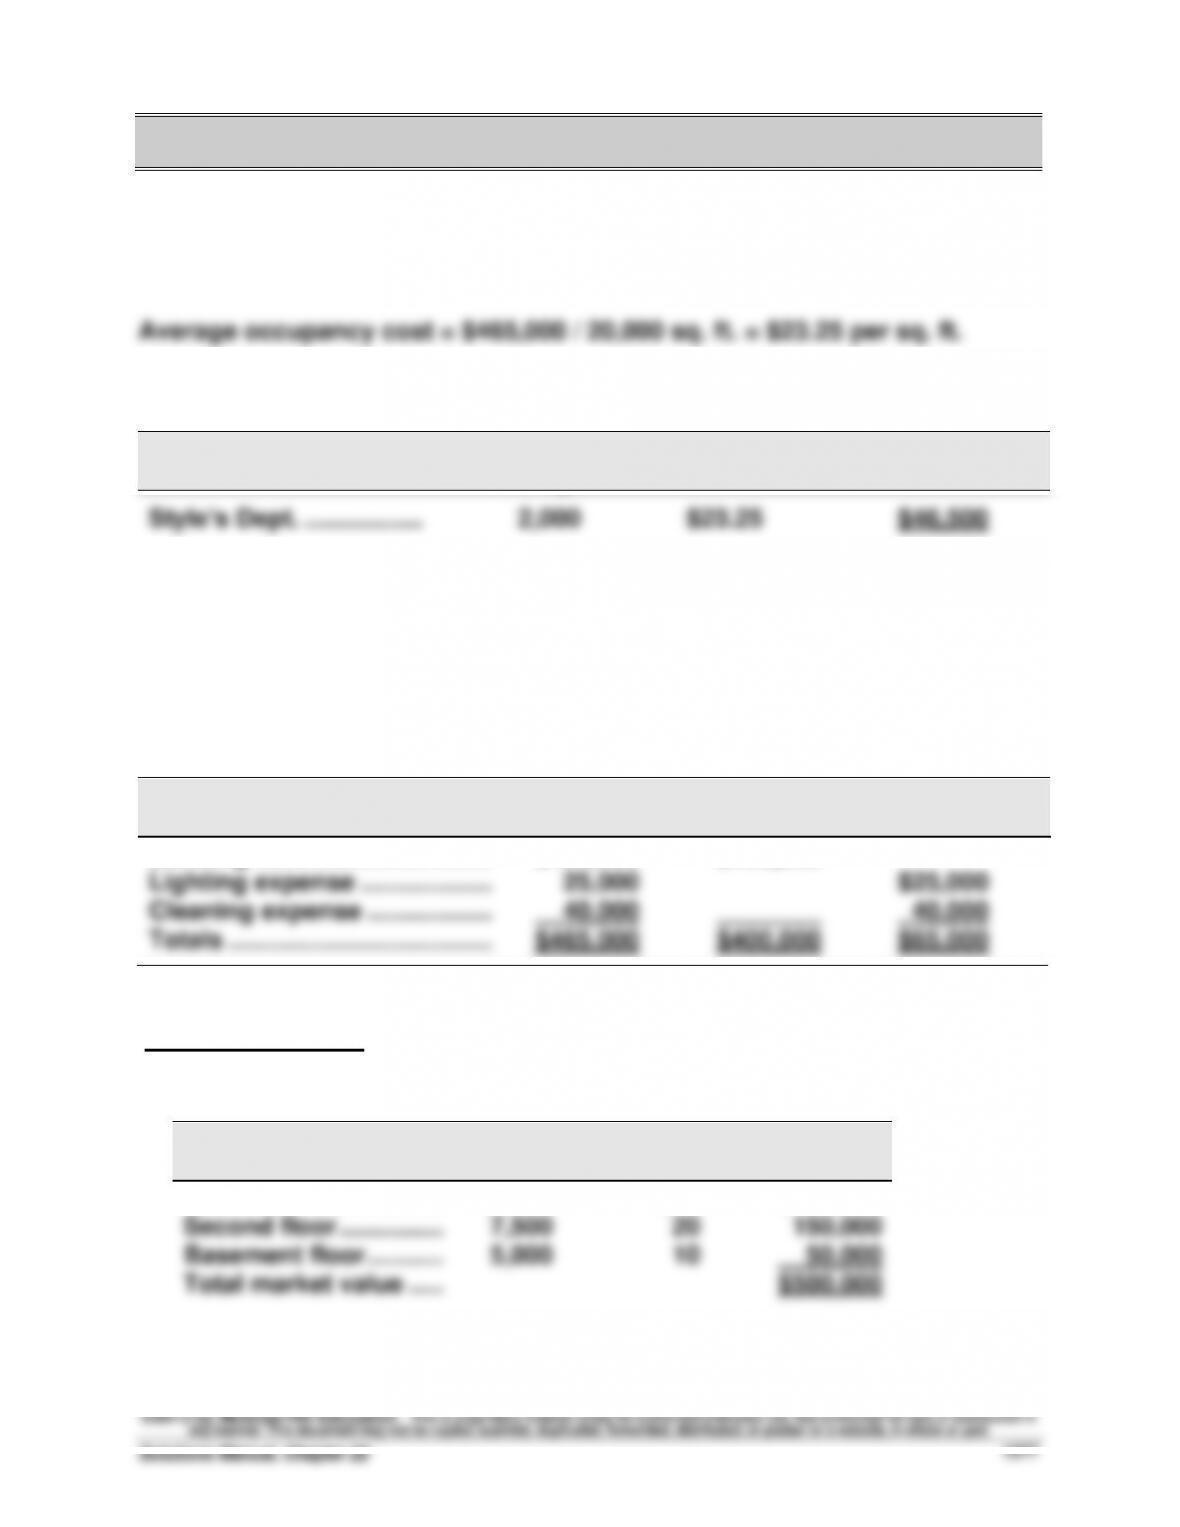
These costs are assigned to Style’s department as follows
Department
Square
Footage
Rate
Total
Style’s Dept. ……………..
2,000
$23.25
$46,500
Part 2
Market rates are used to allocate occupancy costs for the building rent.
Lighting and cleaning costs are allocated to the departments on all three
floors at the average rate per square foot. Costs assigned to each class are:
Occupancy Costs
Total
Costs
Value-Based
Costs
Usage–Based
Costs
Building rent ………………………
$400,000
$400,000
Lighting expense ……………….
25,000
$25,000
Cleaning expense ………………
40,000
_______
40,000
Totals …………………………..……
$465,000
$400,000
$65,000
Value-based costs are allocated in two steps
(i) Compute market value of each floor
Floor
Square
Footage
Value per
Sq. Ft.
Total
First floor ………………..…………
7,500
$40
$300,000
Second floor ………………………
7,500
20
150,000
Basement floor ………..…………
5,000
10
50,000
Total market value …..…………
$500,000
Financial & Managerial Accounting, 5th Edition
1278
Problem 22–1B (Continued)
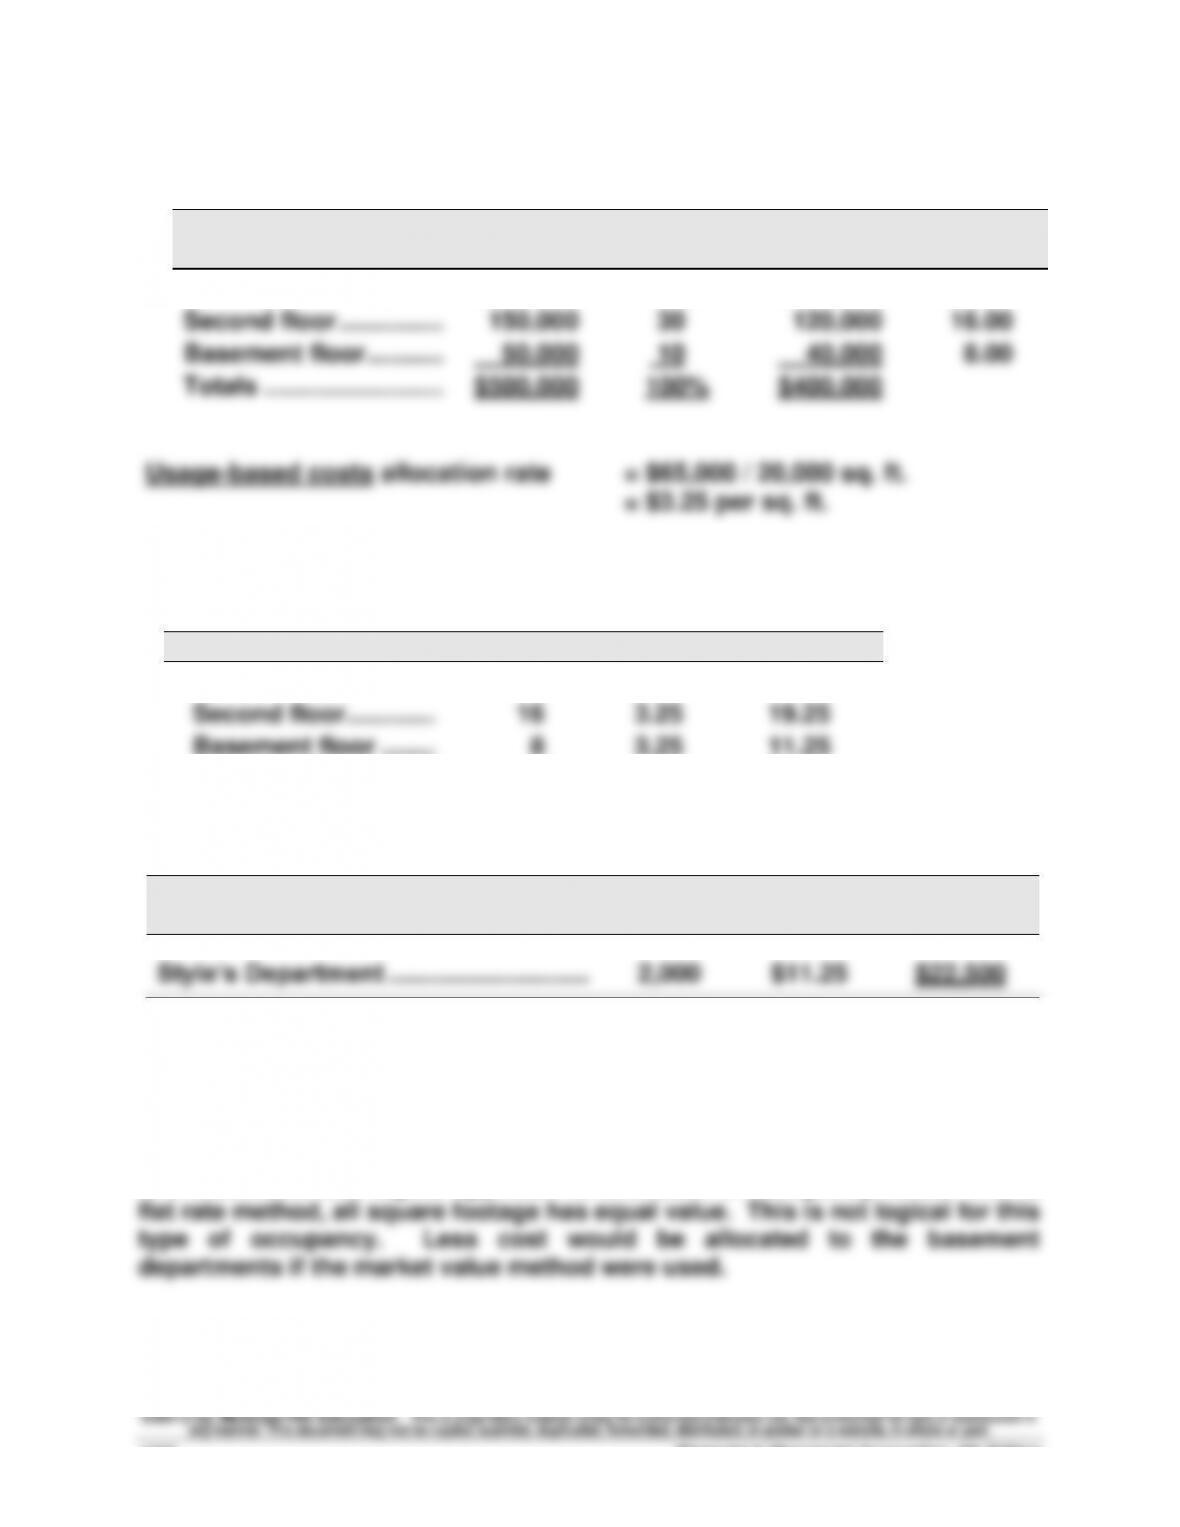
(ii) Allocate the $400,000 to each floor based on its percent of market value
Floor
Market
Value
% of
Total
Allocated
Cost
Cost per
Sq. Ft.
First floor ………………..…………
$300,000
60%
$240,000
$32.00
Second floor ………………………
150,000
30
120,000
16.00
Basement floor ………..…………
50,000
10
40,000
8.00
Totals ……………………..……
$500,000
100%
$400,000
Usage-based costs allocation rate = $65,000 / 20,000 sq. ft.
= $3.25 per sq. ft.
Total allocation rates for the departments on all three floors are
Floor
Value
Usage
Total
First floor …………………………
$32
$3.25
$35.25
Second floor ………….…………
16
3.25
19.25
Basement floor ……..…………
8
3.25
11.25
These rates are applied to allocate occupancy costs to Style’s department
Department
Square
Footage
Rate
Total
Style’s Department ………………………..…
2,000
$11.25
$22,500
Part 3
A basement manager would prefer the allocation based on market value. This
is a reasonable and logical approach to allocation of occupancy costs. With a
Problem 22-2B (70 minutes)
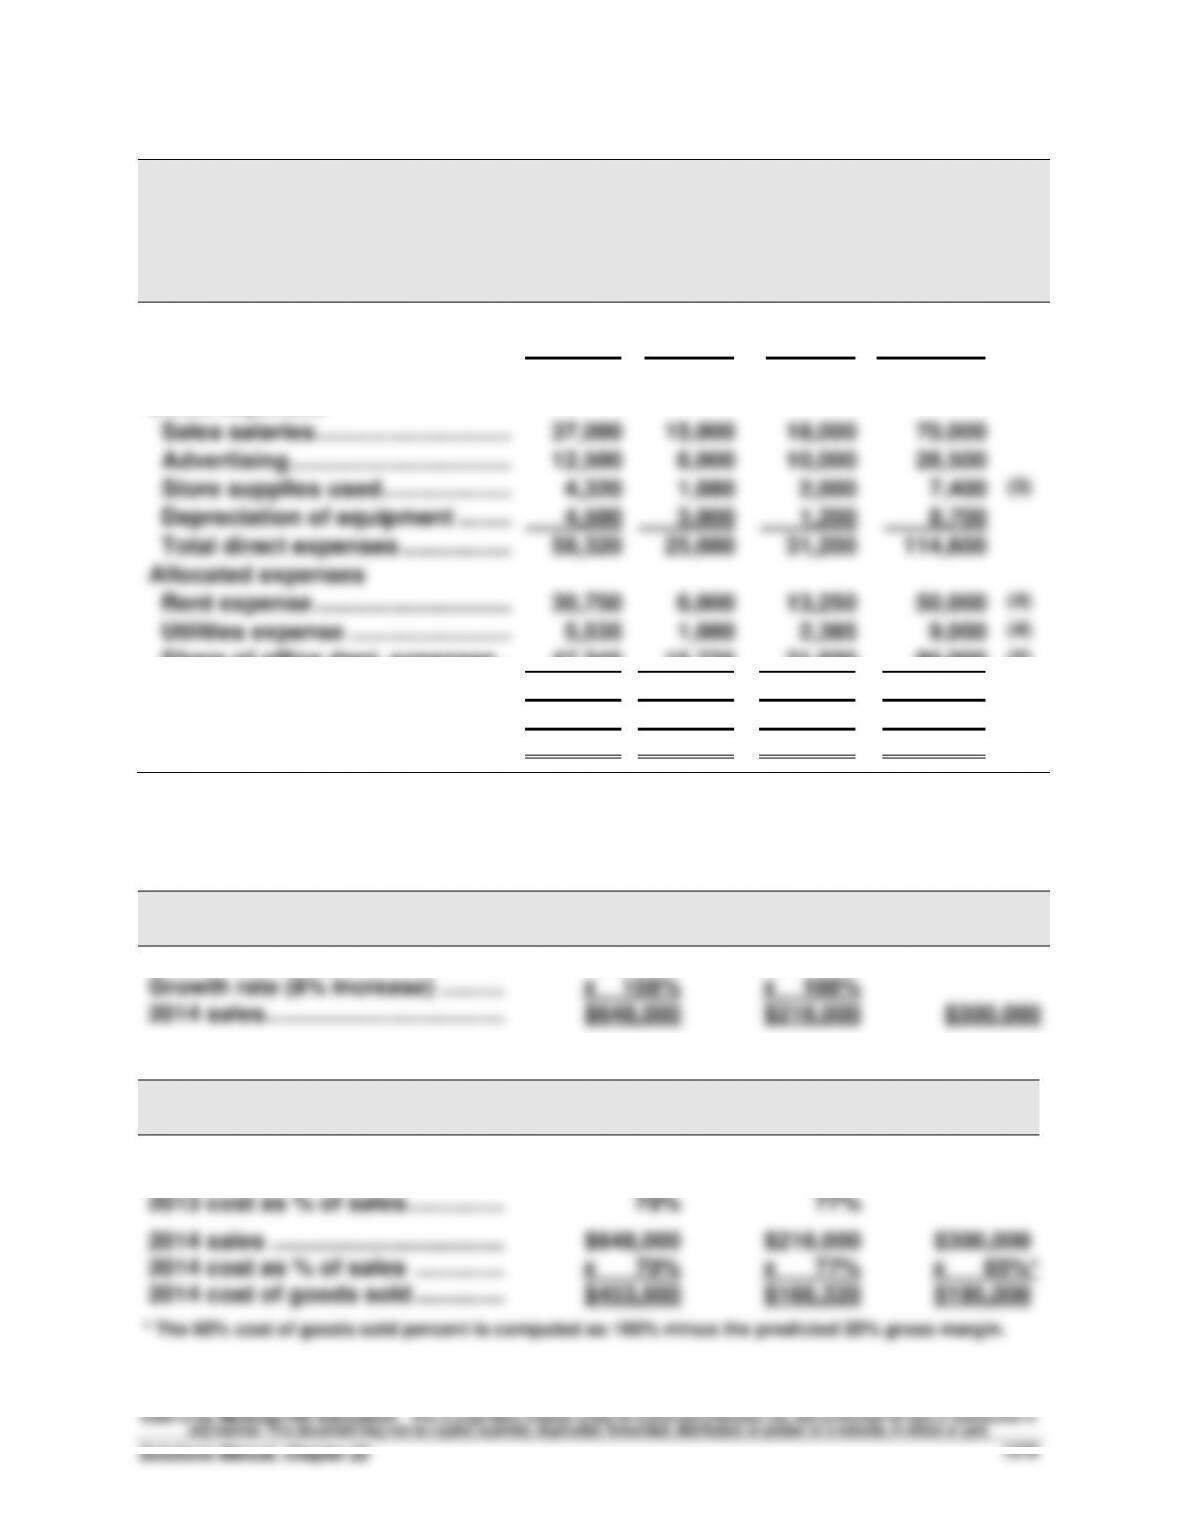
BONANZA ENTERTAINMENT
Forecasted Departmental Income Statements
For Year Ended December 31, 2014
Movies
Video
Games
Compact
Discs
Combined
Sales ………………………………………..
$648,000
$216,000
$300,000
$1,164,000
(1)
Cost of goods sold …………………...
453,600
166,320
195,000
814,920
(2)
Gross profit ……………………………...
194,400
49,680
105,000
349,080
Direct expenses
Sales salaries ………………………….
37,000
15,000
18,000
70,000
Advertising ……………………………..
12,500
6,000
10,000
28,500
Store supplies used ………………...
4,320
1,080
2,000
7,400
(3)
Depreciation of equipment ……...
4,500
3,000
1,200
8,700
Total direct expenses ……………...
58,320
25,080
31,200
114,600
Allocated expenses
Rent expense ………………………….
30,750
6,000
13,250
50,000
(4)
Utilities expense ……………………..
5,535
1,080
2,385
9,000
(4)
Share of office dept. expenses ...
47,345
15,725
21,930
85,000
(5)
Total allocated expenses ………...
83,630
22,805
37,565
144,000
Total expenses ………………………….
141,950
47,885
68,765
258,600
Net income ……………………………….
$ 52,450
$ 1,795
$ 36,235
$ 90,480
Supporting Computations—coded (1) through (5) in statement above
Note 1 (Sales)
Movies
Video
Games
Compact
Discs
2013 sales ……………………………….
$600,000
$200,000
Growth rate (8% increase) ……….
x 108%
x 108%
2014 sales ……………………………….
$648,000
$216,000
$300,000
Note 2 (Cost of Goods Sold)
Movies
Video
Games
Compact
Discs
2013 cost of goods sold …………..
$420,000
$154,000
2013 sales ……………………………….
$600,000
$200,000
2013 cost as % of sales ……………
70%
77%
2014 sales ………………………………
$648,000
$216,000
$300,000
2014 cost as % of sales …………..
x 70%
x 77%
x 65%*
2014 cost of goods sold …………..
$453,600
$166,320
$195,000
* The 65% cost of goods sold percent is computed as 100% minus the predicted 35% gross margin.
Problem 22-2B (Continued)
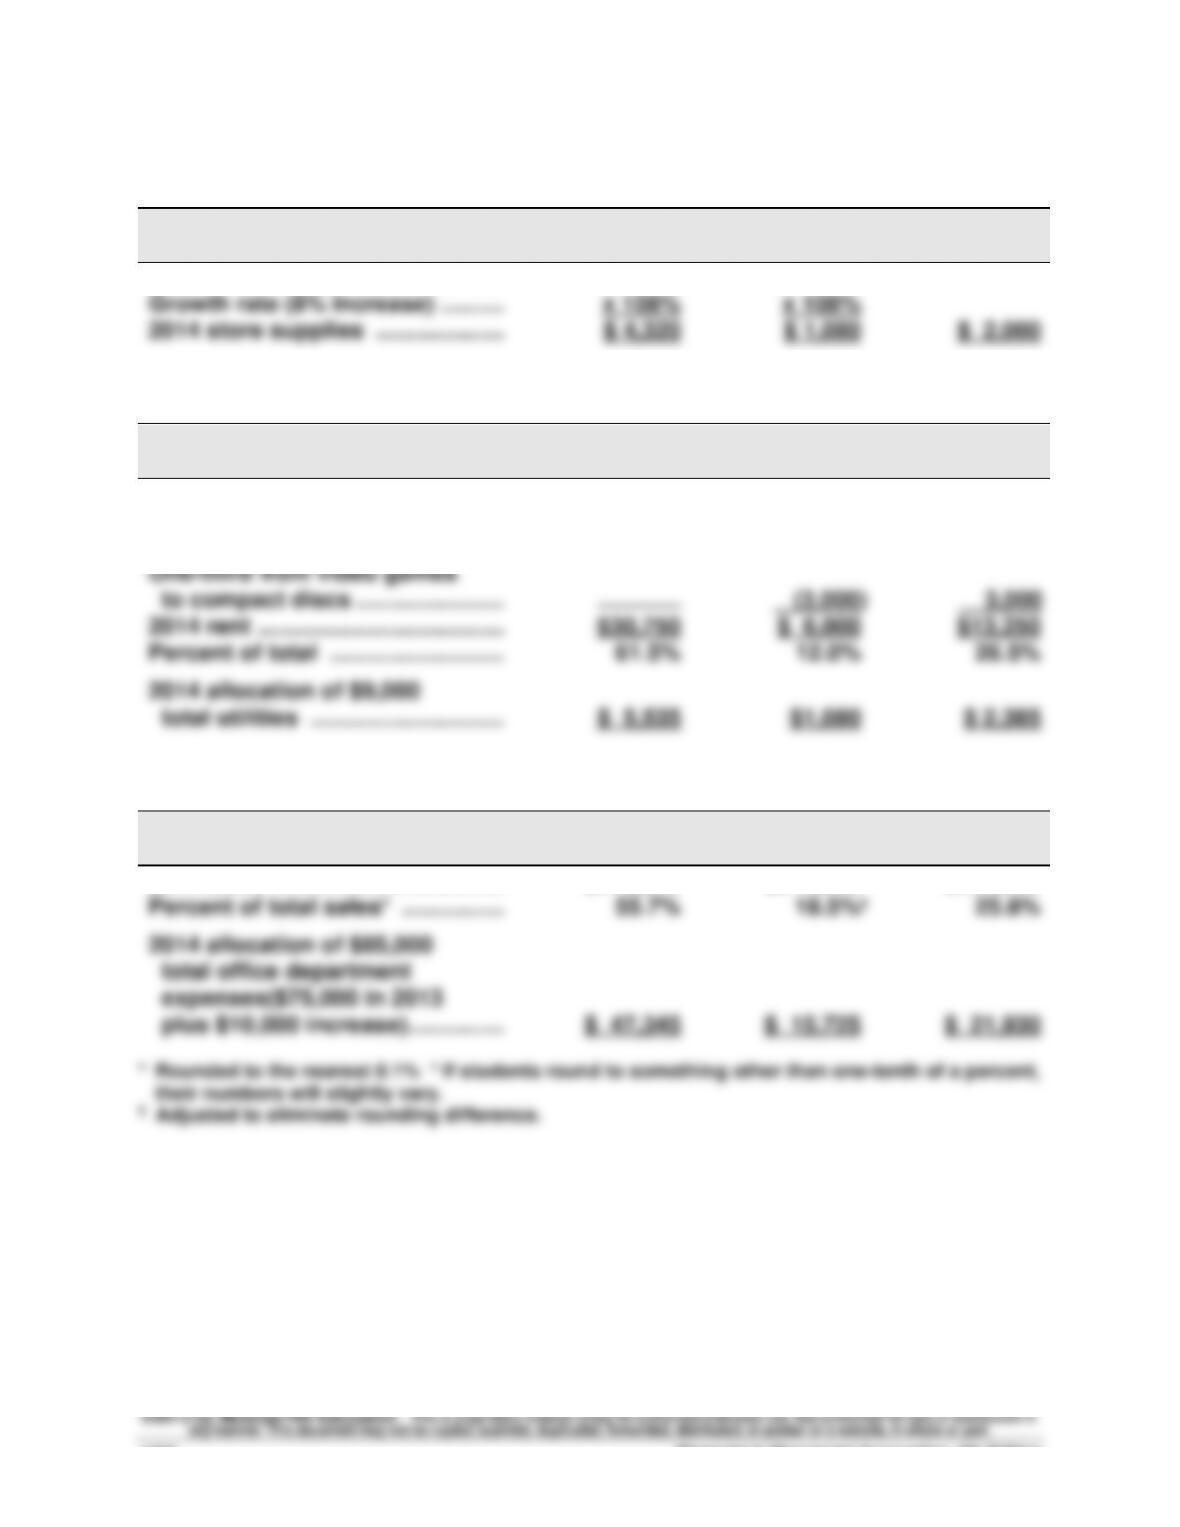
Note 3 (Store Supplies Used)
Movies
Video
Games
Compact
Discs
2013 store supplies used ………..
$ 4,000
$ 1,000
Growth rate (8% increase) ……….
x 108%
x 108%
2014 store supplies ………………..
$ 4,320
$ 1,080
$ 2,000
Note 4 (Rent and Utilities)
Movies
Video
Games
Compact
Discs
2013 rent ………………………………..
$41,000
$ 9,000
One-fourth from movies to
compact discs ……………………….
(10,250)
$10,250
One-third from video games
to compact discs …………………..
_______
(3,000)
3,000
2014 rent ………………………………..
$30,750
$ 6,000
$13,250
Percent of total ………………………
61.5%
12.0%
26.5%
2014 allocation of $9,000
total utilities …………………………
$ 5,535
$1,080
$ 2,385
Note 5 (Office Department Expenses)
Movies
Video
Games
Compact
Discs
2014 sales ………………………………
$648,000
$216,000
$300,000
Percent of total sales* …………….
55.7%
18.5%†
25.8%
2014 allocation of $85,000
total office department
expenses($75,000 in 2013
plus $10,000 increase) ……………
$ 47,345
$ 15,725
$ 21,930
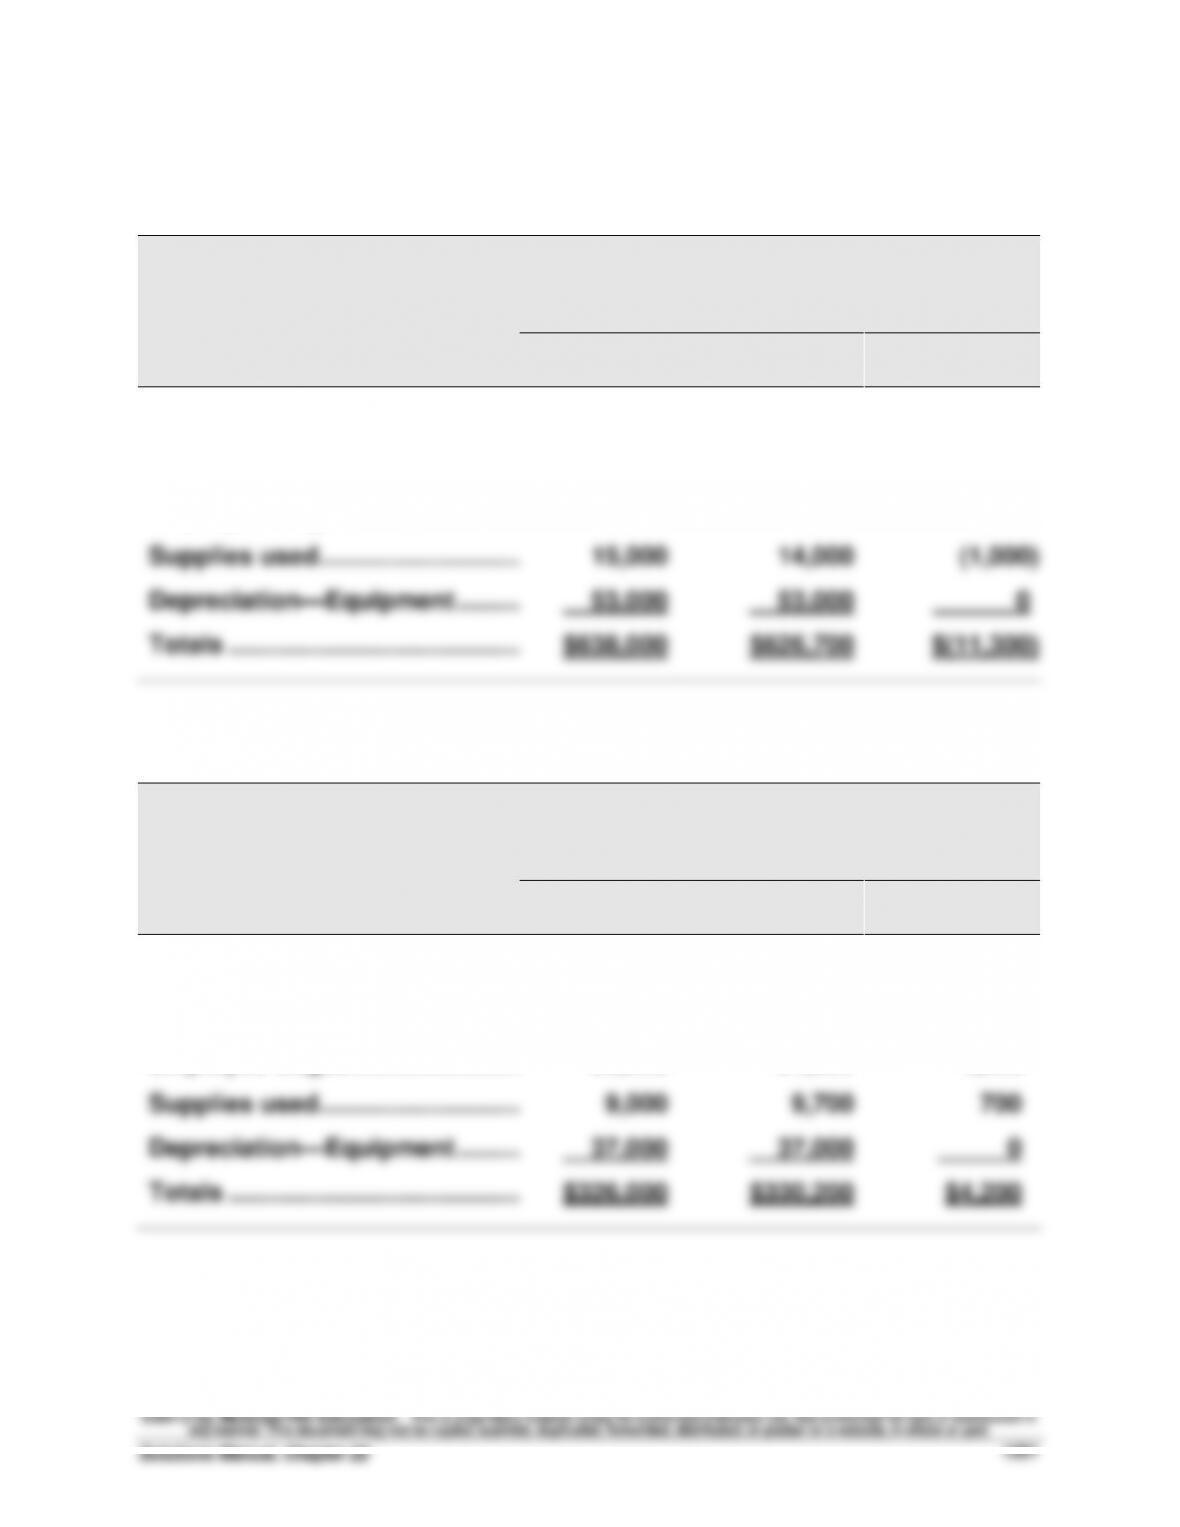
Problem 22-3B (50 minutes)
Part 1
a.
Responsibility Accounting Performance Report
Dept. Manager, Refrigerator Department
For the Month of April
Budgeted
Actual
Over (Under)
Amount
Amount
Budget
Controllable Costs
Raw materials ………………………..…
$400,000
$385,000
$(15,000)
Employee wages ………………………
170,000
174,700
4,700
Supplies used ………………………..…
15,000
14,000
(1,000)
Depreciation—Equipment …………
53,000
53,000
0
Totals …………………………..……….…
$638,000
$626,700
$(11,300)
b.
Responsibility Accounting Performance Report
Dept. Manager, Dishwasher Department
For the Month of April
Budgeted
Actual
Over (Under)
Amount
Amount
Budget
Controllable Costs
Raw materials ………………………..…
$200,000
$202,000
$ 2,000
Employee wages …………………………
80,000
81,500
1,500
Supplies used ………………………..…
9,000
9,700
700
Depreciation—Equipment ……………
37,000
37,000
0
Totals …………………………..……….……
$326,000
$330,200
$4,200
Financial & Managerial Accounting, 5th Edition
1282
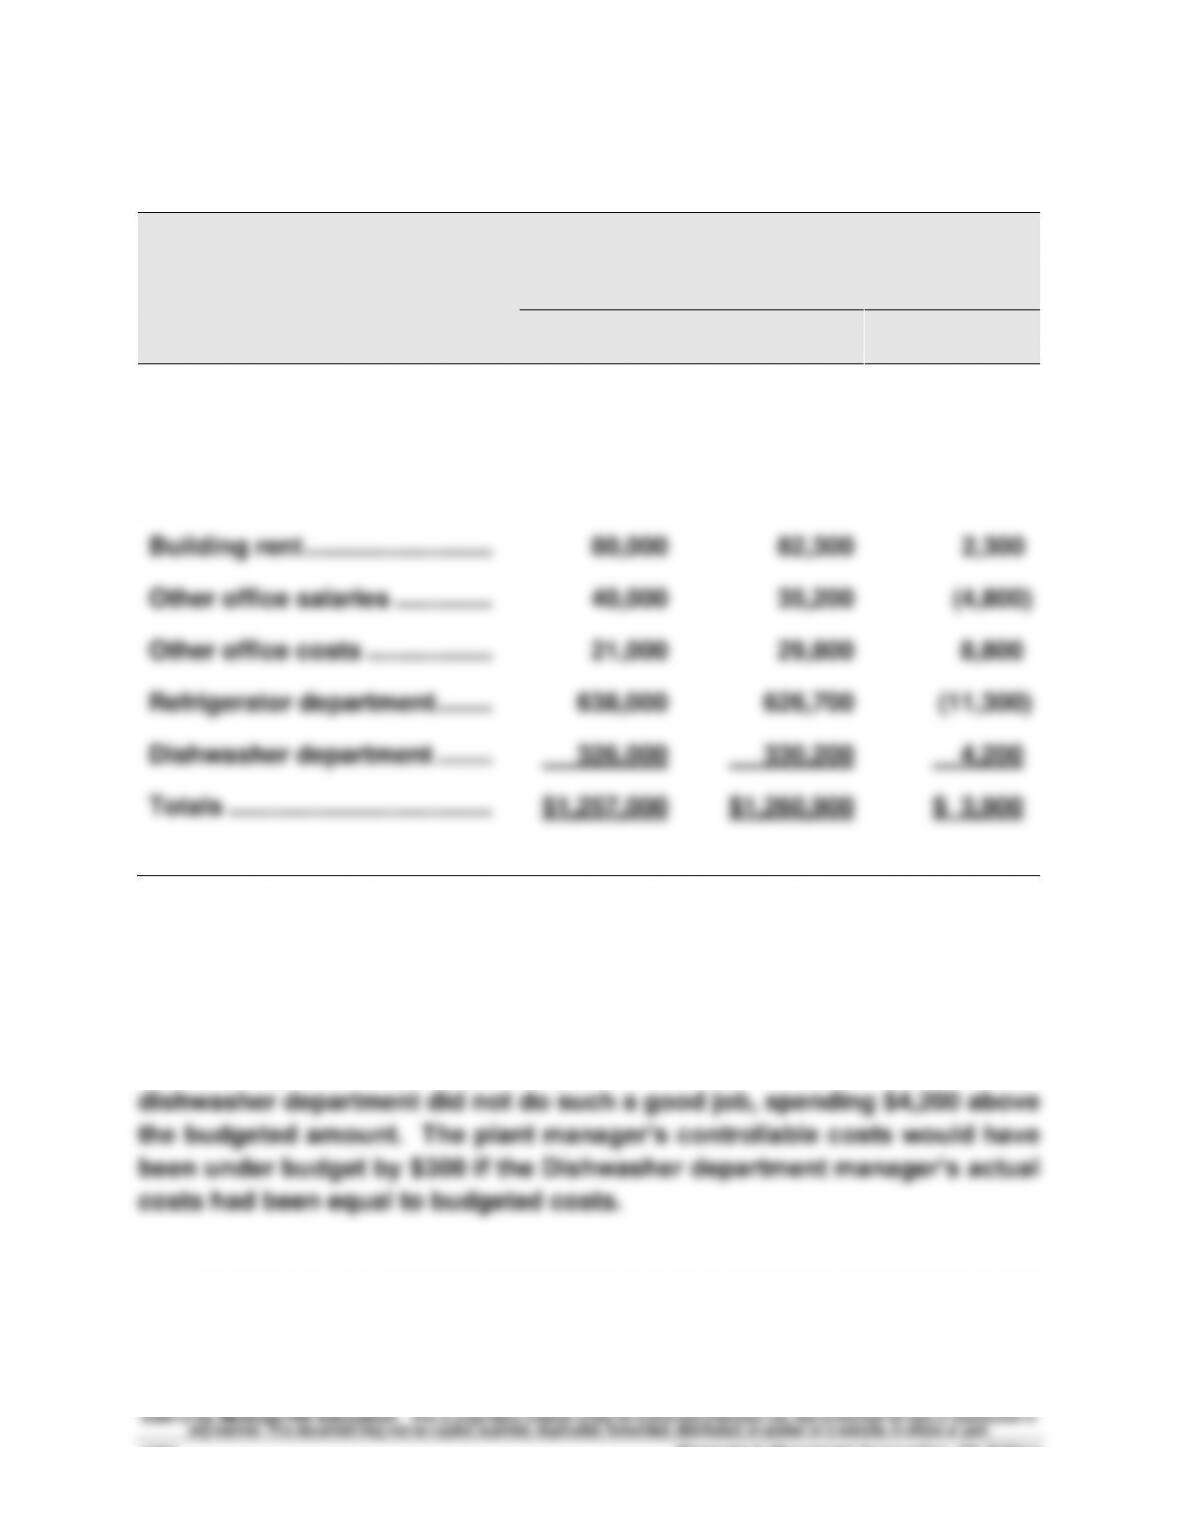
Problem 22-3B (Continued)
c.
Responsibility Accounting Performance Report
Plant Manager, Chicago Plant
For the Month of April
Budgeted
Actual
Over (Under)
Amount
Amount
Budget
Controllable Costs
Dept. manager salaries ………
$ 104,000
$ 101,500
$ (2,500)
Utilities ………………………………
48,000
55,200
7,200
Building rent ………………………
80,000
82,300
2,300
Other office salaries …………..
40,000
35,200
(4,800)
Other office costs ………………
21,000
29,800
8,800
Refrigerator department ……..
638,000
626,700
(11,300)
Dishwasher department ……..
326,000
330,200
4,200
Totals …………………………..……
$1,257,000
$1,260,900
$ 3,900
Part 2
The refrigerator department manager did a good job of controlling costs
and meeting the budget, spending $11,300 below budget. However, the
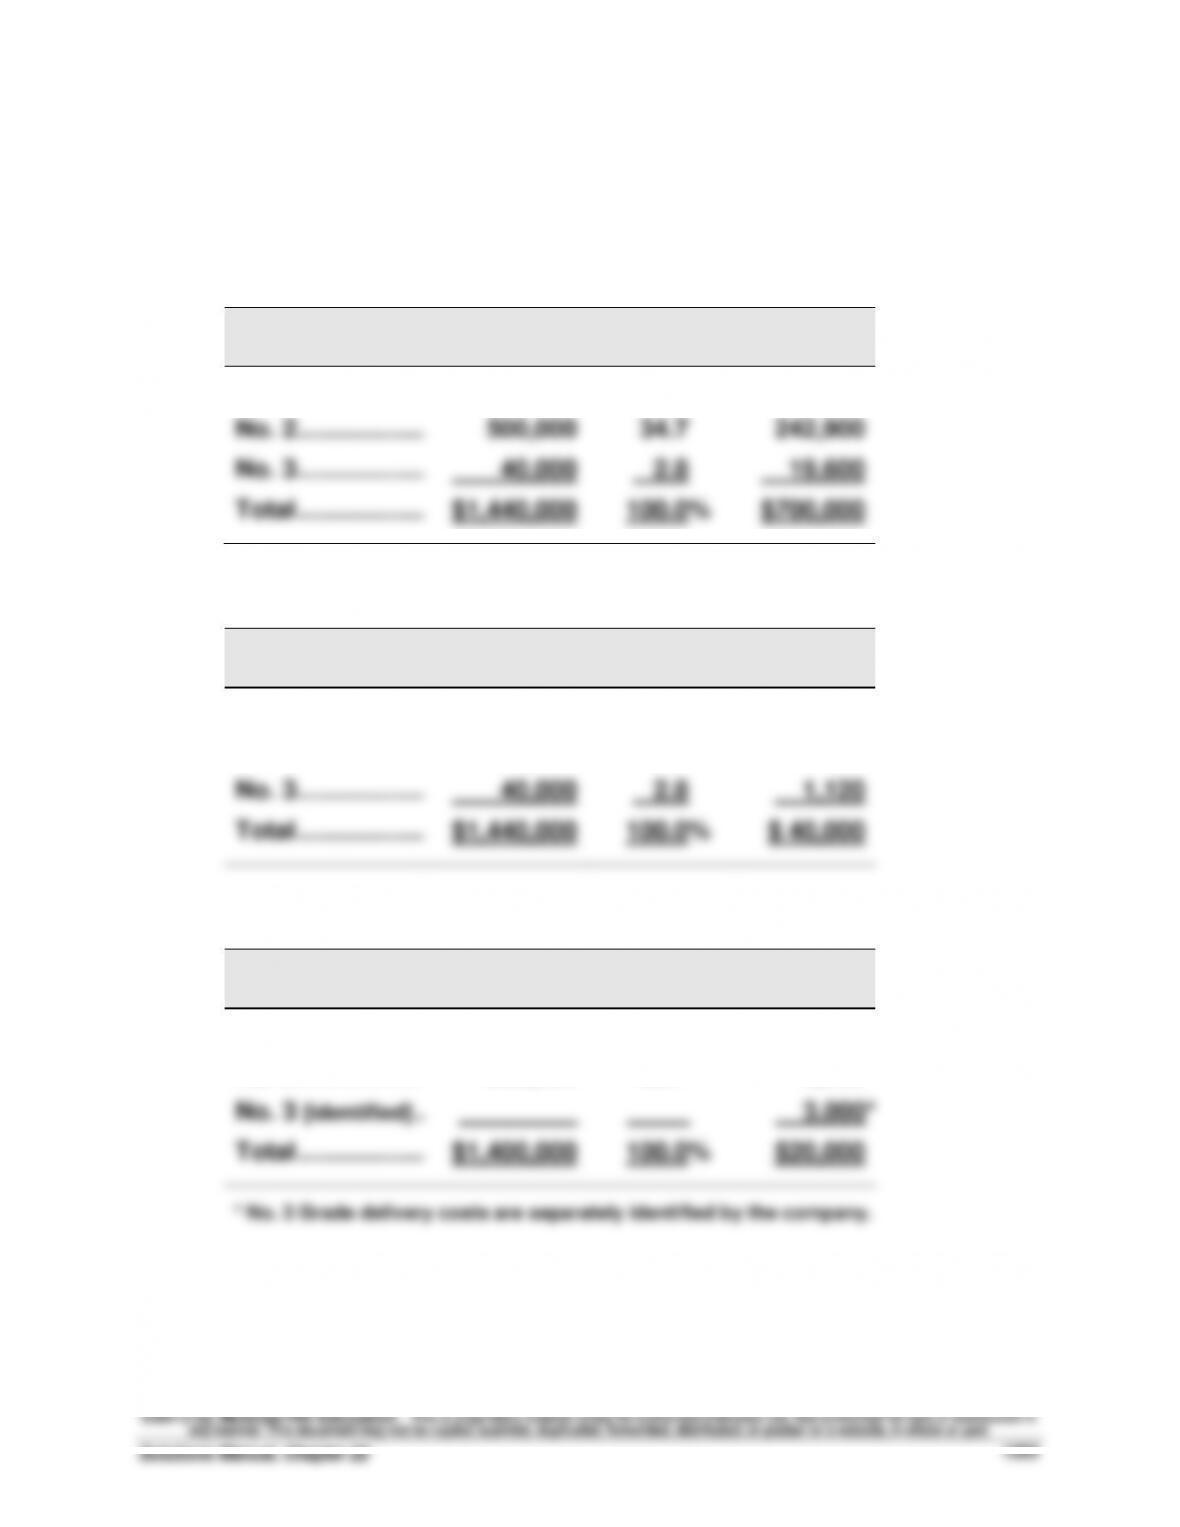
Problem 22–4BB (60 minutes)
Part 1
Allocations of joint cost on the basis of sales values
Land preparation, seeding, and cultivating: $700,000
Grade
Sales
Value
Percent of
Total
Allocated
Cost
No. 1 ……………….…………
$ 900,000
62.5%
$437,500
No. 2 ……………….…………
500,000
34.7
242,900
No. 3 ……………….…………
40,000
2.8
19,600
Total ……………….…………
$1,440,000
100.0%
$700,000
Harvesting, sorting, and grading: $40,000
Grade
Sales
Value
Percent
of Total
Allocated
Cost
No. 1 ……………….…………
$ 900,000
62.5%
$ 25,000
No. 2 ……………….…………
500,000
34.7
13,880
No. 3 ……………….…………
40,000
2.8
1,120
Total ……………….…………
$1,440,000
100.0%
$ 40,000
Delivery: $17,000 to Grade Nos. 1 & 2
Grade
Sales
Value
Percent
of Total
Allocated
Cost
No. 1 ……………….…………
$ 900,000
64.3%
$10,931
No. 2 ……………….…………
500,000
35.7
6,069
No. 3 [identified] ..…………
___ _____
____
3,000*
Total ……………….…………
$1,400,000
100.0%
$20,000
* No. 3 Grade delivery costs are separately identified by the company.
Financial & Managerial Accounting, 5th Edition
1284
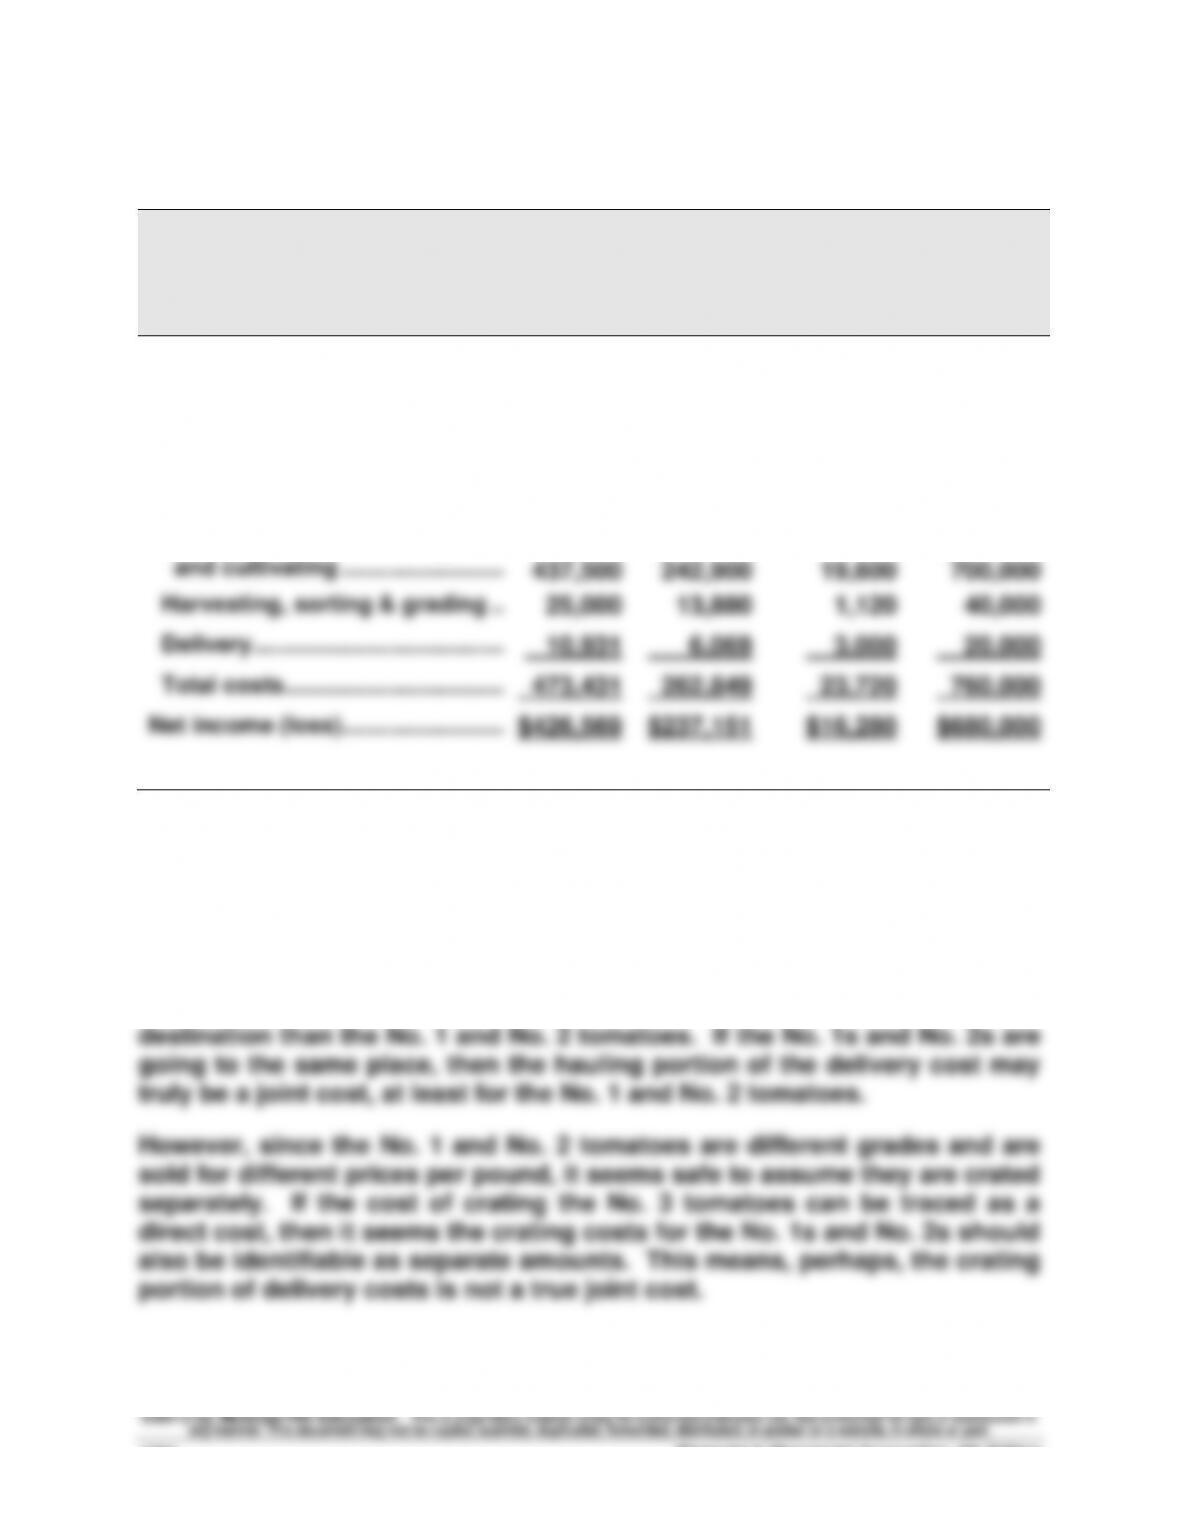
Problem 22-4B (Continued)
Part 2
RITA AND RICK REDDING
Income Statement
For Year Ended December 31, 2013
No. 1
No. 2
No. 3
Combined
Sales (by grade)
No. 1: 500,000 lbs. @ $1.80 …….…
$900,000
No. 2: 400,000 lbs. @ $1.25 …….…
$500,000
No. 3: 100,000 lbs. @ $0.40 …….…
$40,000
Total sales …………………………….…
$1,440,000
Costs
Land preparation, seeding,
and cultivating …………………….…
437,500
242,900
19,600
700,000
Harvesting, sorting & grading ..…
25,000
13,880
1,120
40,000
Delivery ……………………………………
10,931
6,069
3,000
20,000
Total costs …………………………….…
473,431
262,849
23,720
760,000
Net income (loss) …………………….…
$426,569
$237,151
$16,280
$680,000
Part 3
Delivery costs include both crating and hauling costs. The Reddings are
able to identify the portion of the cost directly related to the No. 3
tomatoes, presumably because the No. 3s are going to a different