Chapter 22 Decentralization and Performance Evaluation
Chapter 22
Decentralization and
Performance Evaluation
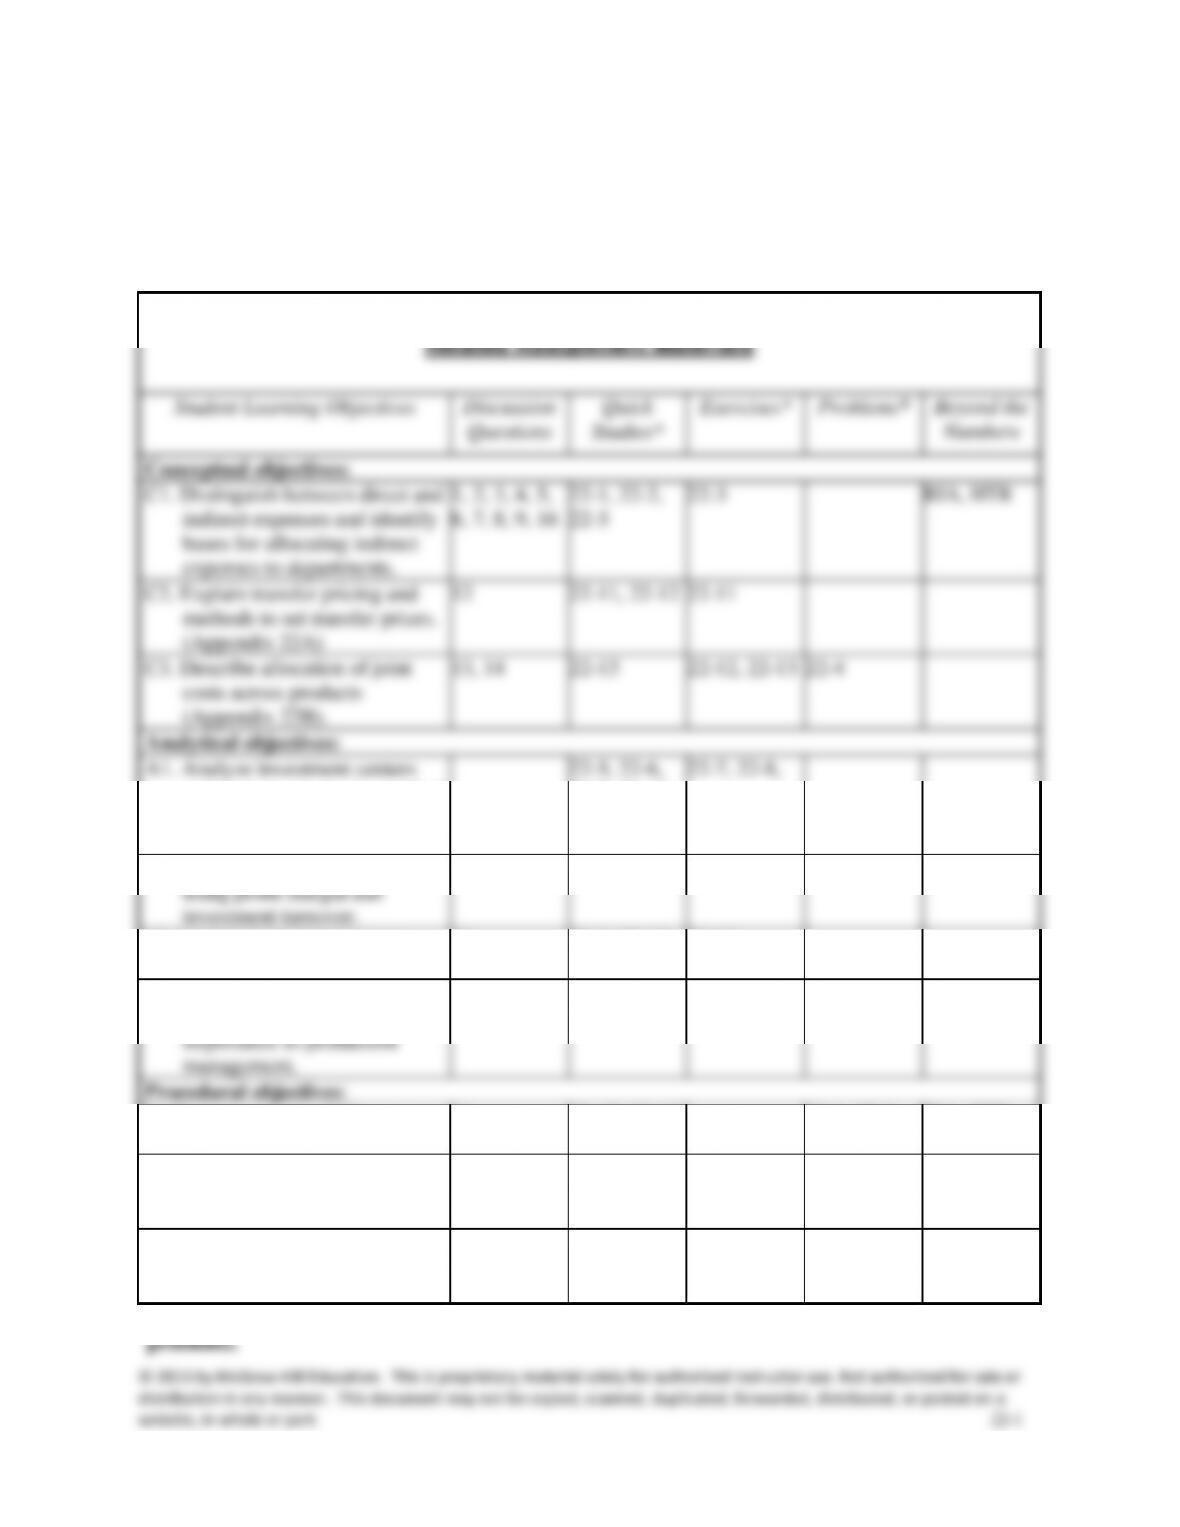
Related Assignment Materials
Student Learning Objectives
Discussion
Questions
Quick
Studies*
Exercises*
Problems*
Beyond the
Numbers
Conceptual objectives:
C1. Distinguish between direct and
indirect expenses and identify
bases for allocating indirect
expenses to departments.
1, 2, 3, 4, 5,
6, 7, 8, 9, 16
22-1, 22-2,
22-3
22-3
RIA, HTR
C2. Explain transfer pricing and
methods to set transfer prices.
(Appendix 22A)
12
22-11, 22-12
22-11
C3. Describe allocation of joint
costs across products
(Appendix 22B).
13, 14
22-13
22-12, 22-13
22-4
Analytical objectives:
A1. Analyze investment centers
using return on assets, residual
income, and balanced
scorecard.
22-5, 22-6,
22-8, 22-15
22-7, 22-8,
A2. Analyze investment centers
using profit margin and
investment turnover.
15
22-7, 22-8
22-9, 22-14
CA
A3. Analyze investment centers
using the balance scorecard.
18
22-9, 22-10
22-10
A4. Compute cycle time and cycle
efficiency, and explain their
importance to production
management.
17, 19, 20
22-16
22-5
Procedural objectives:
P1. Prepare a responsibility report
for a cost center.
11
22-17, 22-18,
22-19
22-1, 22-3,
22-6
TIA, HTR
P2. Allocate indirect expenses to
departments.
22-14
22-1, 22-2,
22-4, 22-5,
22-6
CIP, TTN
P3. Prepare departmental income
statements and contribution
reports.
10
22-3, 22-4,
22-3
22-1, 22-2,
22-3
EC, ED, GD
*See additional information on next page that pertains to these quick studies, exercises and
website, in whole or part. 22-3
5. Service departments provide support to an organization’s
operating departments and do not generate revenues.
B. Departmental Evaluation
1. Prepared for internal managers to help control operations,
responsibility of each operating department.
a. Profit center⎯incurs costs and generates revenues (e.g.
selling department).
b. Cost center⎯incurs cost or expenses without directly
generating revenues (e.g. manufacturing department).
c. Investment center – incurs costs and generates revenues
and is responsible for effectively using center assets.
C. Controllable versus Uncontrollable Costs
2. Controllable versus Direct Costs⎯ direct costs are readily
traced to a department, but may not be under control of
department manager. All costs are controllable at some level of
activities in terms of controllable costs in which a manager has
the power to determine or significantly affect the amount
© 2013 by McGraw-Hill Education. This is proprietary material solely for authorized instructor use. Not authorized for sale or
distribution in any manner. This document may not be copied, scanned, duplicated, forwarded, distributed, or posted on a
be readily traced to one department.
2. Allocated across departments benefiting from them.
3. Ideally allocated using a cause-effect relation or, if cause-
© 2013 by McGraw-Hill Education. This is proprietary material solely for authorized instructor use. Not authorized for sale or
distribution in any manner. This document may not be copied, scanned, duplicated, forwarded, distributed, or posted on a
website, in whole or part. 22-6
IV. Evaluating Investment Center Performance—financial and
nonfinancial measures of investment center performance.
center managers are typically evaluated using performance
measures that combine income and assets.
evaluate division performance is the investment center
residual income computed as investment center net
income minus target investment center net income.
company answers these questions:
a. How do you compute average invested assets?
4. Investment Center Profit Margin and Investment Turnover
a. Profit margin measures the income earned per dollar of
converted into sales.
c. Higher profit margin and investment turnover indicates
better performance.
Return on investment=Profit margin x Investment turnover.
Investment center net income / Investment center average
assets = (Investment center net income/Investment center
sales) x (Investment center sales/Investment center average
assets)
website, in whole or part. 22-7
Chapter 22 Decentralization and Performance Evaluation
website, in whole or part. 22-8
Chapter Outline
a. Alternative Transfer Prices—The manager of the division
providing the product, in general, would not want to use a
transfer price which is less than the product’s variable
manufacturing cost and the manager of the division receiving the
product would not want to use a transfer price which is greater
than selling price to outside customers (market value). A transfer
price between these two prices should be selected. A determining
factor is whether the department providing the product has excess
capacity to manufacture the product.
1. No Excess Capacity—a market-based transfer price is
preferred in this situation. With no excess capacity, the
manager providing the product will not accept a transfer price
less than the product’s selling price.
2. Excess Capacity—any price greater than variable
manufacturing cost is acceptable since it will recover some or
all of the fixed costs and increase its overall profits. This form
of transfer pricing is called cost-based transfer pricing.
3. Additional Issues in Transfer Pricing—additional issues
include:
rather than actual costs.
c. Division managers’ negotiation – the transfer price reflect
the negotiating skills of the respective division managers.
d. Nonfinancial factors—include quality control, reduced
to produce or purchase two or more products at the same time; similar
to indirect expense in that it’s shared across more than one cost object.
estimate the costs of individual products.
3. Financial statements prepared according to GAAP must assign
joint costs to products.
Notes
4. Allocation bases
Chapter 22 Decentralization and Performance Evaluation
website, in whole or part. 22-9
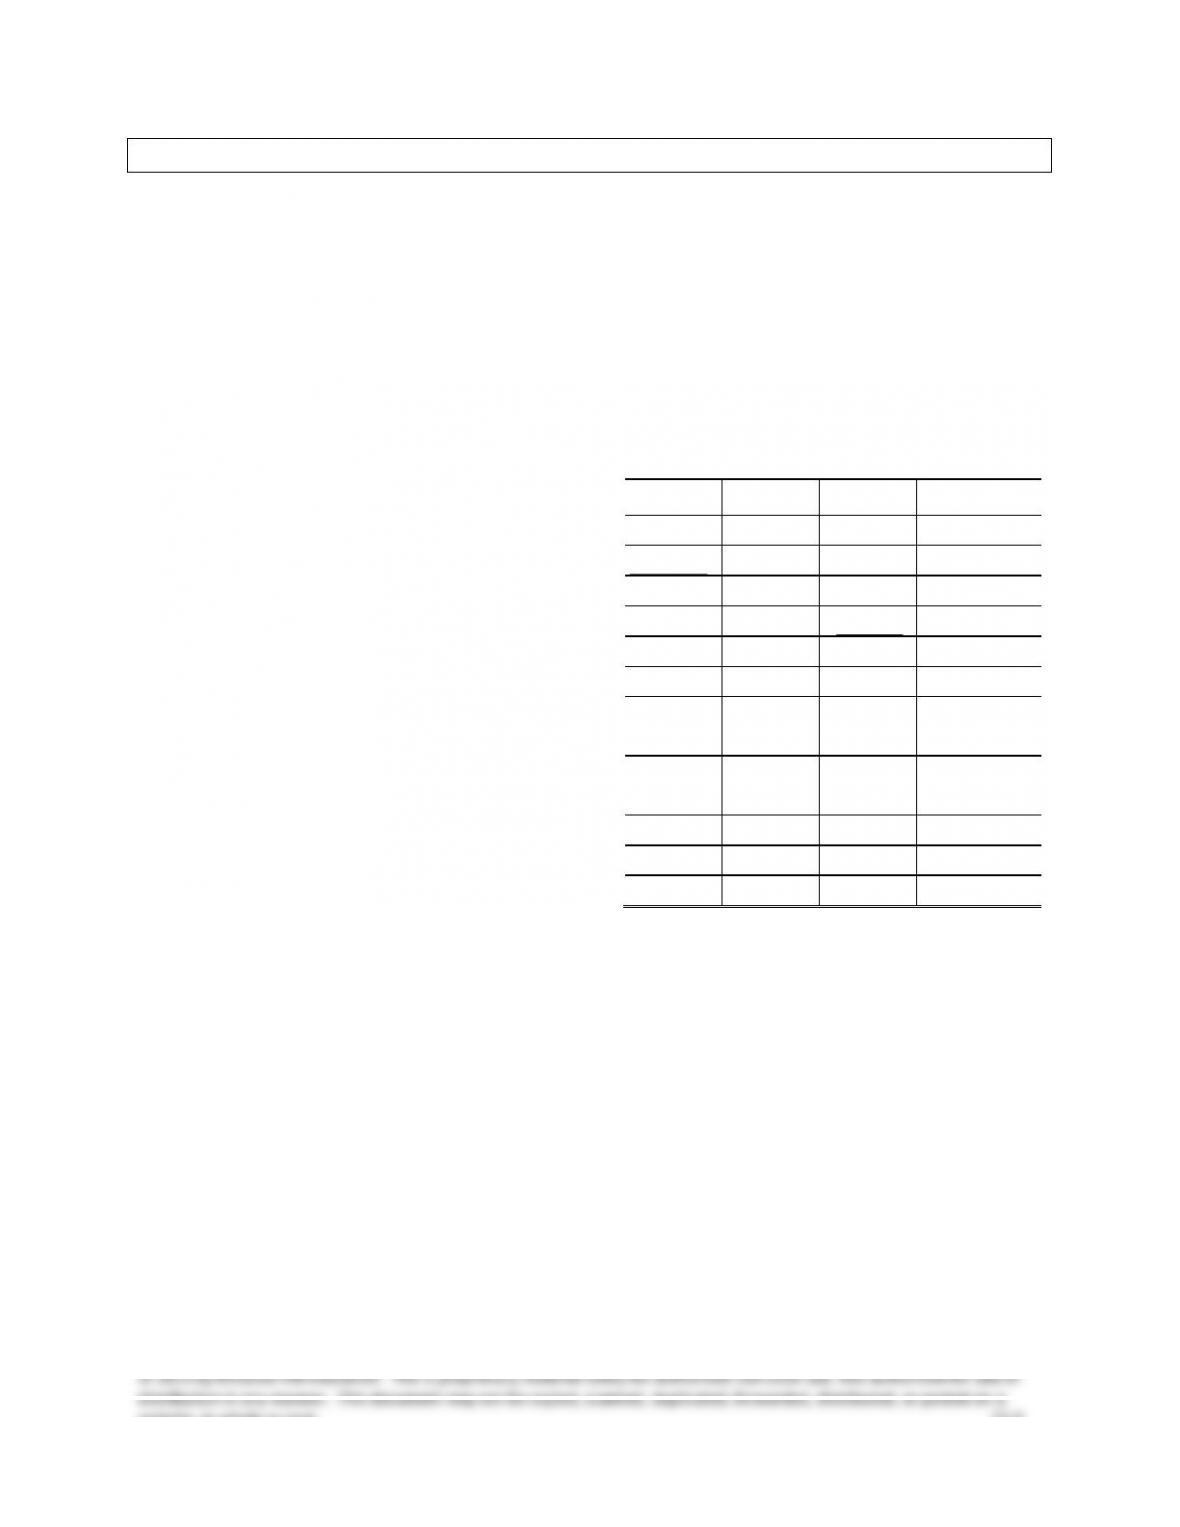
Chapter 22 Alternate Demonstration Problem #1
Jack and Susan Roberts own a farm that produces potatoes. Based on a
review of the income statement shown below, Jack remarked that they
should have fed the No. 3 potatoes to the pigs; then they would have
avoided the loss from the sale of the those potatoes.
JACK AND SUSAN ROBERTS
Income from the Production and Sale of Potatoes
For Year Ended December 31, 2013
Results by Grade
No. 1
No. 2
No. 3
Combined
Sales by grades:
No. 1, 300,000 lbs. $0.045 per lb.
$13,500
No. 2, 500,000 lbs. $0.04 per lb.
$20,000
No. 3, 200,000 lbs. $0.03 per lb.
$6,000
Combined
$39,500
Costs:
Land preparation, seed, planting,
cultivating @ $0.01422 per lb.
4,266
7,110
2,844
14,220
Harvesting, sorting, grading
@ $0.01185 per lb.
3,555
5,925
2,370
11,850
Marketing @ $0.00415 per lb.
1,245
2,075
830
4,150
Total costs
9,066
15,110
6,044
30,220
Net income (or loss)
$ 4,434
$ 4,890
$ (44)
$ 9,280
Jack and Susan divided their costs among the grades on a per pound
basis, because their records do not show cost per grade. However, their
records did show that $4,020 of the $4,150 of marketing costs represented
the cost of placing the No. 1 and No. 2 potatoes in bags and hauling them
to the warehouse of the produce buyer. Bagging and hauling costs were
the same for both grades. The remaining $130 represented the cost of
loading the No. 3 potatoes into the trucks of the potato starch factory that
bought these potatoes in bulk and picked them up at the farm.
Required:
Prepare an income statement that will better show the results of producing
and marketing each of the grades of potatoes.
Chapter 22 Decentralization and Performance Evaluation
website, in whole or part. 22–10
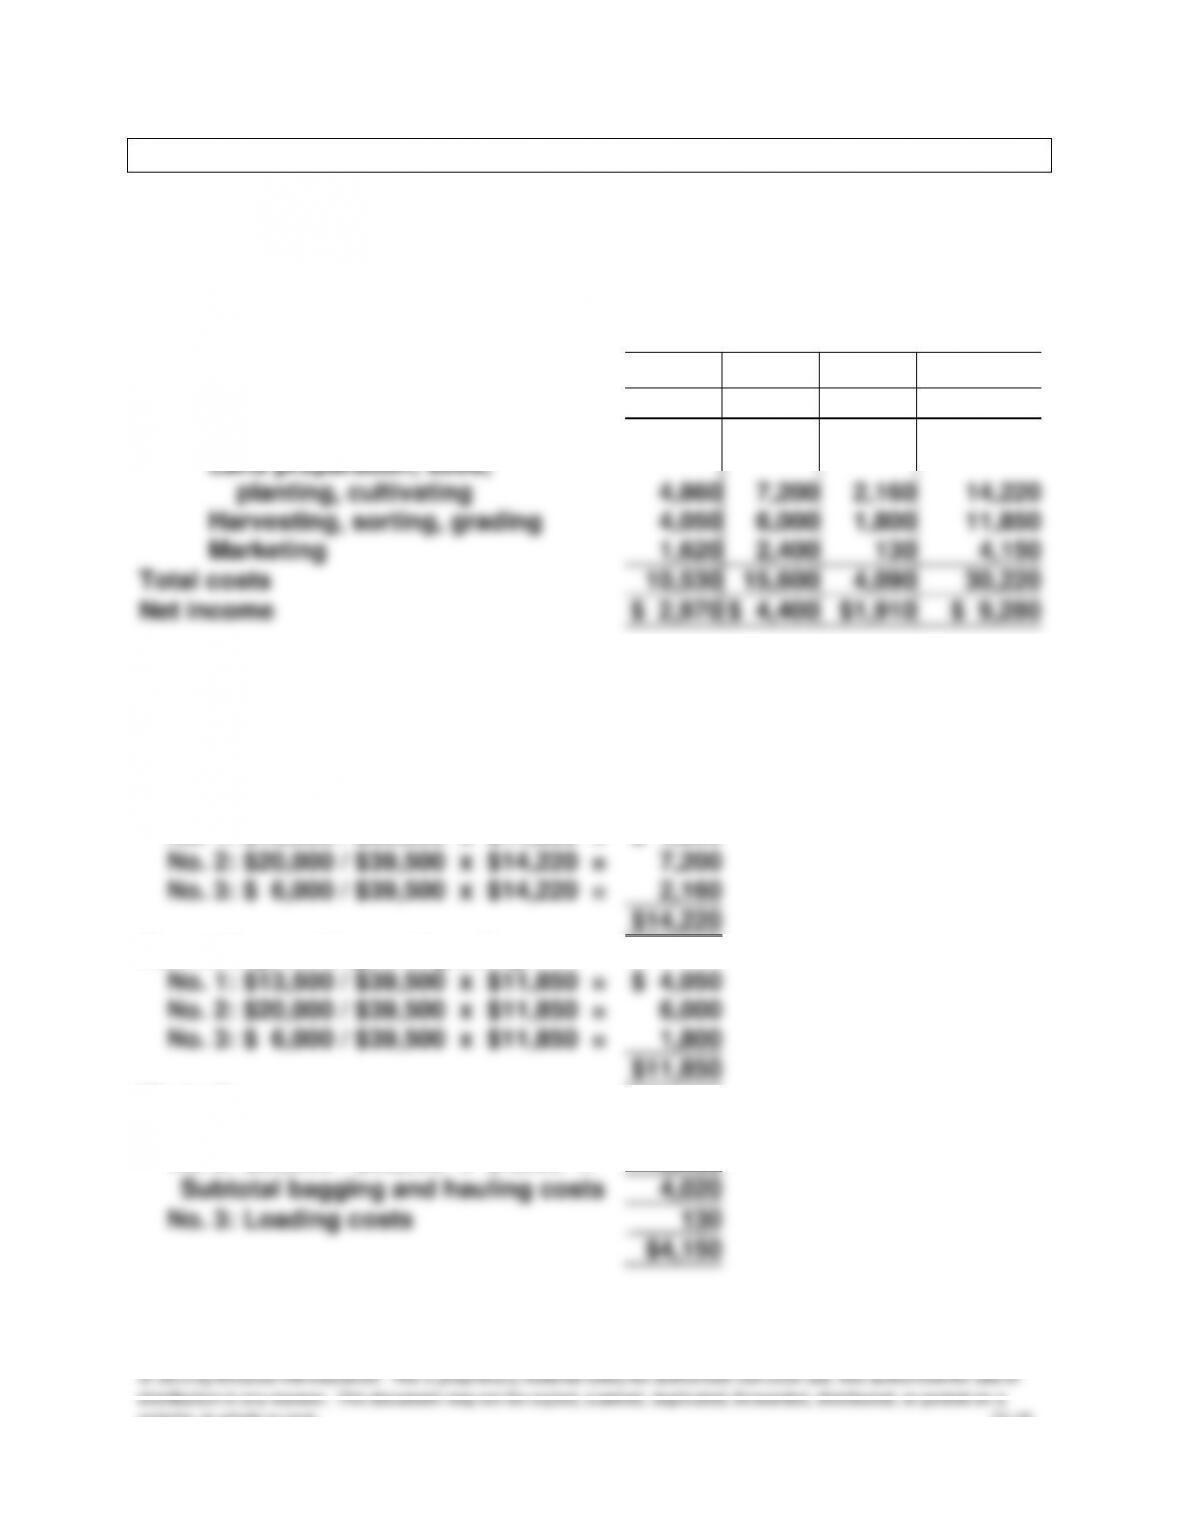
Solution: Chapter 22 Alternate Demonstration Problem #1
JACK AND SUSAN ROBERTS
Income from the Production and Sale of Potatoes
For Year Ended December 31, 2013
Results by Grade
No. 1
No. 2
No. 3
Combined
Revenue from sales:
$13,500
$20,000
$6,000
$39,500
Costs:
Land preparation, seed,
planting, cultivating
4,860
7,200
2,160
14,220
Harvesting, sorting, grading
4,050
6,000
1,800
11,850
Marketing
1,620
2,400
130
4,150
Total costs
10,530
15,600
4,090
30,220
Net income
$ 2,970
$ 4,400
$1,910
$ 9,280
COST ALLOCATIONS
Land preparation, seed, planting, and
cultivating:
No. 1: $13,500 / $39,500 x $14,220 =
No. 2: $20,000 / $39,500 x $14,220 =
No. 3: $ 6,000 / $39,500 x $14,220 =
$ 4,860
7,200
2,160
$14,220
Harvesting, sorting, and grading:
No. 1: $13,500 / $39,500 x $11,850 =
No. 2: $20,000 / $39,500 x $11,850 =
No. 3: $ 6,000 / $39,500 x $11,850 =
$ 4,050
6,000
1,800
$11,850
Marketing:
No. 1: $13,500 / $33,500 x $4,020 =
No. 2: $20,000 / $33,500 x $4,020 =
$1,620
2,400
Subtotal bagging and hauling costs
4,020
No. 3: Loading costs
130
$4,150