Student Name:
Class:
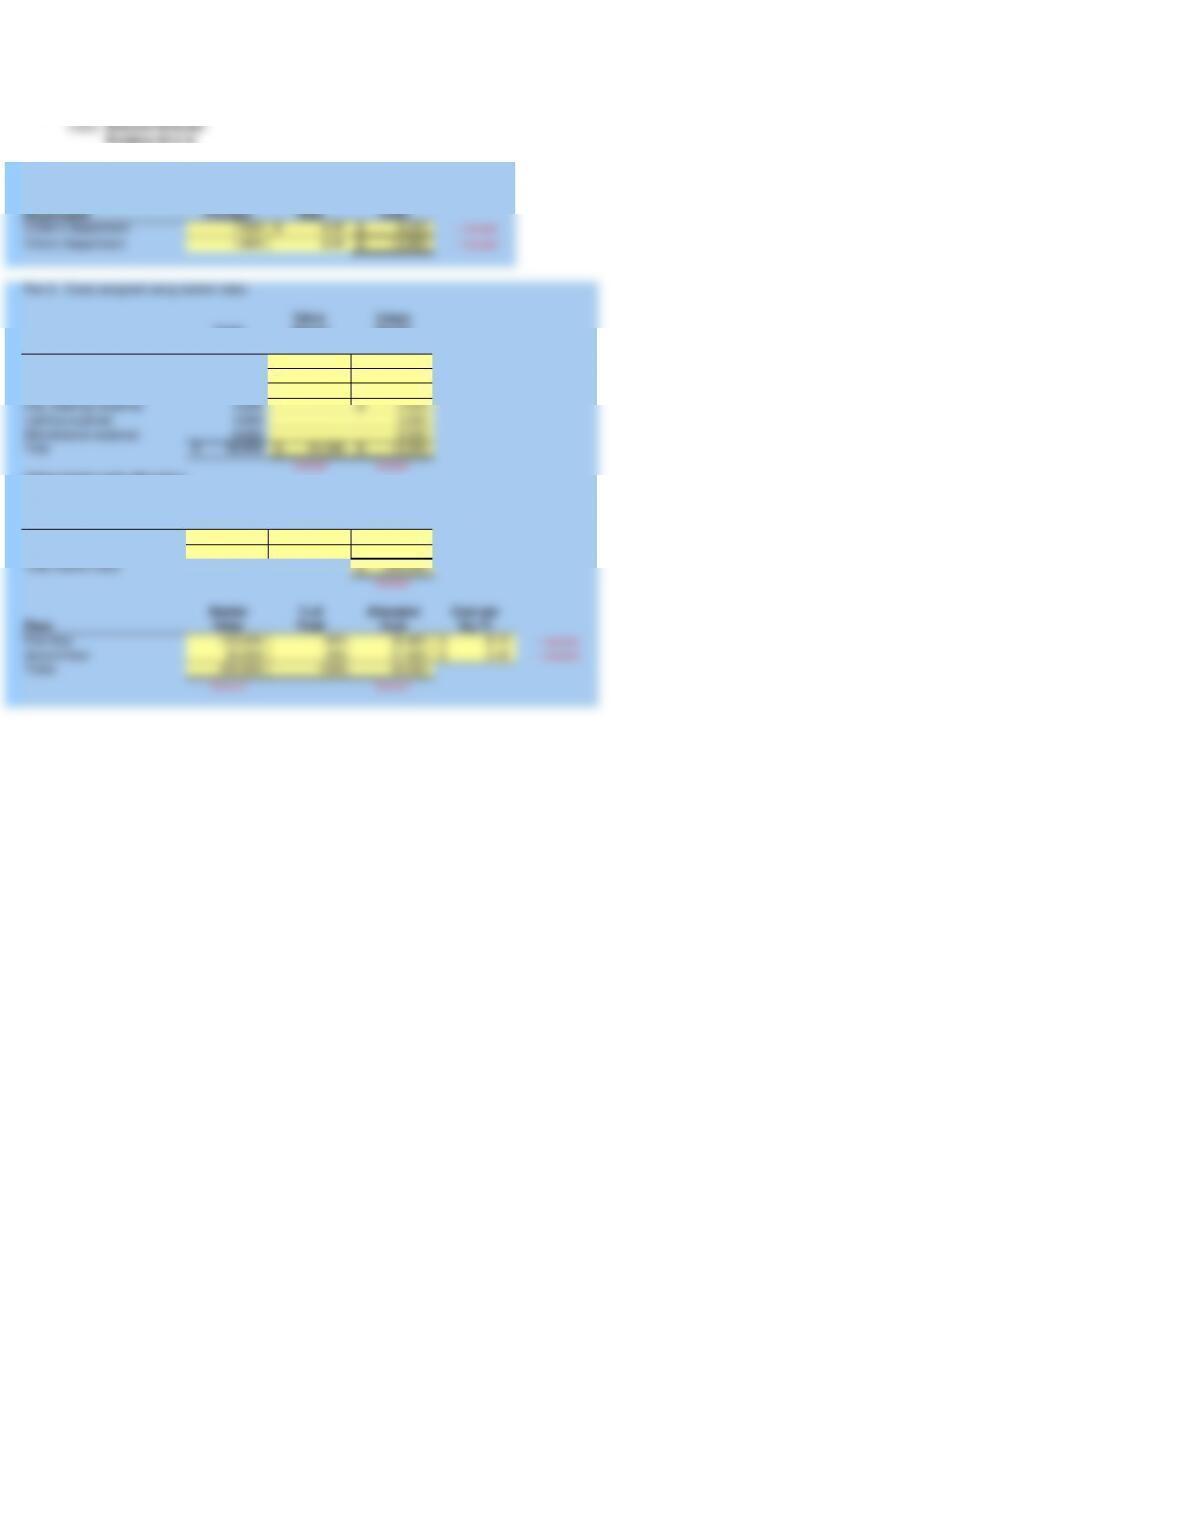
Square
Footage Rate Total
1,000 8.25$ 8,250$ «- Correct!
1,800 8.25 14,850$ «- Correct!
Value- Usage
Total Based Based
Costs Costs Costs
18,000$ 18,000$
27,000 27,000
9,000 9,000
3,000 3,000$
3,000 3,000
6,000 6,000
66,000$ 54,000$ 12,000$
Correct! Correct!
Square Value per
Footage Sq. Ft. Total
4,000 30$ 120,000$
4,000 20 80,000
200,000$
Correct!
Market % of Allocated Cost per
Value Total Cost Sq. Ft
120,000 60% 32,400 8.10$ «- Correct!
80,000 40% 21,600 5.40$ «- Correct!
200,000 100% 54,000
Correct! Correct!
Totals
Maintenance expense
Total
Value-based costs allocation:
Floor
Total market value
First floor
Second floor
Floor
Chiro’s Department
Linder’s Department
Part 2. Costs assigned using market rates:
Interest – Building mortgage
Depreciation – Building
Taxes – Building and land
Gas (heating) expense
Lighting expense
Problem 22-01A
McGraw-Hill/Irwin
Instructor
Part 1. Costs assigned using previous method:
Second floor
First floor
Department
Student Name:
Class:
Problem 22-01A
McGraw-Hill/Irwin
Instructor
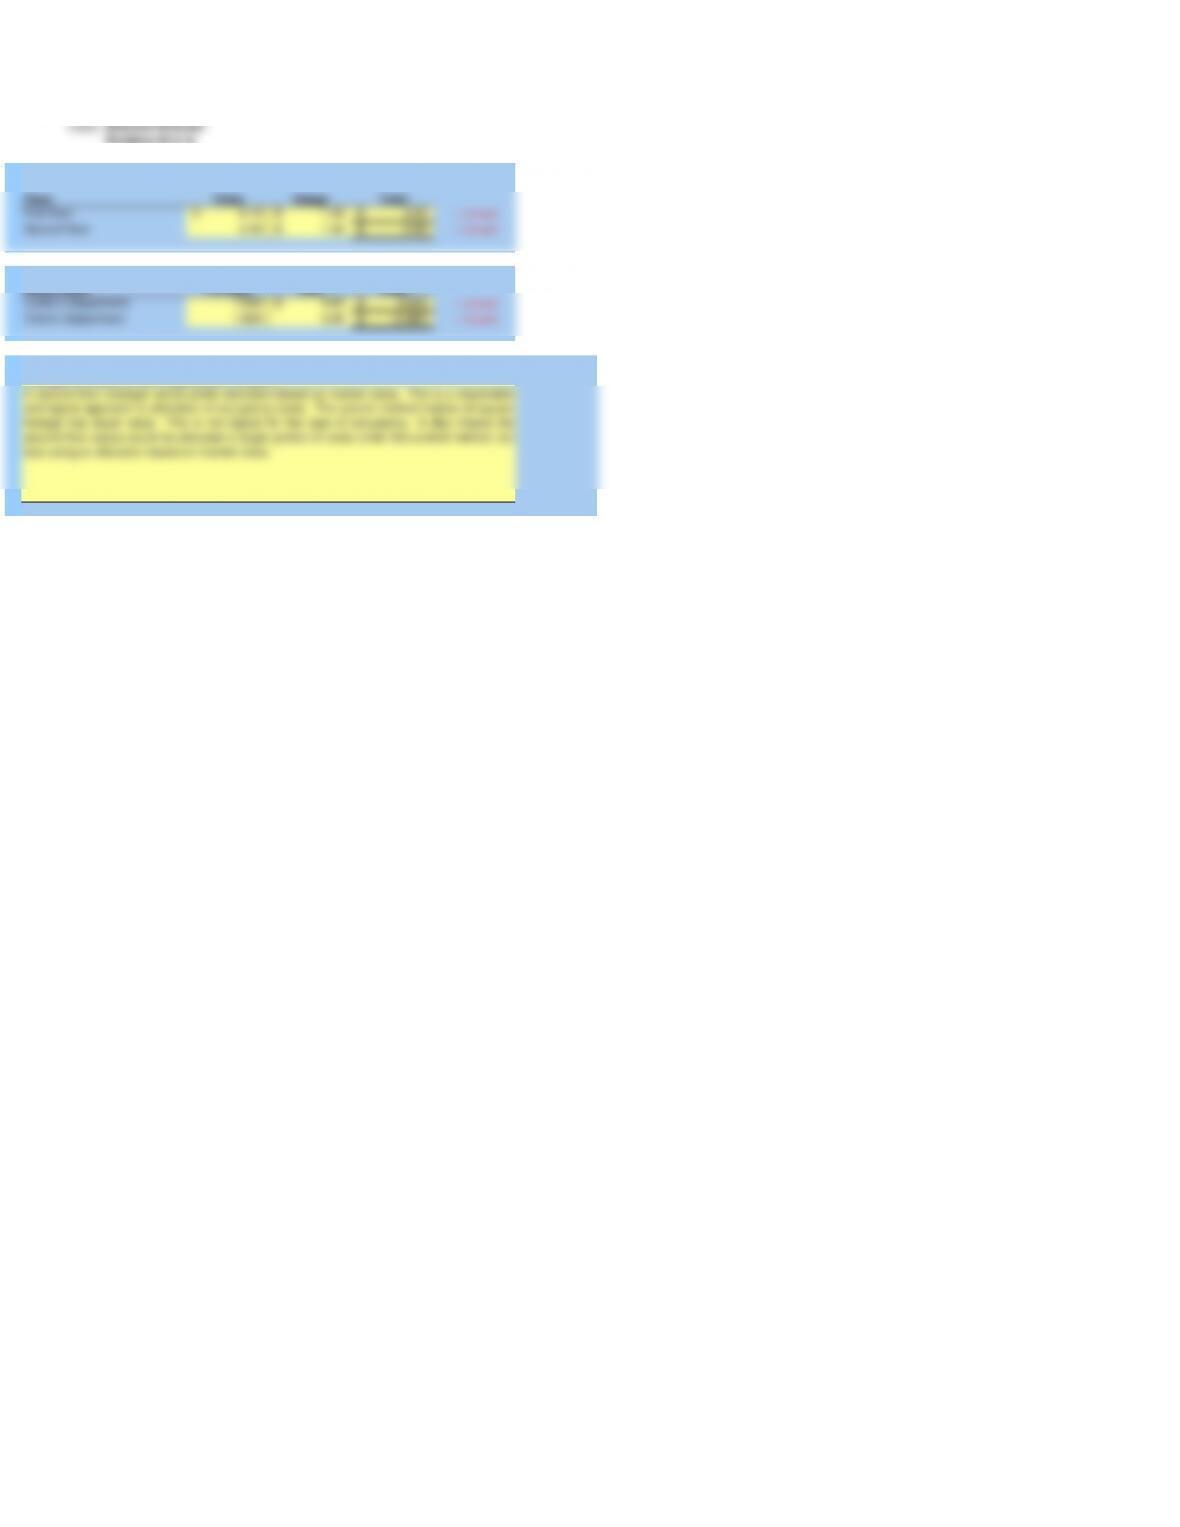
Usage-based costs allocation:
Value Usage Total
8.10$ 1.50$ 9.60$ «- Correct!
5.40 1.50$ 6.90$ «- Correct!
Square
Footage Rate Total
1,000 9.60$ 9,600$ «- Correct!
1,800 6.90 12,420$ «- Correct!
Part 3: Which allocation method would you prefer if you were a
manager of a second-floor department? Explain.
First floor
Second floor
Linder’s Department
Chiro’s Department
Floor
Department
A second-floor manager would prefer allocation based on market value. This is a reasonable
and logical approach to allocation of occupancy costs. The current method implies all square
footage has equal value. This is not logical for this type of occupancy. It also means the
second-floor space would be allocated a larger portion of costs under the current method, but
less using an allocation based on market value.
18,000$
27,000
9,000
3,000
3,000
6,000
66,000$
4,000
8.25$
1,000
1,800
30$
20$
23,100$
9,600$
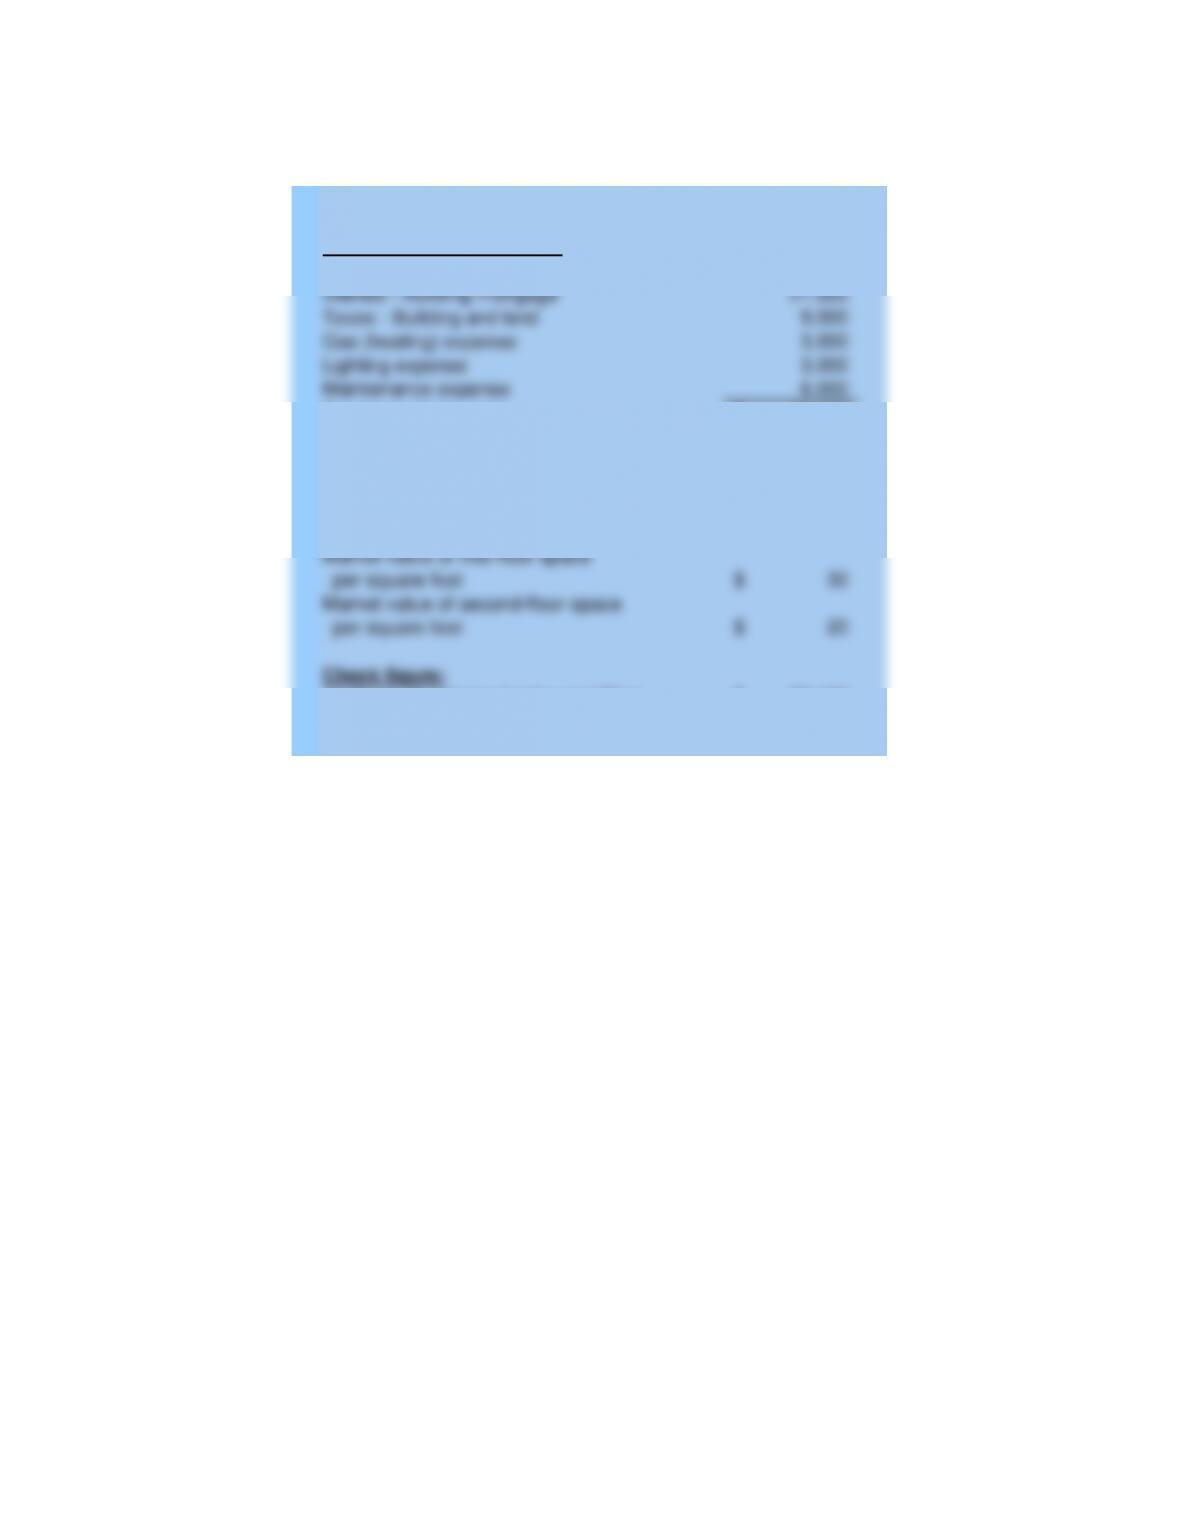
Given Data P22-01:
First floor department square feet
Second floor department square feet
Market value of first-floor space
per square foot
Market value of second-floor space
per square foot
Lighting expense
Maintenance expense
Average cost per square foot
NATIONAL BANK
(2) Total occupancy cost to Linder
(1) Total allocated to Linder and Chiro
Check figure:
Depreciation – Building
Building Occupancy Cost:
Interest – Building mortgage
Taxes – Building and land
Gas (heating) expense
Total occupancy cost
Square feet on each floor
Student Name:
Class:
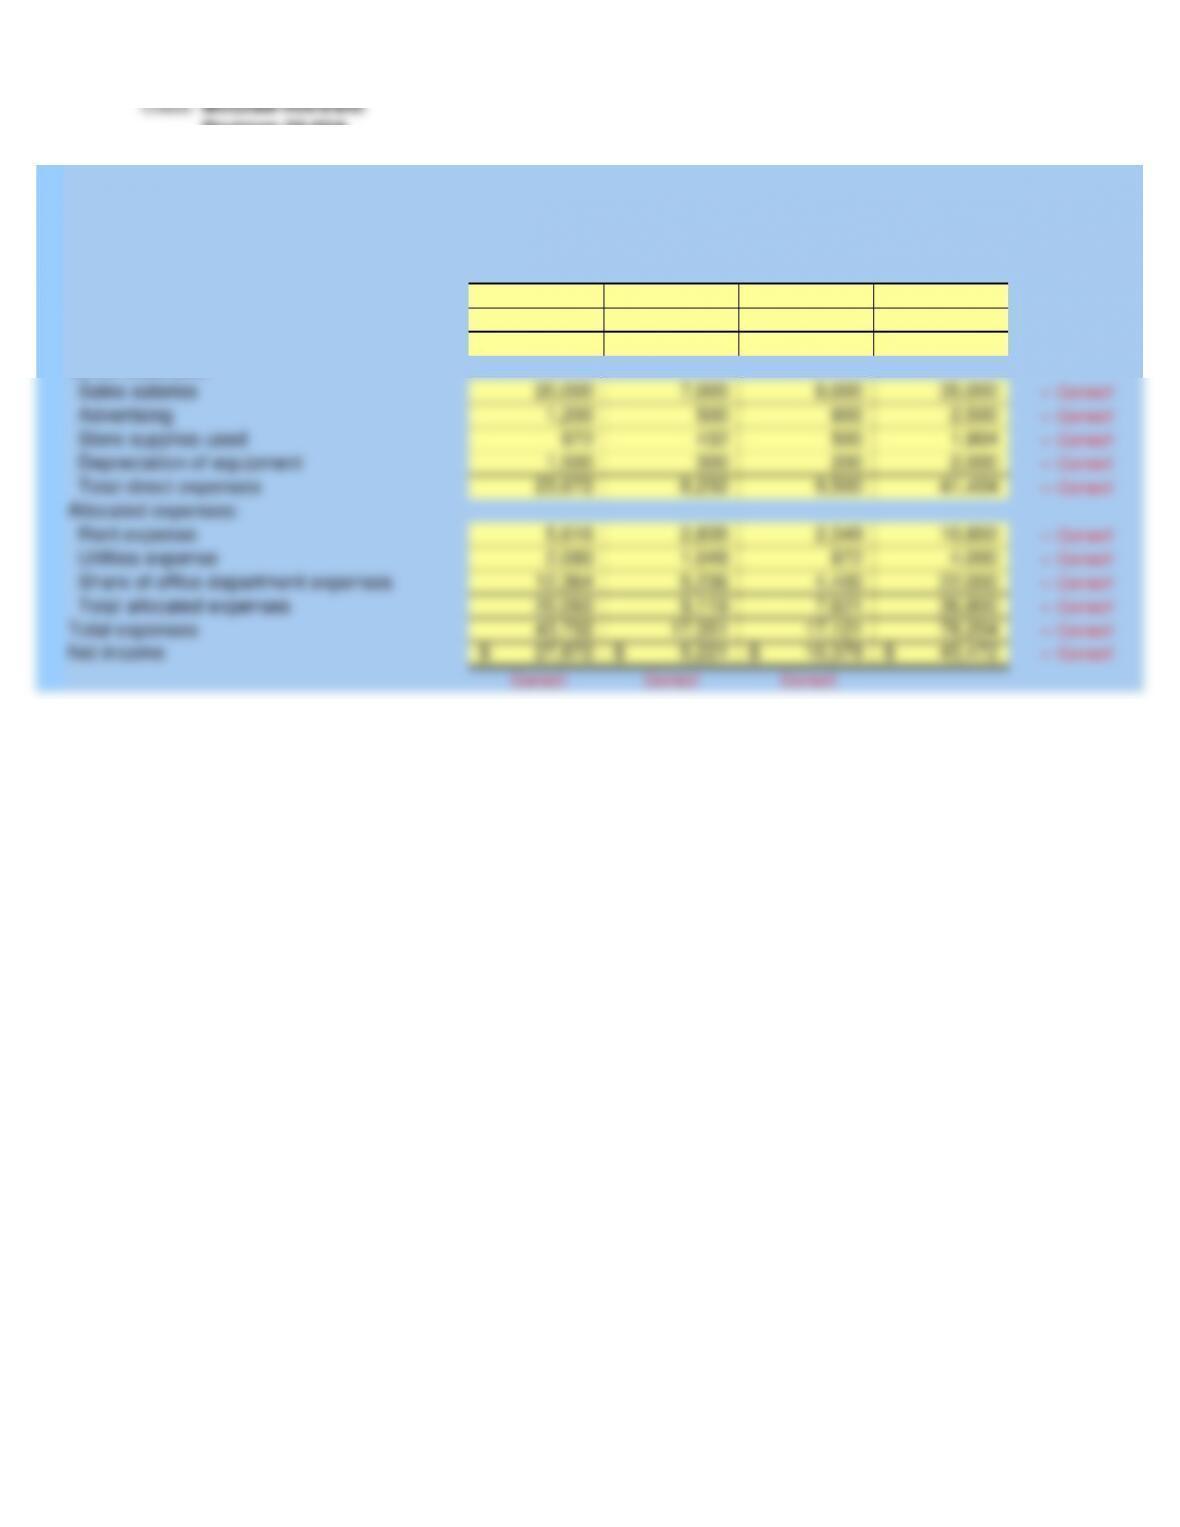
Clocks Mirrors Paintings Combined
140,400$ 59,400$ 50,000$ 249,800$ «- Correct!
68,796 36,828 22,500 128,124 «- Correct!
71,604 22,572 27,500 121,676 «- Correct!
20,000 7,000 8,000 35,000 «- Correct!
1,200 500 800 2,500 «- Correct!
972 432 500 1,904 «- Correct!
1,500 300 200 2,000 «- Correct!
23,672 8,232 9,500 41,404 «- Correct!
5,616 2,835 2,349 10,800 «- Correct!
2,080 1,048 872 4,000 «- Correct!
12,364 5,236 4,400 22,000 «- Correct!
20,060 9,119 7,621 36,800 «- Correct!
43,732 17,351 17,121 78,204 «- Correct!
27,872$ 5,221$ 10,379$ 43,472$ «- Correct!
Correct! Correct! Correct!
Share of office department expenses
Total allocated expenses
Total expenses
Net income
Store supplies used
Depreciation of equipment
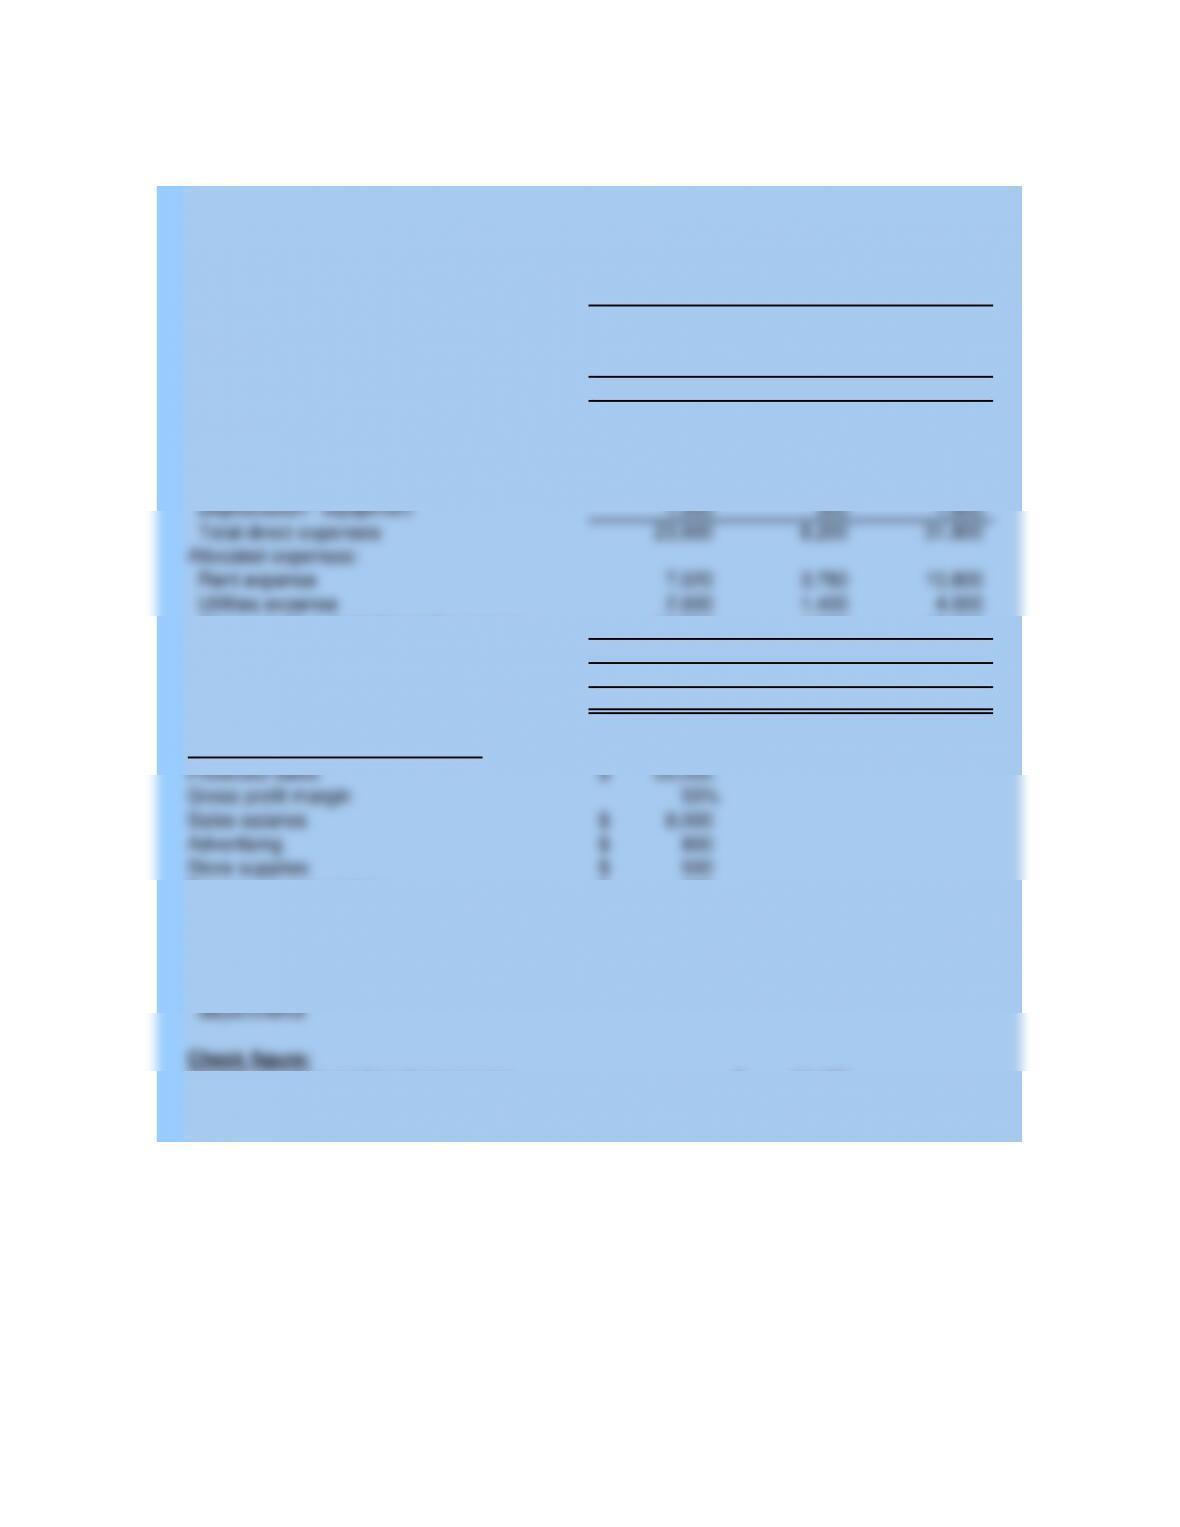
Total direct expenses
Allocated expenses:
Rent expense
Utilities expense
Sales
Cost of goods sold
Gross profit
Direct expenses:
Sales salaries
Advertising
McGraw-Hill/Irwin
Instructor
For Year Ended December 31, 2014
Forecasted Departmental Income Statements
WILLIAMS COMPANY
Problem 22-02A
Student Name:
Class:
McGraw-Hill/Irwin
Instructor
Problem 22-02A
Supporting Calculations
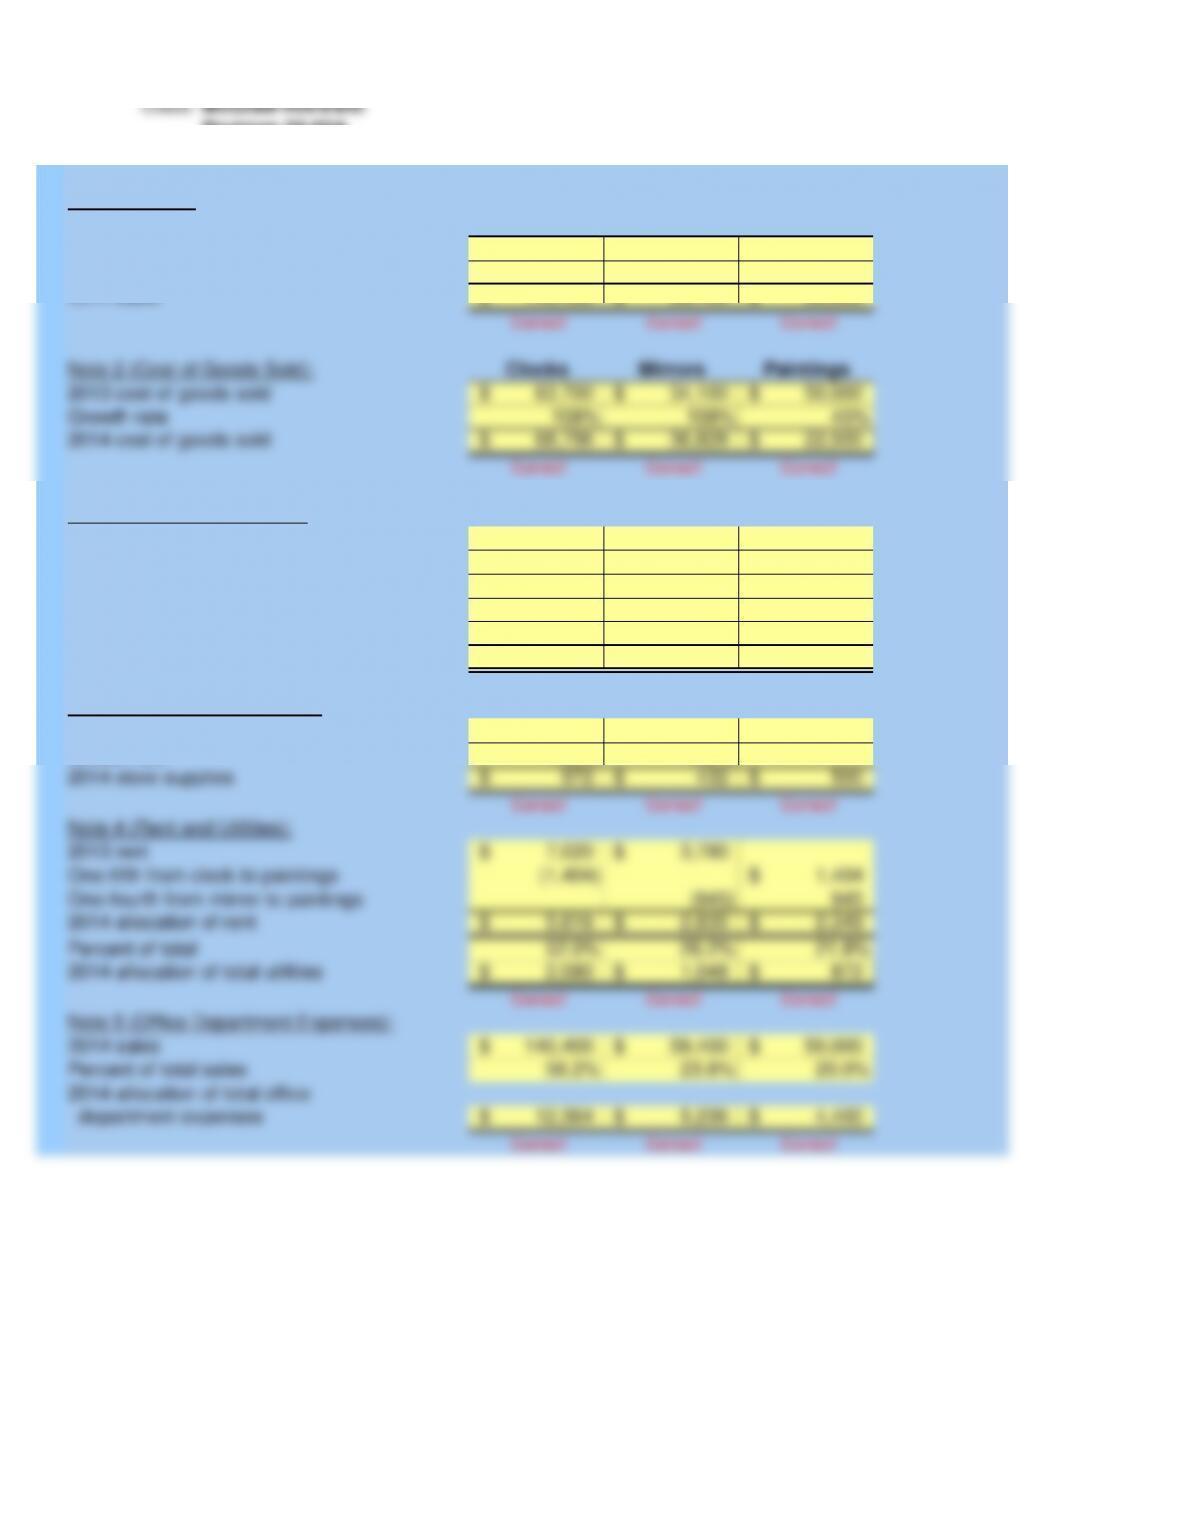
Clocks Mirrors Paintings
130,000$ 55,000$
108% 108%
140,400$ 59,400$ 50,000$
Correct! Correct! Correct!
Clocks Mirrors Paintings
63,700$ 34,100$ 50,000$
108% 108% 45%
68,796$ 36,828$ 22,500$
Correct! Correct! Correct!
63,700$ 34,100$
130,000$ 55,000$
49.0% 62.0%
140,400$ 59,400$ 50,000$
49% 62% 45%
68,796$ 36,828$ 22,500$
Correct! Correct! Correct!
900$ 400$
108% 108%
2014 store supplies
Correct! Correct! Correct!
7,020$ 3,780$
(1,404) 1,404$
(945) 945
5,616$ 2,835$ 2,349$
52.0% 26.2% 21.8%
2,080$ 1,048$ 872$
Correct! Correct! Correct!
140,400$ 59,400$ 50,000$
56.2% 23.8% 20.0%
12,364$ 5,236$ 4,400$
Correct! Correct! Correct!
department expenses
Note 1 (Sales):
Note 2 (Cost of Goods Sold):
Note 2 (Alternative method):
Note 3 (Store Supplies Used):
Note 4 (Rent and Utilities):
Note 5 (Office Department Expenses):
Percent of total
2014 allocation of total utilities
2014 sales
Percent of total sales
2014 allocation of total office
2013 rent
One-fifth from clock to paintings
One-fourth from mirror to paintings
2014 allocation of rent
2014 sales
2014 cost as % of sales
2014 cost of goods sold
2013 store supplies used
Growth rate
2014 cost of goods sold
2013 cost of goods sold
2013 sales
2013 cost as % of sales
Growth rate
2014 sales
2013 cost of goods sold
Growth rate
2013 sales
Clock Mirror Combined
130,000$ 55,000$ 185,000$
63,700 34,100 97,800
66,300 20,900 87,200
20,000 7,000 27,000
1,200 500 1,700
900 400 1,300
1,500 300 1,800
23,600 8,200 31,800
7,020 3,780 10,800
2,600 1,400 4,000
10,500 4,500 15,000
20,120 9,680 29,800
43,720 17,880 61,600
22,580$ 3,020$ 25,600$
50,000$
55%
8,000$
800$
500$
Increased office department expenses
Increased sales in clock and mirror
Equipment depreciation
Space used in clock dept.
Space used in mirror dept.
43,472$
249,800$
Given Data P22-02A:
2014 forecasted combined net sales
departments
Check figure:
2014 forecasted combined net income
Sales salaries
Advertising
Total expenses
Net income
Information on new department:
Predicted sales
Gross profit margin
Allocated expenses:
Rent expense
Utilities expense
Share of office departmental expenses
Total allocated expenses
Store supplies
Direct expenses:
Sales salaries
Advertising
Store supplies used
Depreciation – equipment
Total direct expenses
For Year Ended December 31, 2013
Departmental Income Statement
WILLIAMS COMPANY
Sales
Cost of goods sold
Gross profit