Student Name:
Class:
Units Cost Total
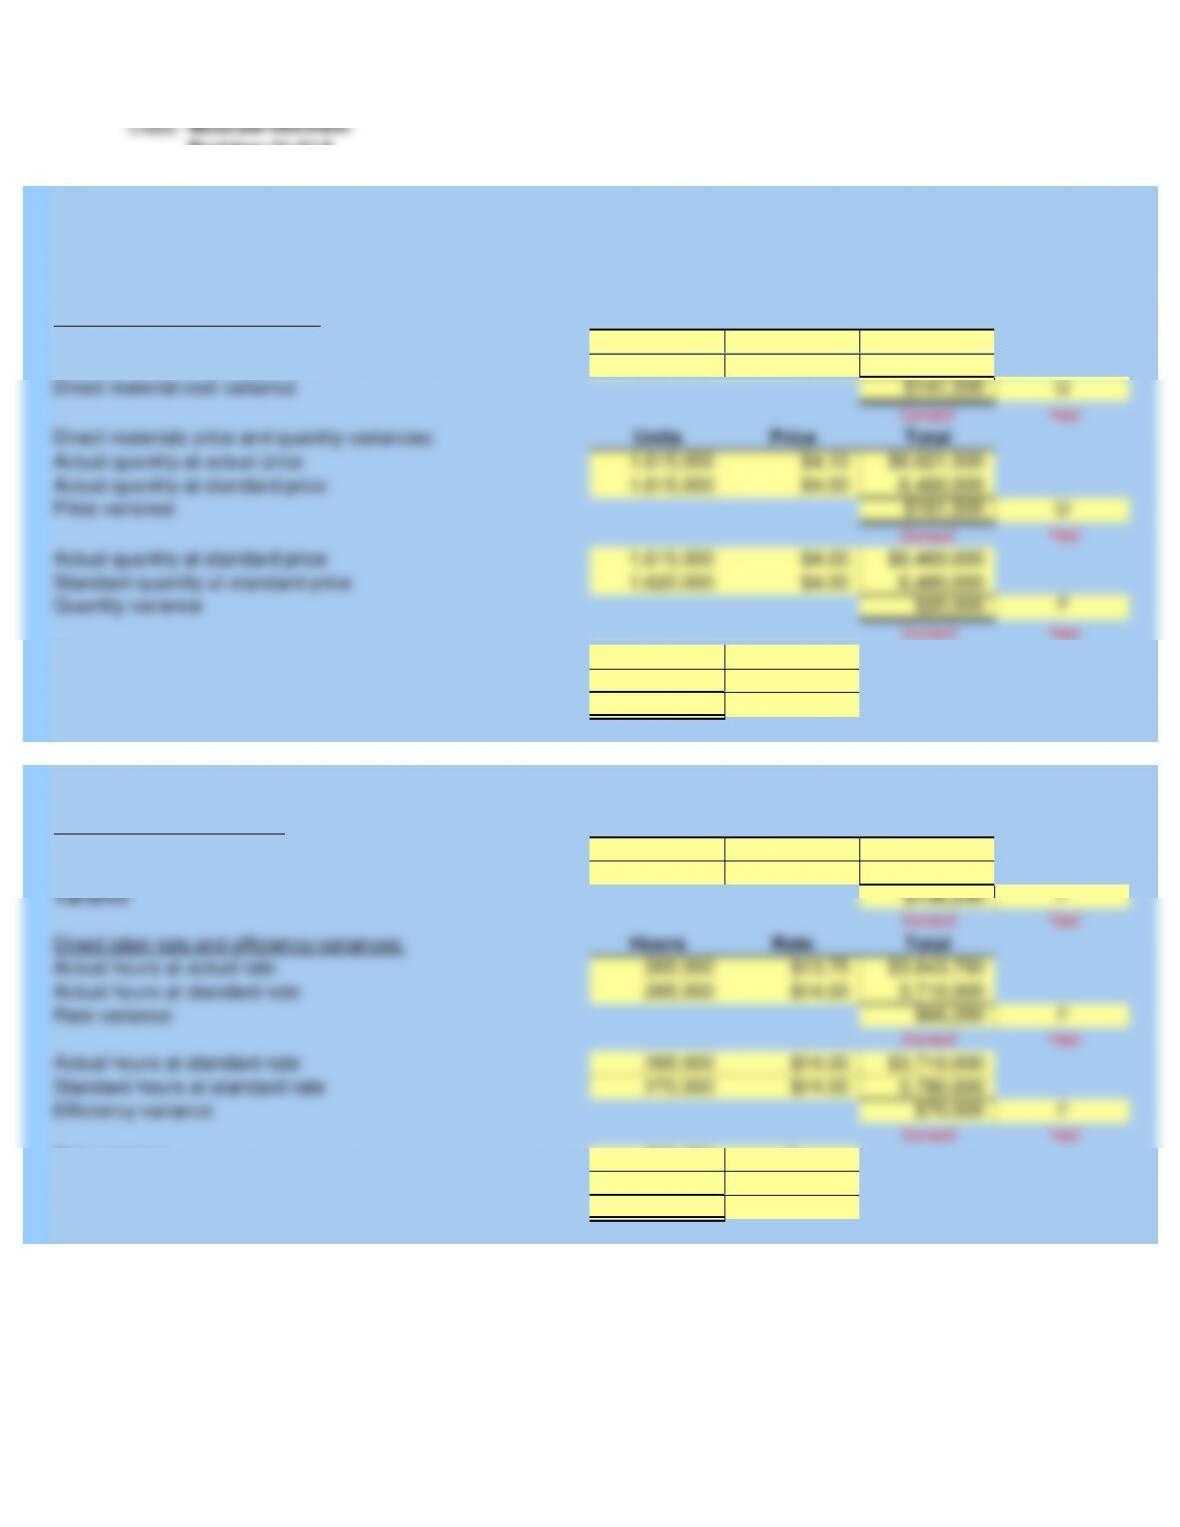
1,615,000 $4.10 $6,621,500
1,620,000 $4.00 6,480,000
$141,500 U
Direct material cost variance
Correct! Yes!
Units Price Total
1,615,000 $4.10 $6,621,500
1,615,000 $4.00 6,460,000
$161,500 U
Correct! Yes!
1,615,000 $4.00 $6,460,000
1,620,000 $4.00 6,480,000
$20,000 F
Correct! Yes!
$161,500 U
$20,000 F
$141,500 U
Correct! Yes!
Hours Cost Total
265,000 $13.75 $3,643,750
270,000 $14.00 3,780,000
$136,250 F
Correct! Yes!
Hours Rate Total
265,000 $13.75 $3,643,750
265,000 $14.00 3,710,000
$66,250 F
Correct! Yes!
265,000 $14.00 $3,710,000
270,000 $14.00 3,780,000
$70,000 F
Correct! Yes!
Rate variance
Efficiency variance
Total labor variance
Direct materials cost variances:
Actual hours at actual rate
Actual hours at standard rate
Rate variance
Efficiency variance
Actual hours at standard rate
Standard hours at standard rate
Price variance
Quantity variance
Actual units at actual cost
Standard units at standard cost
Variance
Direct labor rate and efficiency variances:
Direct labor cost variances:
Price variance
Actual quantity at standard price
Standard quantity at standard price
Quantity variance
Standard units at standard cost
Direct materials price and quantity variances:
Actual quantity at actual price
Actual quantity at standard price
Instructor
Variances
TRICO COMPANY
Problem 21-01A
McGraw-Hill/Irwin
Part 2 Direct Labor Variances:
Part 1 Direct Materials Variances:
Total materials variance
Actual units at actual cost
Student Name:
Class:
Instructor
Problem 21-01A
McGraw-Hill/Irwin
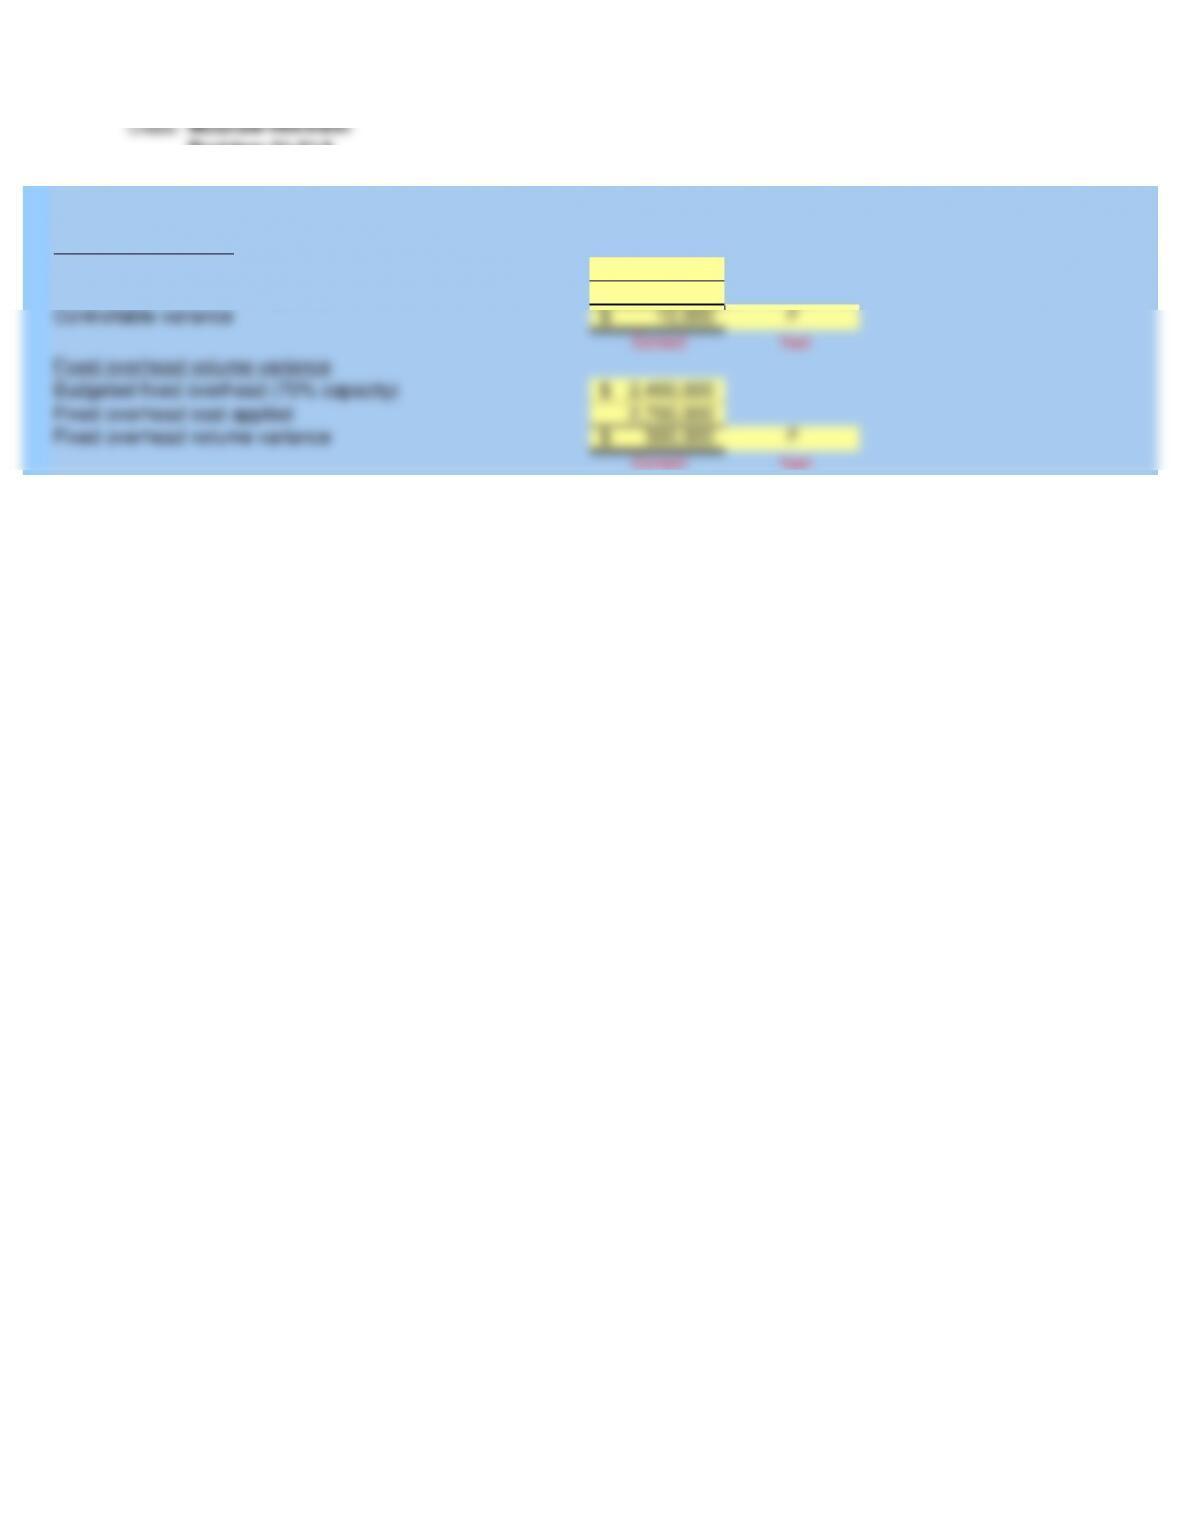
4,550,000$
4,560,000
10,000$ F
Correct! Yes!
2,400,000$
2,700,000
300,000$ F
Correct! Yes!
Applied overhead (90% capacity)
Controllable variance
Controllable variance
Budgeted fixed overhead (70% capacity)
Fixed overhead cost applied
Fixed overhead volume variance
Fixed overhead volume variance
Actual overhead
Part 3 Overhead Variances:
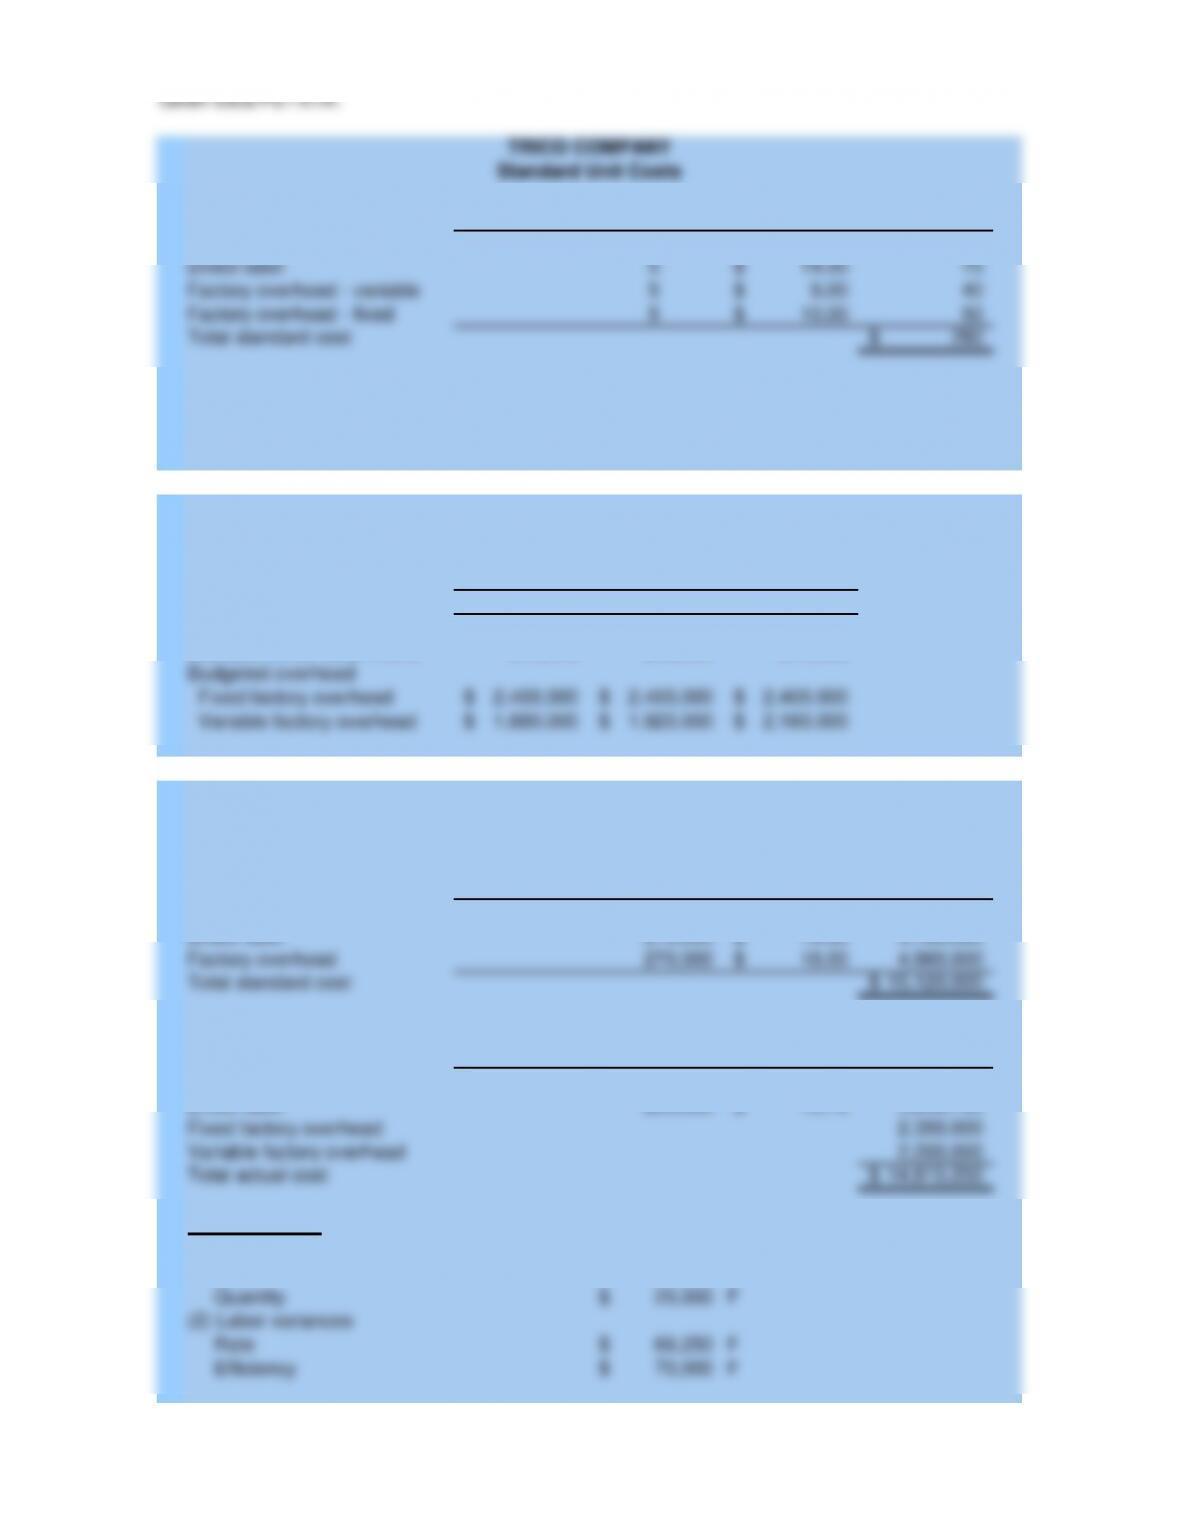
Pounds Hours Unit Cost Total
30 4.00$ 120$
514.00$ 70
58.00$ 40
510.00$ 50
280$
Pounds Hours Unit Cost Total
Pounds Hours Unit Cost Total
(2) Labor variances
Rate
Efficiency
Actual costs incurred during quarter:
(1) Materials variances
Price
Quantity
Direct material
Direct labor
Fixed factory overhead
Variable factory overhead
Total actual cost
Variable factory overhead
Direct material
Direct labor
Factory overhead
Total standard cost
Production in units
Standard direct labor hours
Budgeted overhead
Fixed factory overhead
Productive capacity per quarter in units
of productive capacity per quarter
Operating volume as percentage
TRICO COMPANY
TRICO COMPANY
Given Data P21-01A:
Factory overhead – variable
Direct labor
Direct materials
Standard Unit Costs
TRICO COMPANY
Total standard cost
Factory overhead – fixed
Student Name:
Class:
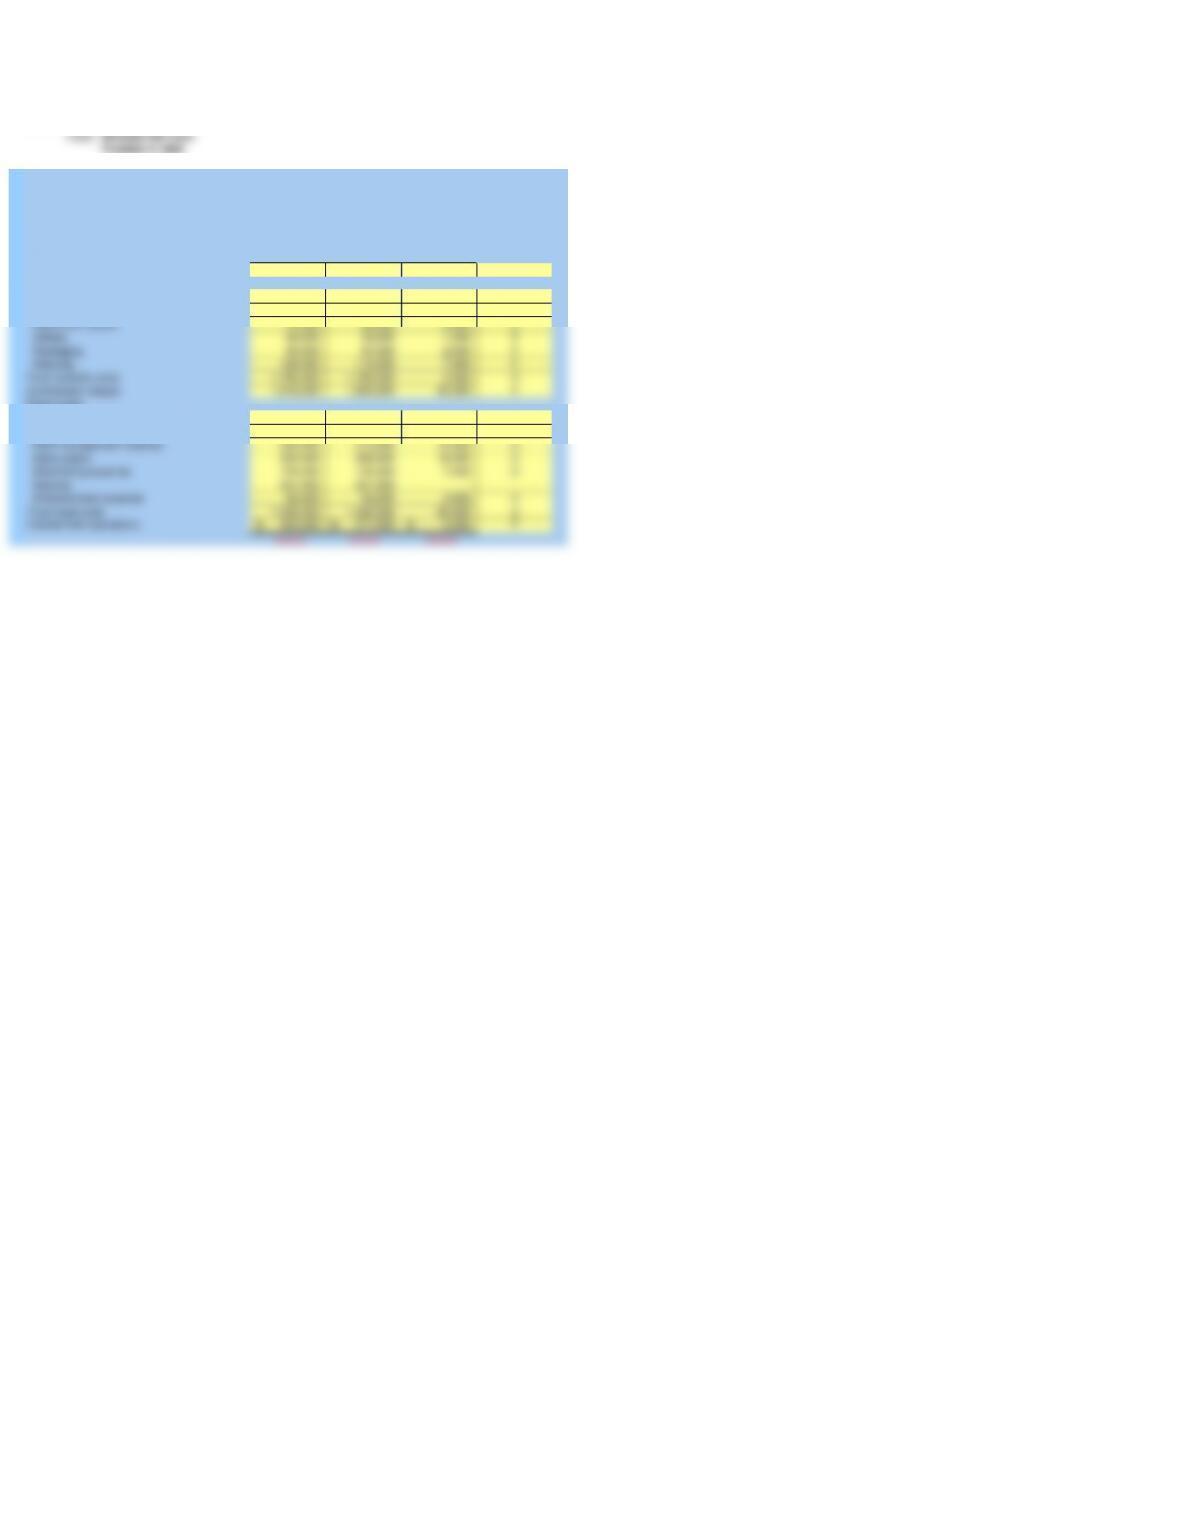
Flexible Actual
Budget Results Variances
3,600,000$ 3,648,000$ 48,000$ F
1,170,000 1,185,000 15,000 U
270,000 278,000 8,000 U
72,000 63,000 9,000 F
54,000 53,000 1,000 F
90,000 87,500 2,500 F
126,000 118,500 7,500 F
1,782,000 1,785,000 3,000 U
1,818,000 1,863,000 45,000 F
300,000 300,000 –
150,000 147,500 2,500 F
200,000 210,000 10,000 U
250,000 268,000 18,000 U
125,000 132,000 7,000 U
241,000 241,000 –
90,000 93,500 3,500 U
1,356,000 1,392,000 36,000 U
462,000$ 471,000$ 9,000$ F
Correct! Correct! Correct!
Advertising expense
Salaries
Entertainment expense
Total fixed costs
Income from operations
Contribution margin
Fixed costs:
Depreciation – plant equipment
Utilities
Plant management salaries
Sales salary
Direct labor
Machinery repairs
Utilities
Packaging
Shipping
Total variable costs
Instructor
For Year Ended December 31, 2013
Flexible Budget Performance Report
PHOENIX COMPANY
Problem 21-04A
Sales
McGraw-Hill/Irwin
Variable costs:
Direct materials

Student Name:
Class:
Instructor
Problem 21-04A
McGraw-Hill/Irwin
Total Per unit
3,600,000$ 200.00$
3,648,000 202.67
48,000$ 2.67$
Correct! Correct!
Total Per unit
1,170,000$ 65.00$
1,185,000 65.83
15,000$ 0.83$
Correct! Correct!
Interpretation:
Actual sales
Sales variance
Interpretation:
(b) Analysis of direct materials variance:
(a) Analysis of sales variance:
Budgeted sales
Actual materials used
Direct materials variance
(b) direct materials variance.
Part 2: Analyze and interpret both the (a) sales variance and
The sales variance is favorable because the actual price was higher than planned.
The direct materials variance is unfavorable for two possible reasons. (1) The quantity of materials used may
have been more than the quantity budgeted, and/or (2) the amount paid for the materials might have been
more than the budgeted purchase price.
Budgeted materials
3,000,000$
975,000$
225,000
60,000
300,000
1,045,000
75,000
105,000
250,000 430,000
Salaries
Entertainment expense
Advertising expense
Utilities ($45,000 is variable)
Plant management salaries
159,000$
15,000
3,648,000$
1,185,000$
278,000
63,000
300,000
200,500
Plant management salaries
Gross profit
Shipping
Sales salary (annual)
General and administrative expenses:
Advertising expense
Selling expenses:
Packaging
241,000
93,500 466,500
471,000$
36,000$ U
9,000 F
Given Data P21-04A:
Income from operations
Check figures:
(1) Variances
Fixed costs
Depreciation – Plant equipment
Utilities (fixed cost is $147,500)
Income
Salaries
Entertainment expense
Sales (18,000 units)
Cost of goods sold:
Direct materials
Direct labor
Machinery repairs (variable cost)
For Year Ended December 31, 2013
Statement of Income from Operations
PHOENIX COMPANY
Income from operations
Based on production and sales volume
Units
Selling expenses:
Packaging
Shipping
Sales salary (fixed annual amount)
General and administrative expenses:
Direct labor
Machinery repairs (variable cost)
Depreciation – plant equipment
Gross profit
Direct materials
For Year Ended December 31, 2013
Fixed Budget Report
PHOENIX COMPANY
Sales
Cost of goods sold: