PROBLEM SET B
Problem 18-1B (25 minutes)
Parts 1 and 2
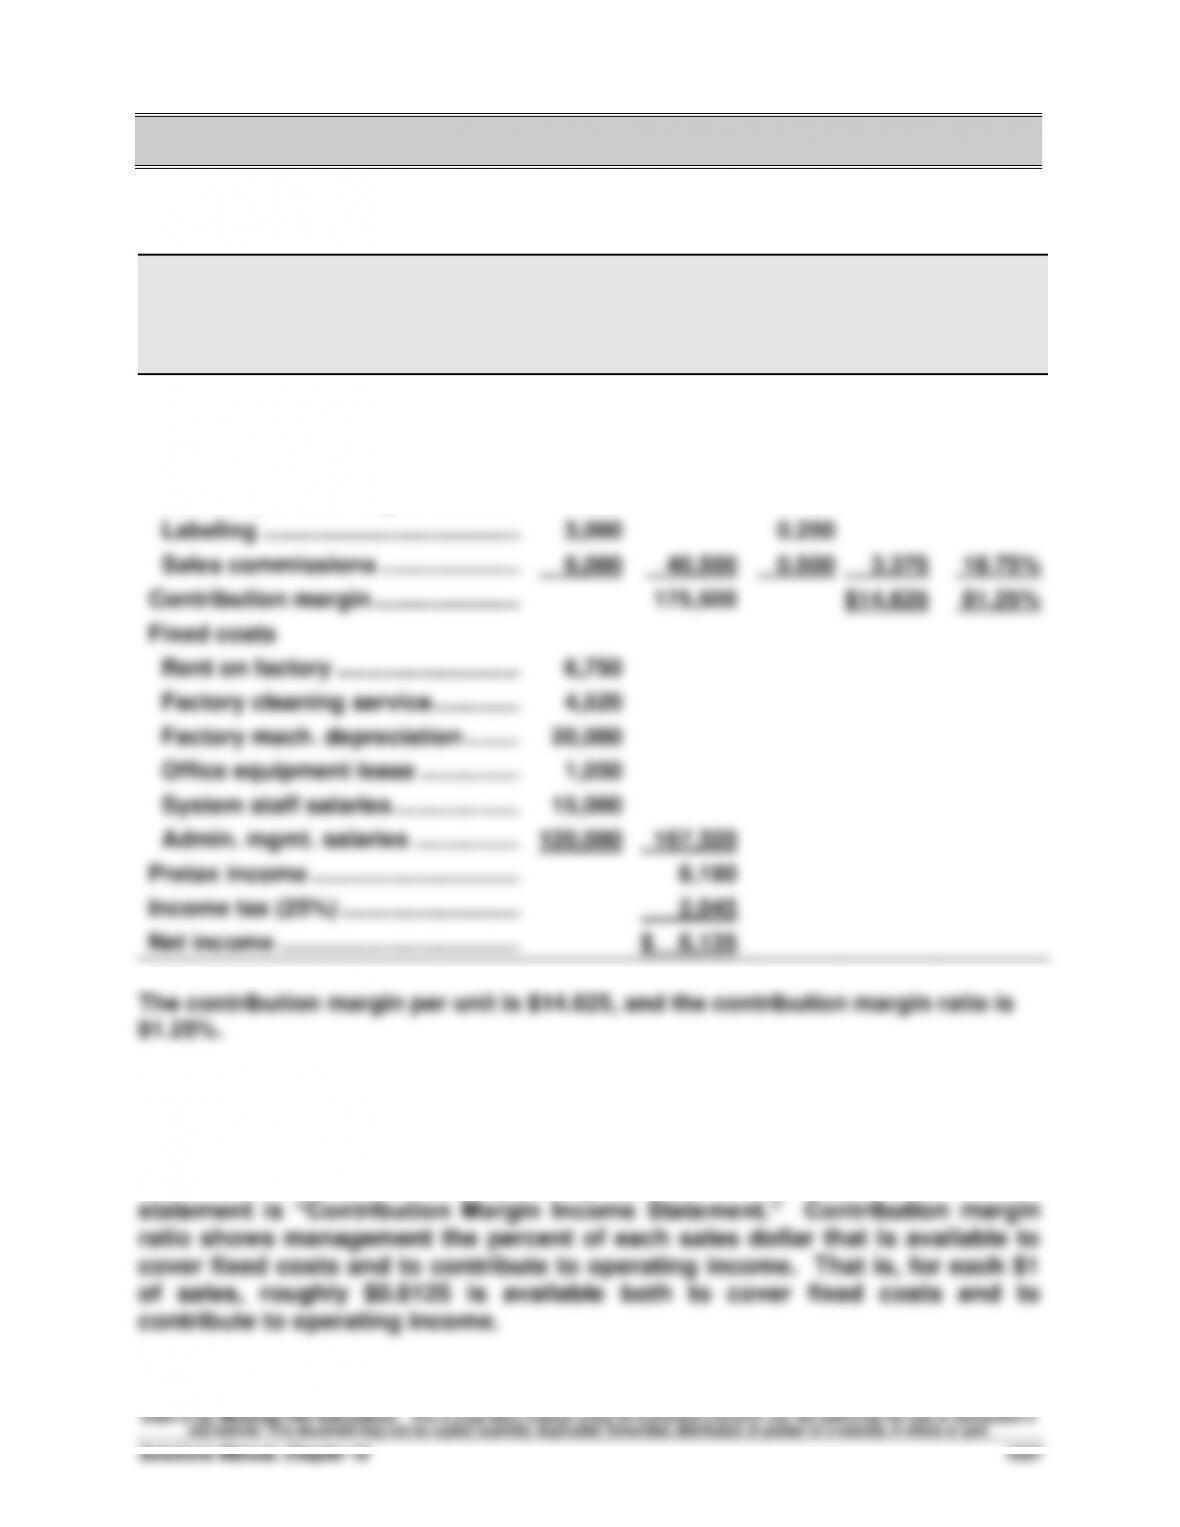
Gilmore Company
Contribution Margin Income Statement
For Year Ended December 31, 2013
(12,000 units) Per unit % of sales
Sales ($18 x 12,000) ………………….…….
$216,000
$18.000
100.00%
Variable costs
Plastic for CD sets ………………….…….
$ 1,500
$0.125
Assembly worker wages …………..…….
30,000
2.500
Labeling ……………………………….…….
3,000
0.250
Sales commissions ………………..…….
6,000
40,500
0.500
3.375
18.75%
Contribution margin ……………………….
175,500
$14.625
81.25%
Fixed costs
Rent on factory ………………………..…
6,750
Factory cleaning service …………..…….
4,520
Factory mach. depreciation …………….
20,000
Office equipment lease …………….…….
1,050
System staff salaries ………………..…….
15,000
Admin. mgmt. salaries ……………..…….
120,000
167,320
Pretax income ………………………………….
8,180
Income tax (25%) ……………………….….
2,045
Net income ………………………………..…….
$ 6,135
Part 3 Analysis Component
Contribution margin shows how much of total sales are available to cover
fixed costs and contribute to operating income. This is why the title for this
Financial & Managerial Accounting, 5th Edition
1038
Problem 18-2B (40 minutes)
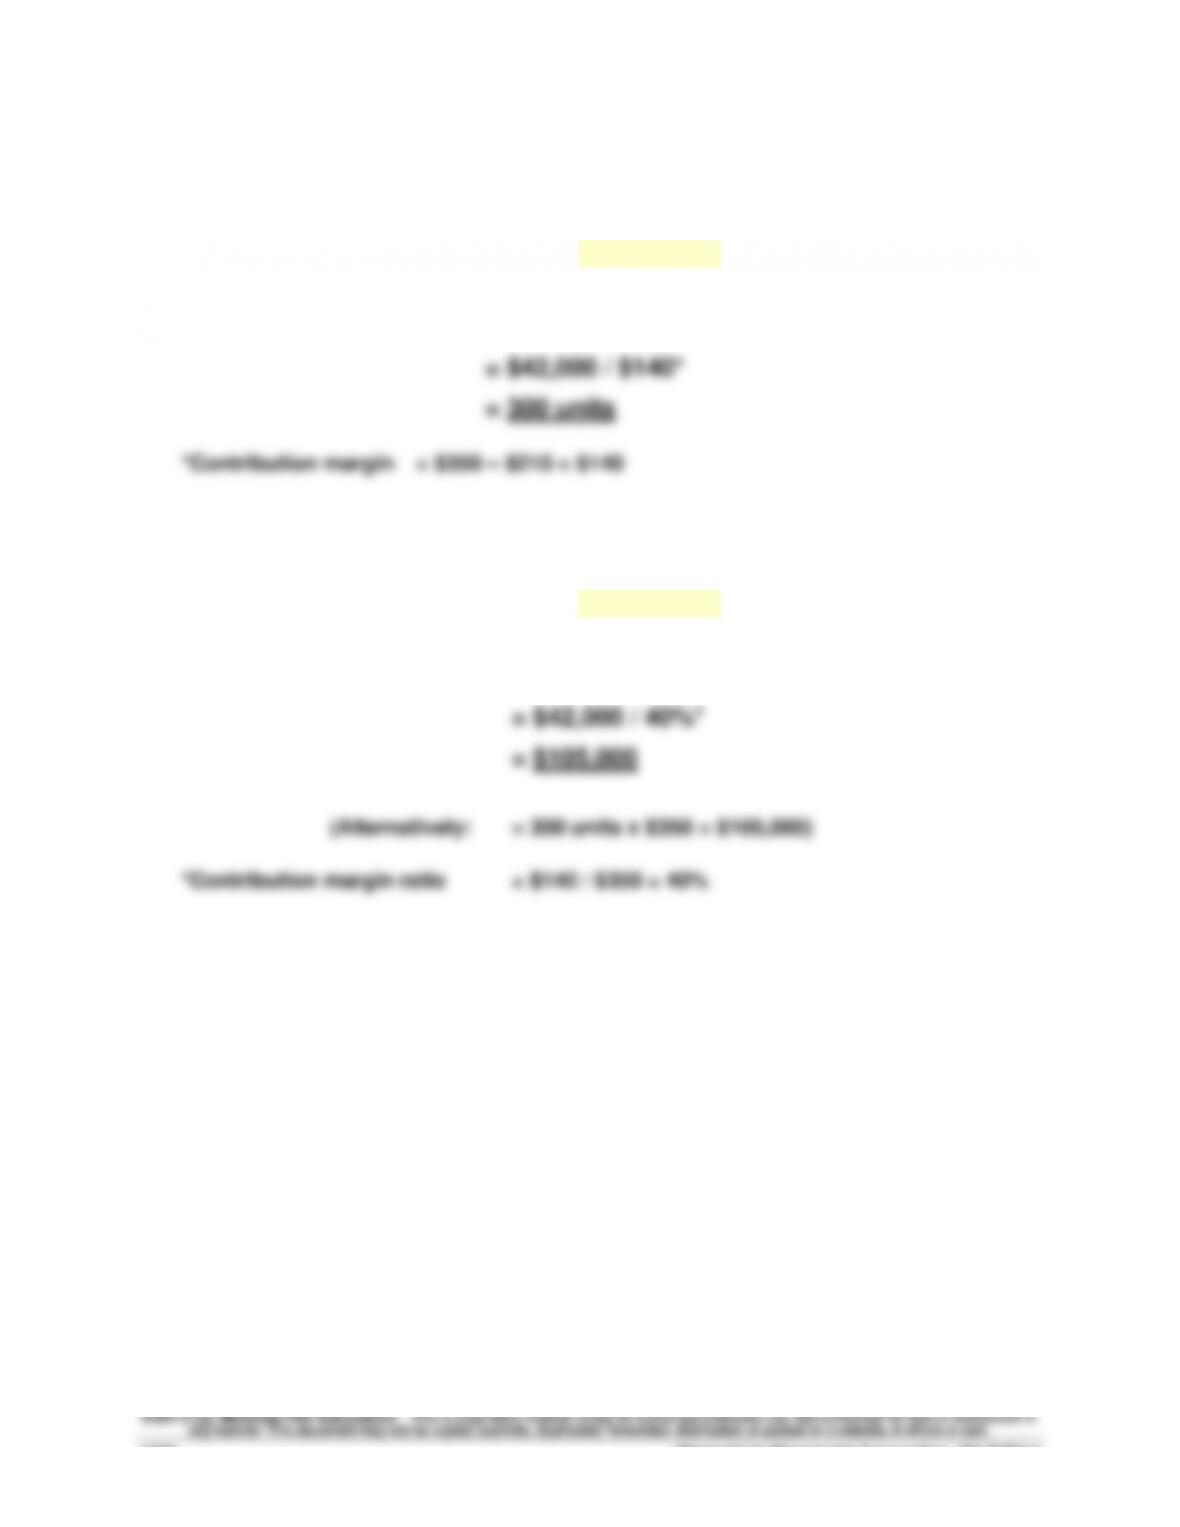
Part 1
(a) Instructor note: Use the equation in Exhibit 18.11
Break-even in unit sales = Fixed costs / Contribution margin per unit
(b) Instructor note: Use the equation in Exhibit 18.12
Break-even in dollar sales = Fixed costs / Contribution margin ratio
Problem 18–2B (Continued)
Part 2
Part 3
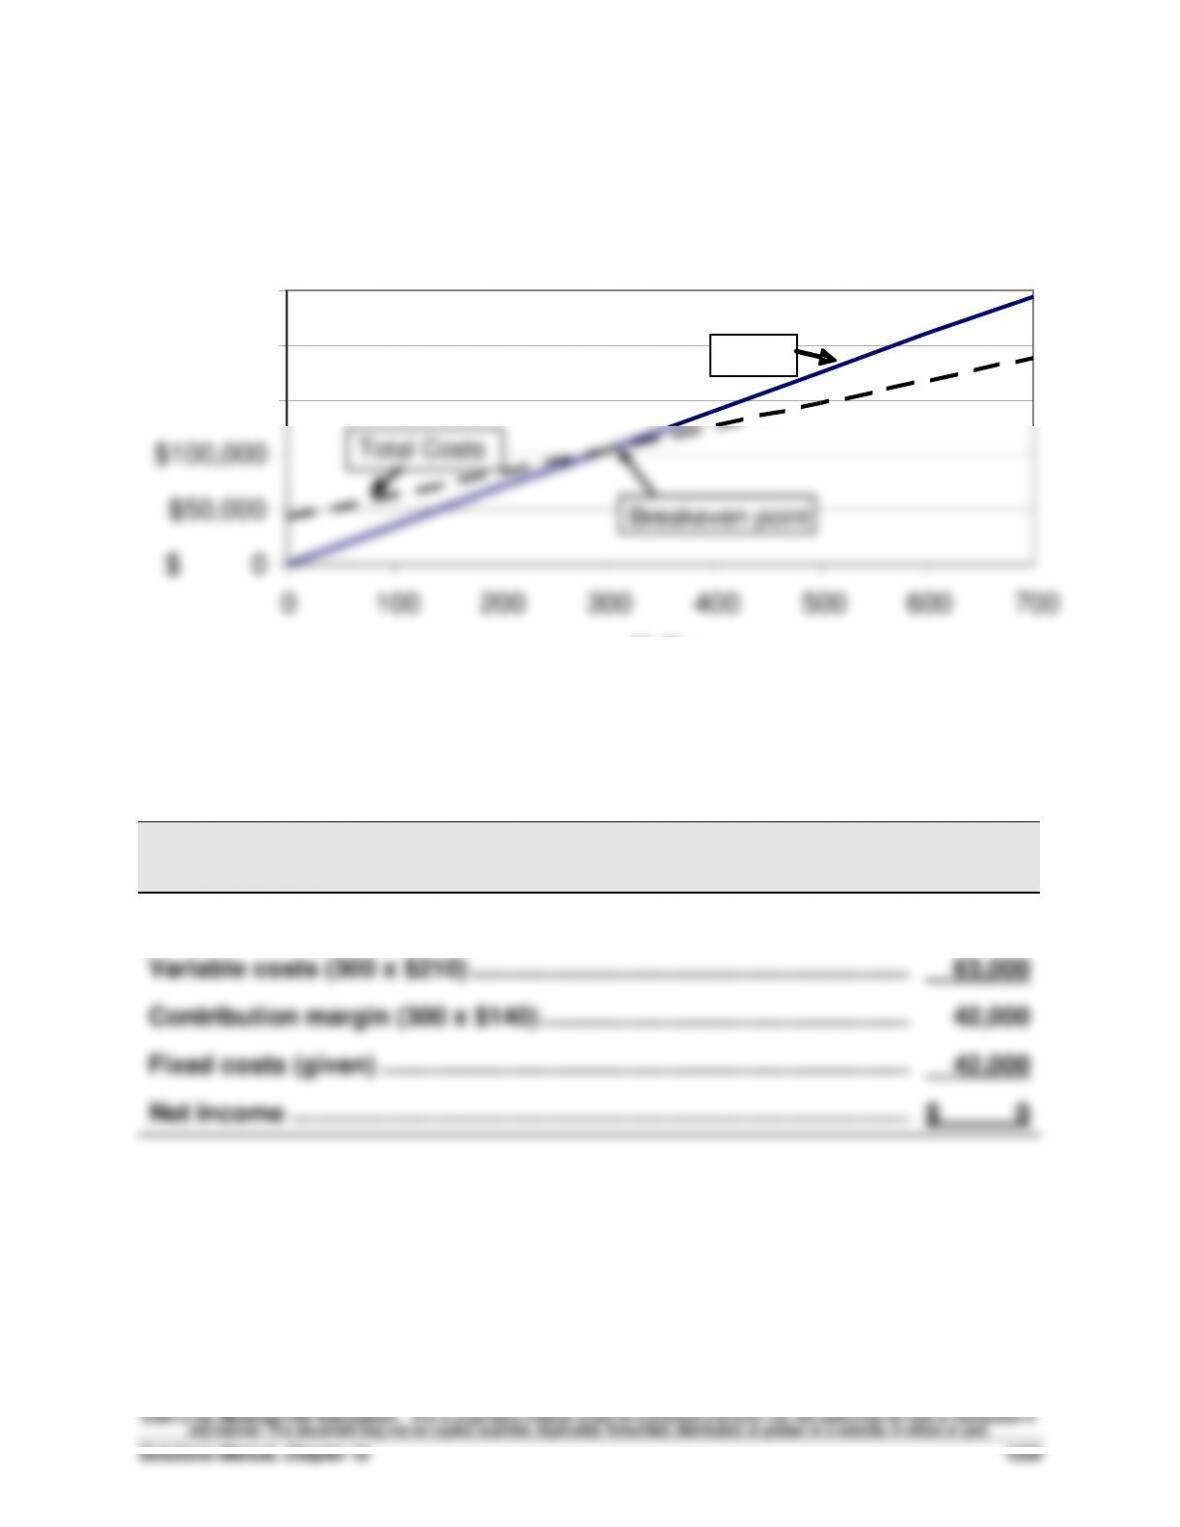
HIP-HOP CO.
Contribution Margin Income Statement (at Break-Even) — Keyboards
Sales (300 x $350) ……………………………………………………………………..
$105,000
Variable costs (300 x $210) ……………………………………………………….
63,000
Contribution margin (300 x $140) ……………………………………………….
42,000
Fixed costs (given) …………………………………………………………………...
42,000
Net income ……………………………………………………………………………….
$ 0
Hip-Hop Company CVP chart
$ 0
$50,000
$100,000
$150,000
$200,000
$250,000
0
100
200
300
400
500
600
700
Units
Sales
Total Costs
Breakeven point
Financial & Managerial Accounting, 5th Edition
1040
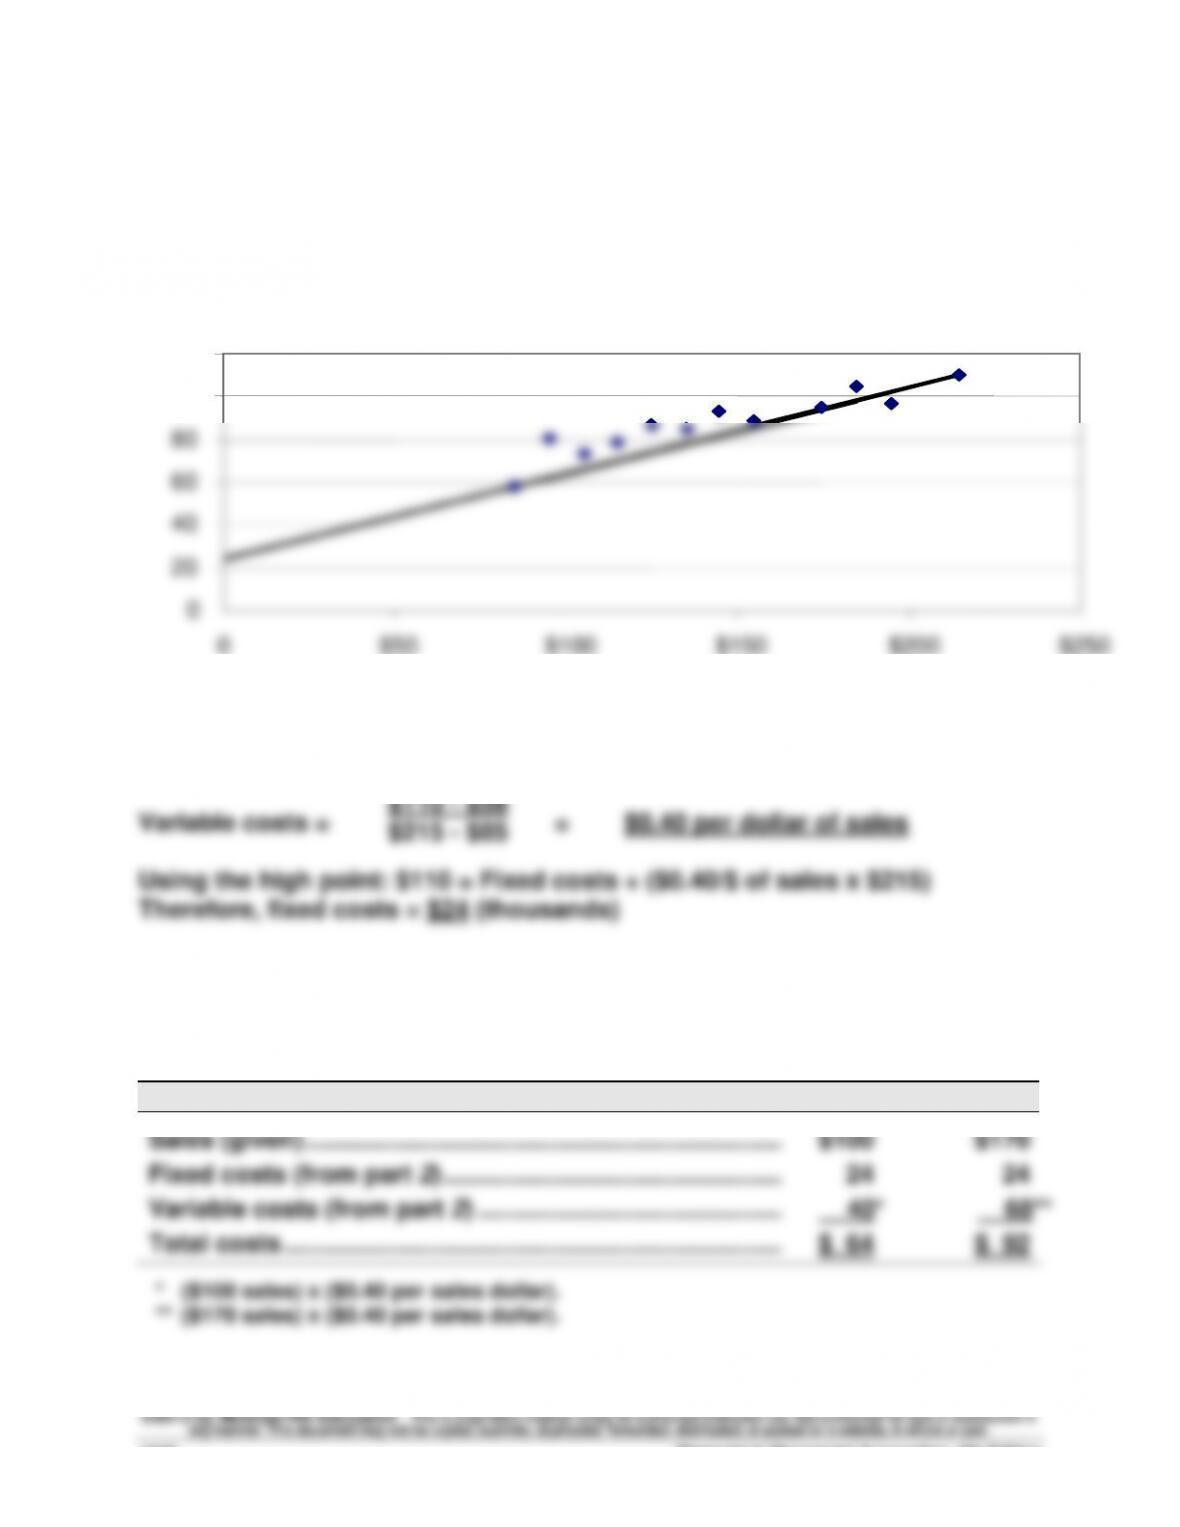
Problem 18-3B (45 minutes)
Parts 1 and 2
The scatter diagram and its estimated line of cost behavior appear below.
Sales and cost amounts are in thousands of dollars.
Part 2 Calculation of variable and fixed costs
Part 3
The estimates in Part 2 can be used to predict the total costs that will be
incurred at sales levels of $100 and $170 (both in thousands).
(‘000s)
Predictions
Sales (given) …………………………………………………………………..
$100
$170
Fixed costs (from part 2) ………………………………………….……..
24
24
Variable costs (from part 2) …………………………..………………..
40*
68**
Total costs ……………………………………………………………………..
$ 64
$ 92
* ($100 sales) x ($0.40 per sales dollar).
** ($170 sales) x ($0.40 per sales dollar).
Kyo Company
0
20
40
60
80
100
$120
0
$50
$100
$150
$200
$250
Sales Dollars
Total
Costs
$110 – $58
Problem 18-4B (75 minutes)
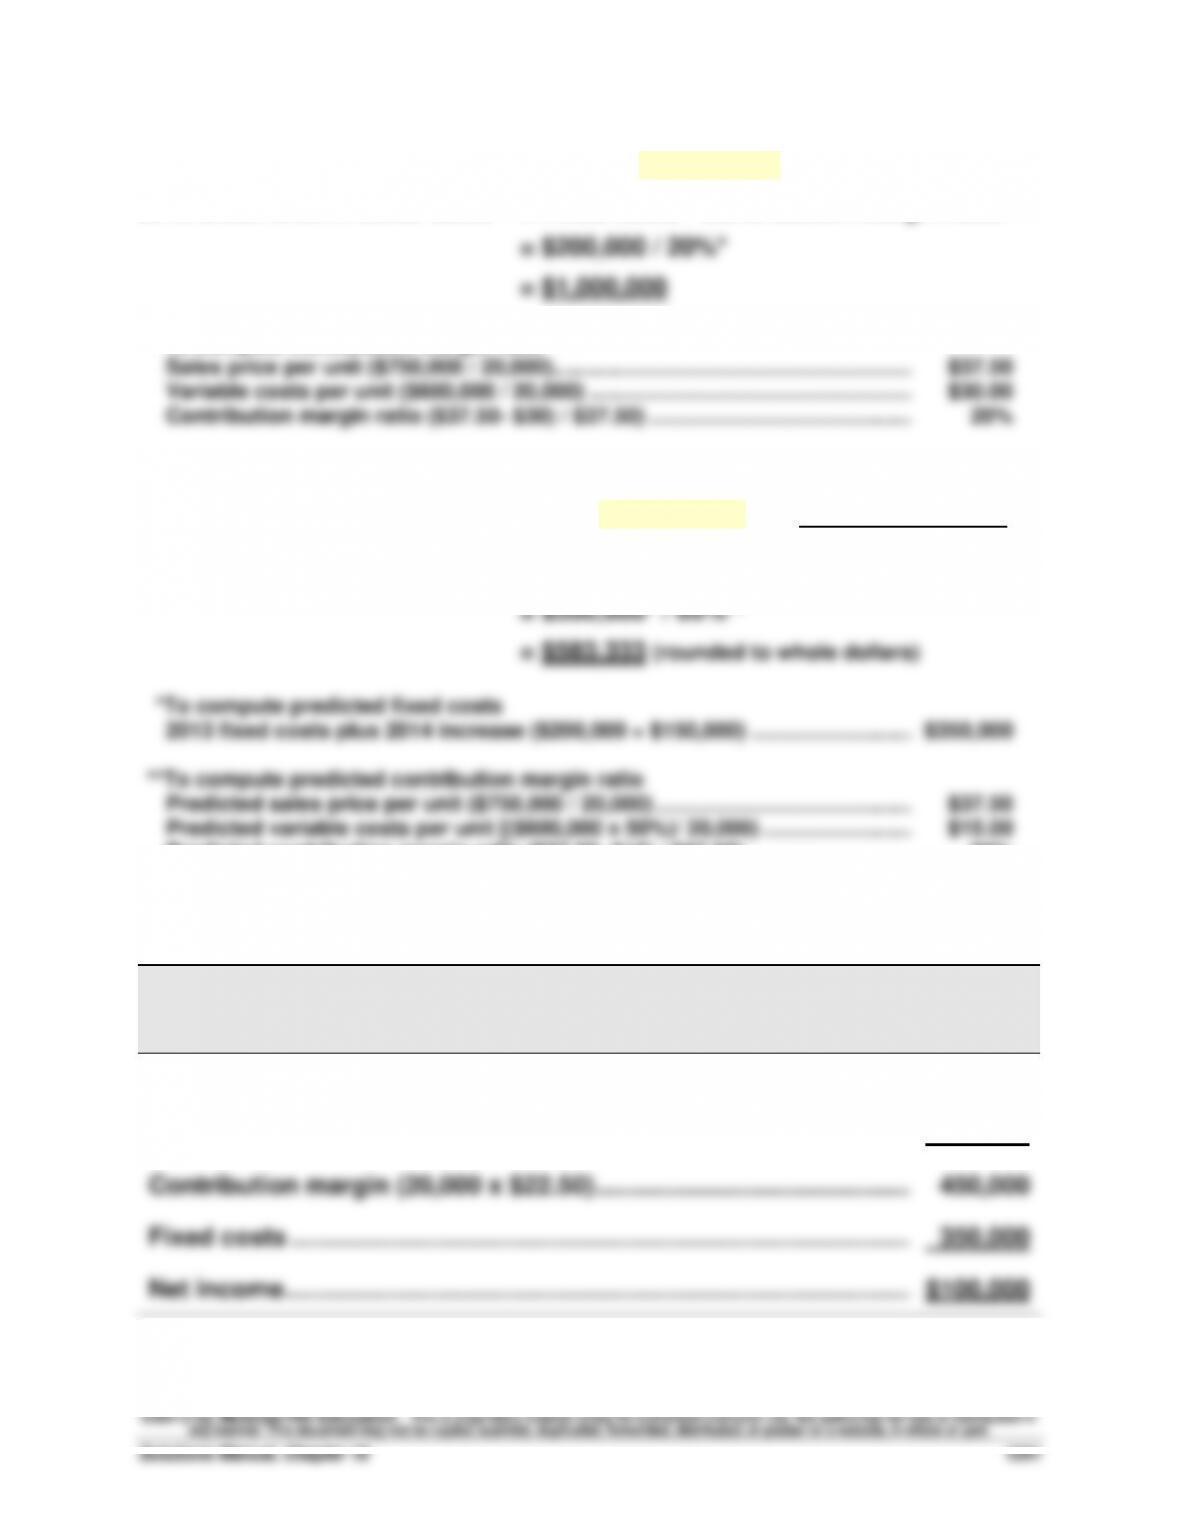
Part 1 Instructor note: Use the equation in Exhibit 18.12
2013 break-even in dollar sales = Fixed costs / Contribution margin ratio
*To compute contribution margin ratio
Sales price per unit ($750,000 / 20,000)……………………………………………………….
$37.50
Variable costs per unit ($600,000 / 20,000) ……………………………………………………..
$30.00
Contribution margin ratio ($37.50- $30) / $37.50) ……………………………………..……..
20%
Part 2 Instructor note: Use equation in Exhibit 18.12 with predicted numbers
2014 break-even in dollar sales = Fixed costs / Contribution margin ratio
2013 fixed costs plus 2014 increase ($200,000 + $150,000) …………………………..
$350,000
**To compute predicted contribution margin ratio
Predicted sales price per unit ($750,000 / 20,000) …………………………………….……..
$37.50
Predicted variable costs per unit [($600,000 x 50%)/ 20,000) …………………….…….
$15.00
Predicted contribution margin ratio ($37.50- $15) / $37.50) ……………………….….
60%
Part 3
RIVERA COMPANY
Forecasted Contribution Margin Income Statement
For Year Ended December 31, 2014
Sales (20,000 x $37.50) ……………………………………………………………..….
$750,000
Variable costs (20,000 x $15) …………………………………………………….…
300,000
Contribution margin (20,000 x $22.50) ……………………………………….….
450,000
Fixed costs ………………………………………………………………………………….
350,000
Net income ……………………………………………………………………………….….
$100,000
Problem 18-4B (Continued)
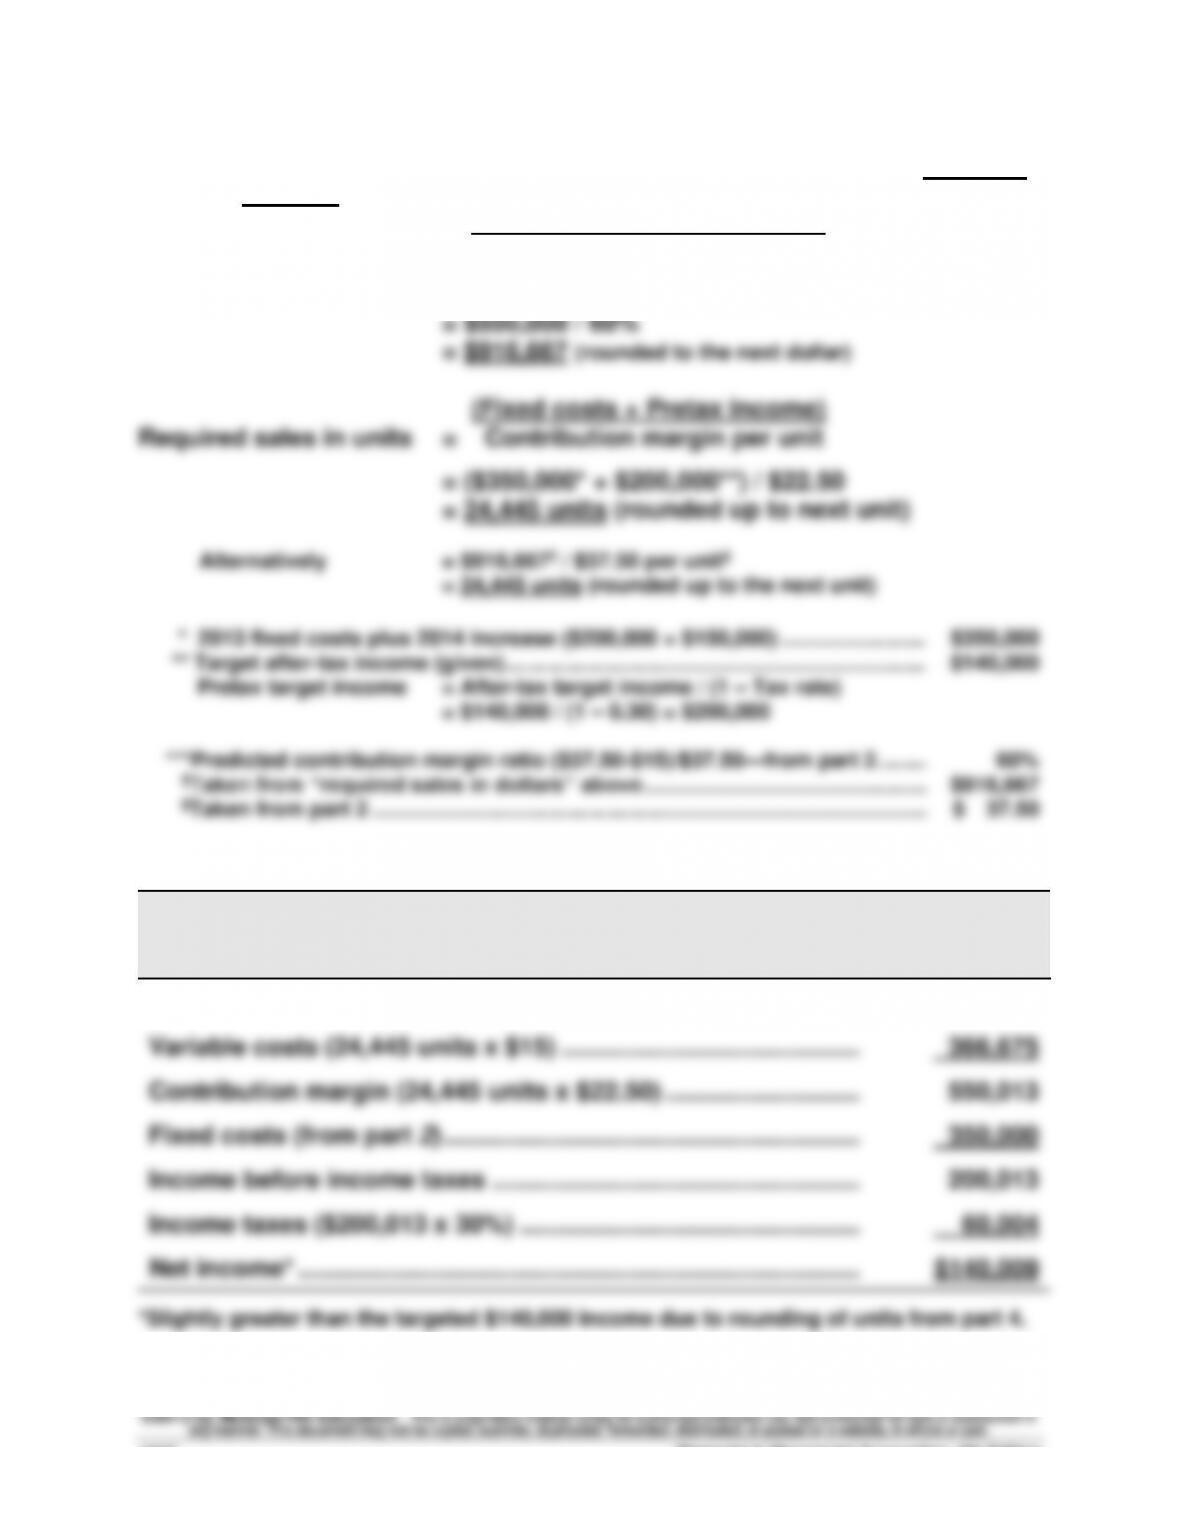
Part 4 Instructor note: Use equations in Exhibit 18.22 and 18.23 with predicted
numbers
(Fixed costs + Pretax income)
Required sales in dollars = Contribution margin ratio
= ($350,000* + $200,000**) / 60%***
Problem 18-5B (65 minutes)
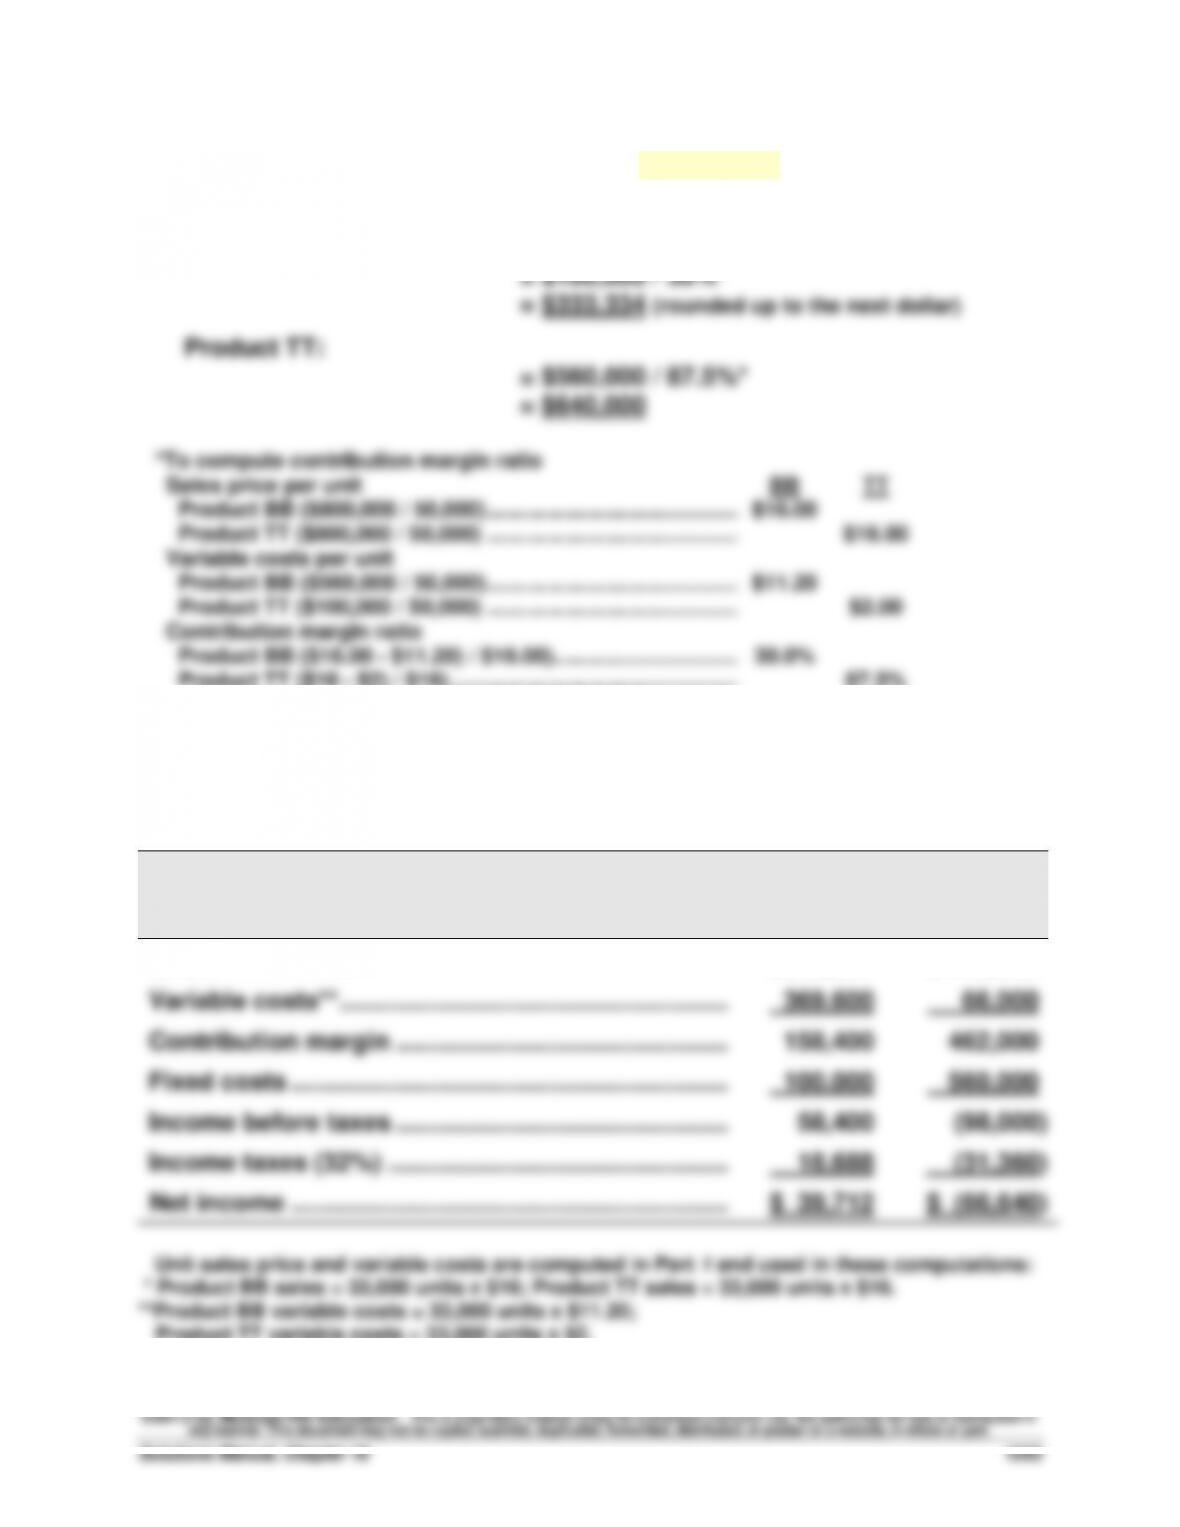
Part 1 Instructor note: Use the equation in Exhibit 18.12
Break-even in dollar sales = Fixed costs / Contribution margin ratio
Product BB:
Financial & Managerial Accounting, 5th Edition
1044
Problem 18–5B (Continued)
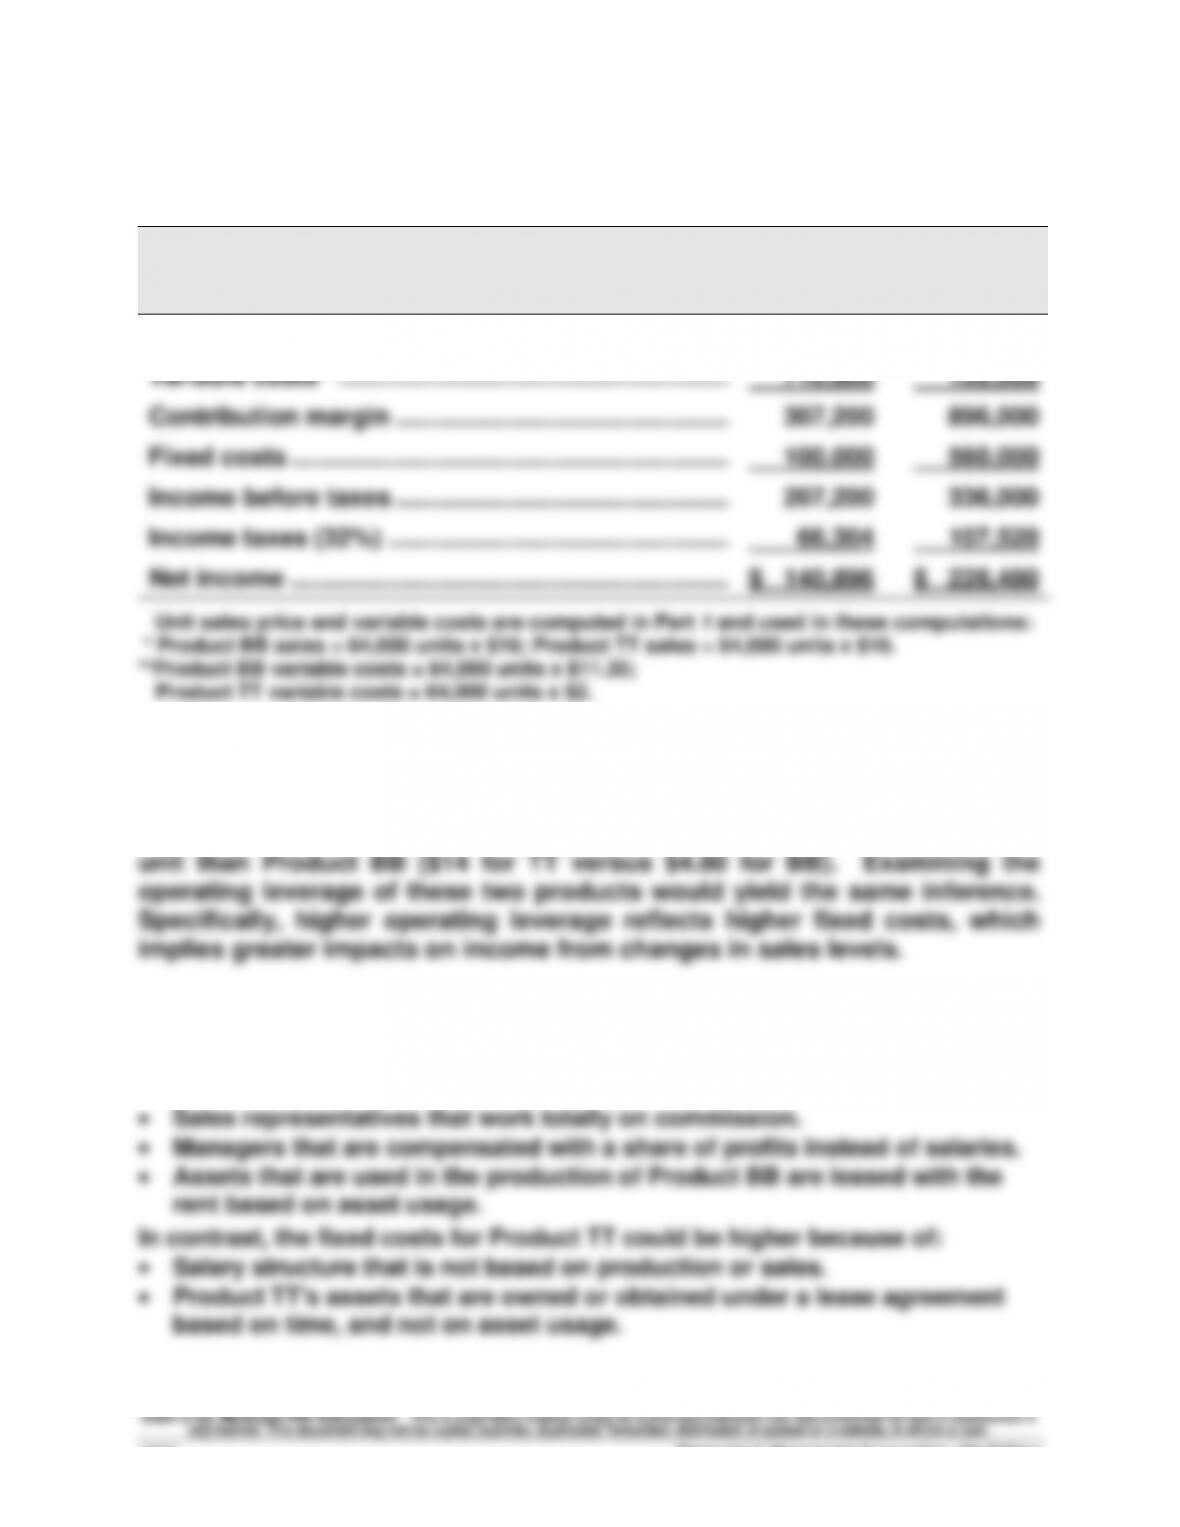
Forecasted contribution margin income statements for each product
assuming sales increase to 64,000 units with no change in unit sales price
MINGEI CO.
Forecasted Contribution Margin Income Statement
Product BB
Product TT
Sales* …………………………………………………………………
$1,024,000
$1,024,000
Variable costs** ………………………………………………..…
716,800
128,000
Contribution margin ……………………………………………
307,200
896,000
Fixed costs ……………………………………………………….
100,000
560,000
Income before taxes ……………………………………………
207,200
336,000
Income taxes (32%) ………………………………………….…
66,304
107,520
Net income ……………………………………………………….
$ 140,896
$ 228,480
Unit sales price and variable costs are computed in Part 1 and used in these computations:
* Product BB sales = 64,000 units x $16; Product TT sales = 64,000 units x $16.
**Product BB variable costs = 64,000 units x $11.20;
Product TT variable costs = 64,000 units x $2.
Part 4
If sales were to greatly increase, Product TT would experience the greater
increase in income because it would gain more contribution margin per
Part 5
Factors that could cause Product BB to have lower fixed costs include:
• Labor arrangement that pays workers for units produced.
Problem 18-6B (45 minutes)
Part 1 Instructor note: Use the equation in Exhibit 18.12
Break-even in dollar sales = Fixed costs / Contribution margin ratio
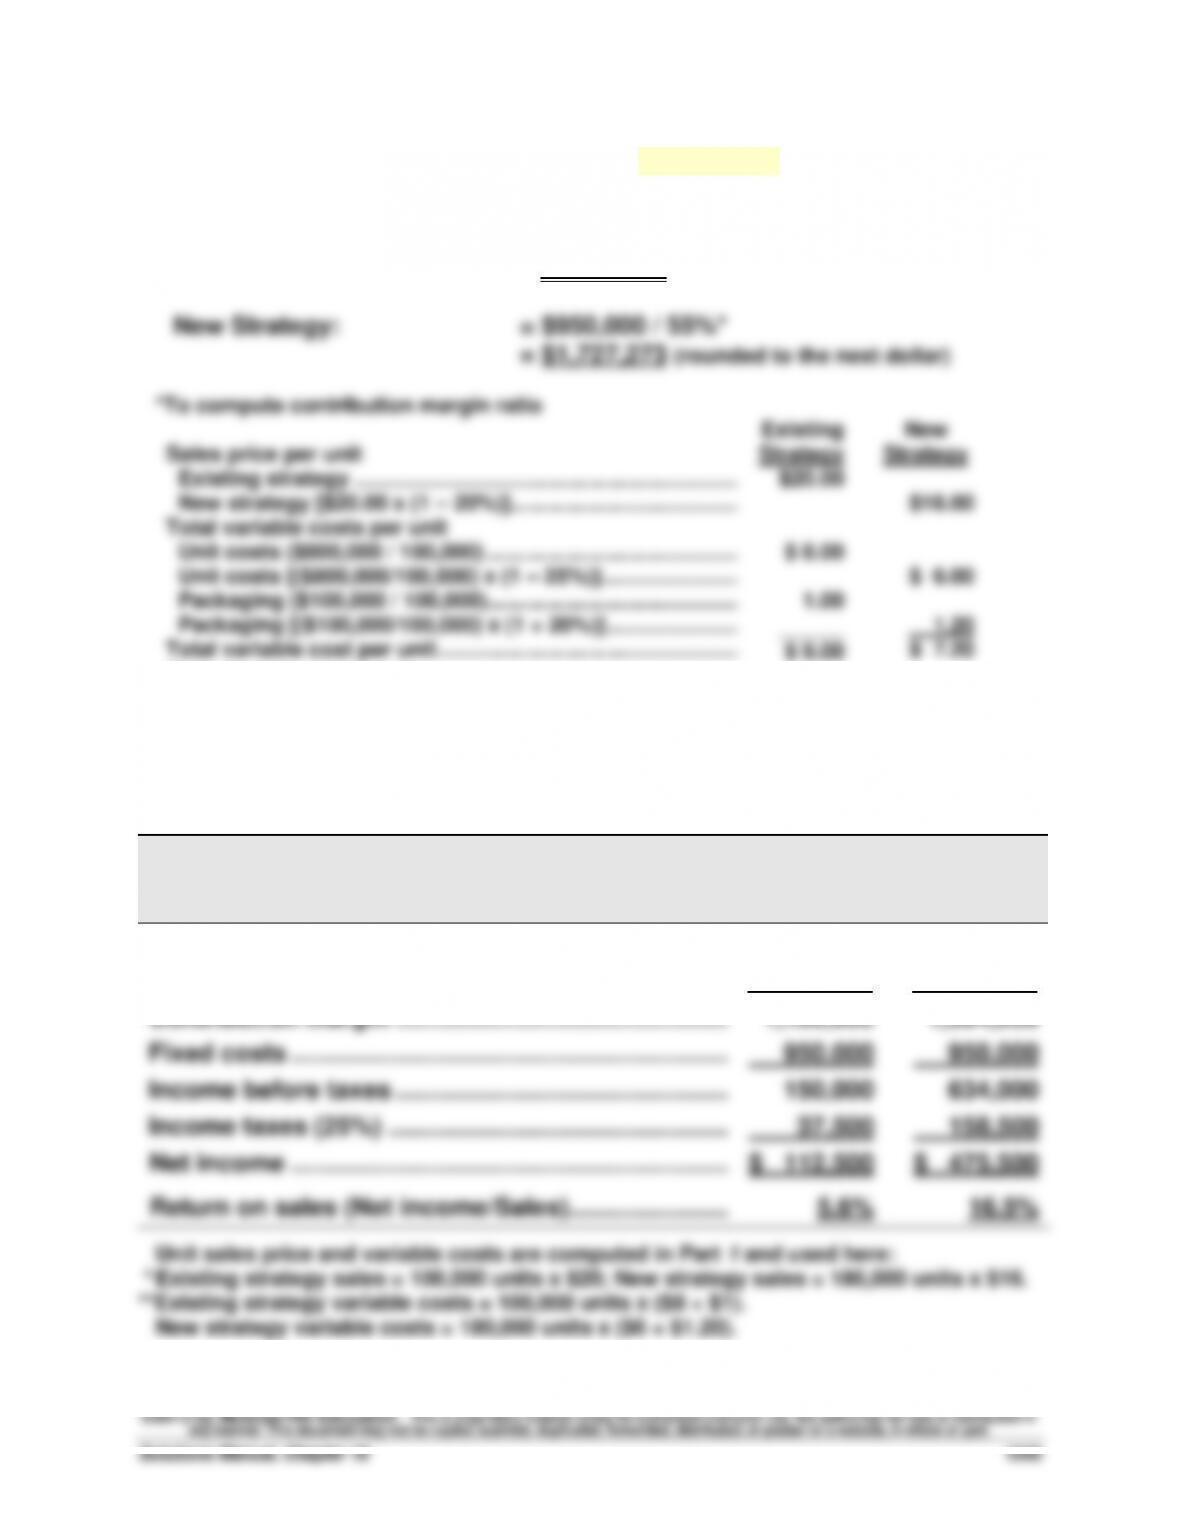
Existing Strategy: = $950,000 / 55%*
= $1,727,273 (rounded to the next dollar)