
Chapter 13 – Analyzing Financial Statements
website, in whole or part. 13–1
Chapter 13
Analyzing Financial Statements
Student Learning Objectives and Related Assignment Materials*
Student Learning Objectives
Discussion
Questions
Quick
Studies
Exercises
Problems
(A &B set)**
Beyond the
Numbers
Conceptual objectives:
C1. Explain the purpose and identify
the building blocks of analysis.
1, 2, 3
13-1
13-1
HTR
C2. Describe standards for
comparisons in analysis.
13-5, 13-9
13-2
CA
Analytical objectives:
A1. Summarize and report
results of analysis.
13-7
13-6
13-2, 13-5
RIA, EC, CIP,
ED, GD
A2. Explain the form and assess the
content of a complete income
statement. (Appendix 13A)
13
13-8
13-13, 13-14
13-6
Procedural objectives:
P1. Explain and apply
methods of horizontal analysis.
13-2, 13-4
13-3, 13-4
13-1, 13-2
RIA, TIA, ED
P2. Describe and apply
methods of vertical analysis.
13-3
13-4, 13-5,
13-7
13-1, 13-3
RIA, CA,
TIA, ED
P3. Define and apply ratio analysis.
4, 5, 6, 7, 8, 9,
10, 11, 12, 14,
15, 16, 17
13-6
13-8, 13-9,
13-10, 13-11,
13-12, 13-15
13-1, 13-3,
13-4, 13-5
CIP, TTN,
TIA, ED,
HTR
* Assignment materials that can be completed by students using:
Sage 50 and QuickBooks Pro 2013 templates – none
Excel templates – Problems 13-1A, 13-3A and 13-4A.

Chapter 13 – Analyzing Financial Statements
Synopsis of Chapter Revisions
• Motley Fool: Revised opener with new entrepreneurial assignment
• New companies—Polaris, Arctic Cat,
• KTM and Piaggio—data throughout the
• chapter, exhibits, and illustrations
• New boxed discussion on the role of financial statement analysis to fight and prevent fraud
• Enhanced horizontal, vertical, ratio analysis using new companies and industry data
• Streamlined global view section
PowerPoint® Show Slides
Chapter Learning Objective
PowerPoint® Slides
C1
6-8
C2
7
P1
9-17
P2
18-23
P3
24-54
A1
55
Chapter 13 – Analyzing Financial Statements
Chapter Outline
Notes
I. Basics of Analysis—Transforming data into useful information for
decision making.
A. Purpose of Analysis
To help users (both internal and external) make better business
decisions.
1. Internal users (managers, officers, internal auditors,
consultants, budget officers, and market researchers) make the
strategic and operating decisions of a company.
2. External users (shareholders, lenders, directors, customers,
suppliers, regulators, lawyers, brokers, and the press) rely on
financial statement analysis to make decisions in pursuing
their own goals.
3. The common goal of all users is to evaluate:
a. Past and current performance.
b. Current financial position.
c. Future performance and risk.
B. Building Blocks of Analysis
The four areas of inquiry or building blocks are:
1. Liquidity and efficiency—ability to meet short-term
obligations and to efficiently generate revenues.
2. Solvency—ability to generate future revenues and meet long-
term obligations.
3. Profitability—ability to provide financial rewards sufficient to
attract and retain financing.
4. Market Prospects—ability to generate positive market
expectations.
C. Information for Analysis
1. Most users rely on general purpose financial statements that
include:
a. Income statement
b. Balance sheet
c. Statement of changes in stockholders’ equity (or statement
of retained earnings)
d. Statement of cash flows
e. Notes related to the statements
2. Financial reporting—is the communication of financial
information useful for making investment, credit, and other
business decisions. Includes information from SCE 10-K or
other filings, press releases, shareholders’ meetings, forecasts,
management letters, auditor’s reports, and Webcasts.
Chapter 13 – Analyzing Financial Statements
Chapter Outline
Notes
D. Standards for Comparisons
Used to determine if analysis measures suggest good, bad, or
average performance. Standards can include the following types of
comparisons:
1. Intracompany—based on prior performance and relationships
between its financial items.
2. Competitor—compared to one or more direct competitors
(often best).
3. Industry—published industry statistics (available from
services like Dun & Bradstreet, Standard and Poor’s, and
Moody’s).
4. Guidelines (rules-of-thumb)—general standards developed
from past experiences.
E. Tools of Analysis – includes horizontal, vertical and ratio analysis.
II. Horizontal Analysis—Tool to evaluate changes in financial statement
data across time. This analysis utilizes:
A. Comparative Statements—reports financial amounts for more
than one period placed side by side in columns on a single
statement.
1. Computation of Dollar Changes and Percentage
Changes—usually shown in line items.
a. Dollar change = Analysis period amount minus Base
period amount.
b. Percent change = Analysis period amount minus Base
period amount divided by Base period amount times
100.
Notes:
(1) When a negative amount appears in the base period and a
positive amount in the analysis period (or vice versa)— a
meaningful percentage change cannot be computed.
(2) When there is no value in the base period—percentage
change is not computable.
(3) When an item has a value in the base period and zero in
the next period—the decrease is 100 percent.
2. Comparative balance sheets
a. Consist of balance sheet amounts from two or more
balance sheet dates arranged side by side.
b. Usefulness is improved by showing each item’s dollar
change and percent change to highlight large changes.
3. Comparative income statements
a. Amounts for two or more period are placed side by side.
b. Additional columns are included for dollar and percent
changes.
Chapter 13 – Analyzing Financial Statements
Chapter Outline
Notes
B. Trend Analysis—used to reveal patterns in data across successive
periods. Involves computing trend percents (or index number) as
follows:
1. Select a base period and assign each item in the base period a
weight of 100%.
2. Express financial numbers as a percent of their base period
number.
3. Trend percent equals analysis period amount divided by base
period amount times 100.
III. Vertical Analysis—Comparing financial condition and performance
to a base amount. The analysis tools include:
A. Common-Size Statements—reveal changes in the relative
importance of each financial statement item. All amounts are
redefined in terms of common-size percents.
1. Common-size percentage equals analysis amount divided by
base amounts multiplied by 100.
2. Common-size balance sheets—base amount is usually total
assets.
3. Common-size income statements—base amount is usually
revenues.
B. Common-Size Graphics
Graphical analysis (e.g., pie charts and bar charts) of common-size
statements that visually highlight comparison information.
IV. Ratio Analysis—Using key relationships among financial statement
items. Ratios organized into the four (items A through D below)
building blocks of analysis:
A. Liquidity and Efficiency
1. Liquidity refers to the availability of resources to meet short-
term cash requirement.
2. Efficiency refers to how productive a company is in using its
assets. Efficiency is usually measured relative to how much
revenue is generated for a certain level of assets.
3. Ratios in this block:
a. Working capital—the excess of current assets over current
liabilities.
b. Current ratio—current assets divided by current liabilities;
describes a company’s ability to pay its short-term
obligations.
c. Acid-test ratio—similar to current ratio but focuses on
quick assets (i.e., cash, short-term investments and current
receivables) rather than current assets. Calculated as quick
assets divided by current liabilities.
Chapter 13 – Analyzing Financial Statements
Chapter Outline
Notes
d. Accounts receivable turnover—net sales or credit sales
divided by average accounts receivable; a measure of how
long it takes a company to collect its accounts.
e. Inventory turnover—cost of goods sold divided by
average inventory; the number of times a company’s
average inventory is sold during an accounting period.
f. Days’ sales uncollected—accounts receivable divided by
net credit sales multiplied by 365 days; measures how
frequently a company collects its accounts receivable.
g. Days’ sales in inventory—ending inventory divided by
cost of goods sold multiplied by 365; measures how many
days it will take to convert the inventory on hand at the
end of the period into accounts receivable or cash.
h. Total asset turnover—net sales divided by average total
assets; describes the ability to use assets to generate sales.
B. Solvency
1. Solvency refers to a company’s long-run financial viability and
its ability to cover long-term obligations. Capital structure is
one of the most important components of solvency analysis.
2. Capital structure refers to a company’s sources of financing.
3. Ratios in this block:
a. Debt ratio—total liabilities divided by total assets.
b. Equity ratio—total stockholders’ equity divided by total
assets.
Note: A company is considered less risky if its capital
structure (equity and long-term debt) is composed more of
equity.
c. Debt-to-Equity Ratio – total liabilities divided by total
equity; measure of solvency. A larger debt-to–equity ratio
implies greater risk.
d. Times interest earned—income before interest expense
and income taxes divided by interest expense; reflects the
risk of loan repayments with interest to creditors.
C. Profitability
1. Profitability refers to a company’s ability to generate an
adequate return on invested capital.
2. Return is judged by assessing earnings relative to the level and
sources of financing.
Chapter 13 – Analyzing Financial Statements
Chapter Outline
Notes
3. Ratios in this block:
a. Profit margin—net income divided by net sales; describes
the ability to earn net income from sales.
b. Return on total assets—net income divided by average total
assets; a summary measure of operating efficiency;
comprises profit margin (net income divided by net sales)
and total asset turnover (net sales divided by average total
assets).
c. Return on common stockholders’ equity—net income less
preferred dividends divided by average common
stockholders’ equity; measures the success of a company in
earning net income for its owners.
D. Market Prospects
1. Market measures are useful for analyzing corporations with
publicly traded stock.
2. Market measures use stock price in their computation.
3. Ratios in this block:
a. Price-earnings ratio—market price per common stock
divided by earnings per share; used to evaluate the
profitability of alternative common stock investments.
b. Dividend yield—annual cash dividends paid per share of
stock divided by market price per share; used to compare the
dividend-paying performance of different investment
alternatives.
E. Summary of Ratios
Exhibit 13.16 sets forth the names of each of the common ratios by
category, and includes the formula and a description of what is
measured by each ratio.
V. Global View
A. Horizontal and Vertical Analysis – horizontal and vertical analysis
helps eliminate many differences between GAAP and IFRS when
analyzing and interpreting financial statements.
B. Ratio Analysis – ratio analysis has many of the advantages and
disadvantages of horizontal and vertical analysis. The ratios applied
are fine, with some possible changes in interpretation depending on
what and what is not included in certain accounting measures across
GAAP and IFRS.
VI. Decision Analysis—Analysis Reporting
Goal of financial statement analysis report is to reduce uncertainty
through rigorous and sound evaluation. A good analysis report usually
consists of six sections:

Chapter 13 – Analyzing Financial Statements
Chapter Outline
Notes
1. Executive summary.
2. Analysis overview.
3. Evidential matter.
4. Assumptions.
5. Key factors.
6. Inferences
VII. Sustainable Income – Appendix 13A
When a company’s activities involve income-related events that are not
part of its normal, continuing operations, it often separates the income
statement into different sections as follows:
A. Continuing Operations
Reports the revenues, expenses, and income generated by the
company’s continuing operations.
B. Discontinued Segments
1. A business segment is a part of a company’s operations that
serves a particular line of business or class of customers.
2. A company’s gain or loss from selling or closing down a
segment is separately reported as follows:
a. Income from operating the discontinued segment for the
current period prior to its disposal.
b. The gain or loss from disposing of the segment’s net assets.
C. Extraordinary Items
1. Extraordinary gains and losses are those that are both unusual
and infrequent.
a. An unusual gain or loss is abnormal or otherwise unrelated
to the company’s regular activities and environment.
b. An infrequent gain or loss is not expected to recur given
the company’s operating environment.
2. Reporting extraordinary items in a separate category helps users
predict future performance, absent the effects of the
extraordinary items.
3. Items that are either unusual or infrequent, but not both, are
reported in the income statement but after the normal revenues
and expenses.
D. Earnings per Share (EPS)— is the amount of income earned by
each share of outstanding common stock and is reported in the final
section of income statement. One of the most widely cited items of
accounting information.
E. Changes in Accounting Principles
accounting principles are acceptable if justified as

Chapter 13 – Analyzing Financial Statements
Chapter Outline
Notes
improvements in financial reporting.
2. Cumulative effect of the change on prior periods’ incomes
should be reported on the income statement (net of taxes) below
extraordinary items.
3. A footnote should describe and justify the change and report
what income would have been under the old method.
.

Chapter 13 – Analyzing Financial Statements
website, in whole or part. 13–10
Chapter 13 – Alternate Demonstration Problem #1
Following are data from the statements of two companies selling similar
products:
Current Year-End Balance Sheets
Sled
Company
Zip
Company
Cash ………………………………………………………………
$ 11,900
$ 20,000
Notes receivable …………………………………………….
7,700
3,200
Accounts receivable, net ………………………………..
42,000
64,000
Inventory ……………………………………………………….
58,800
87,680
Prepaid expenses …………………………………………..
1,680
3,520
Plant and equipment, net ………………………………..
232,120
274,400
Total assets ……………………………………………………
$354,200
$452,800
Current liabilities ……………………………………………
$ 56,000
$ 80,000
Mortgage payable …………………………………………..
70,000
80,000
Common stock, $10 par value …………………………
140,000
160,000
Retained earnings ………………………………………….
88,200
132,800
Total liabilities and stockholders’ equity …………
$354,200
$452,800
Beginning–of-Year Data
Inventory …………………………..…………………………..
$ 53,200
$ 85,120
Total assets ……………………………………………………
345,800
443,200
Stockholders’ equity ………………………………………
217,000
285,120
Data from the Current Year’s Income Statement
Sales ……………………………………………………………..
$672,000
$880,000
Cost of goods sold …………………………………………
528,080
699,840
Interest expense …………………………………………….
4,200
5,600
Net income …………………………………………………….
23,373
28,896
Required:
1. Calculate current ratios, acid-test ratios, inventory turnovers, and
days’ sales uncollected for the two companies. Then state which
company you think is the better short-term credit risk and why.
2. Calculate return on total assets employed and return on
stockholders’ equity. Then, under the assumption that each
company’s stock can be purchased at book value, state which
company’s stock you think is the better investment and why.
Chapter 13 – Analyzing Financial Statements
website, in whole or part. 13–11
Solution: Chapter 13 – Alternate Demonstration Problem #1
Part 1:
Sled Company
Zip Company
Current ratio:
$122,080
$ 56,000
= 2.18 to 1
$178,400
$ 80,000
= 2.23 to 1
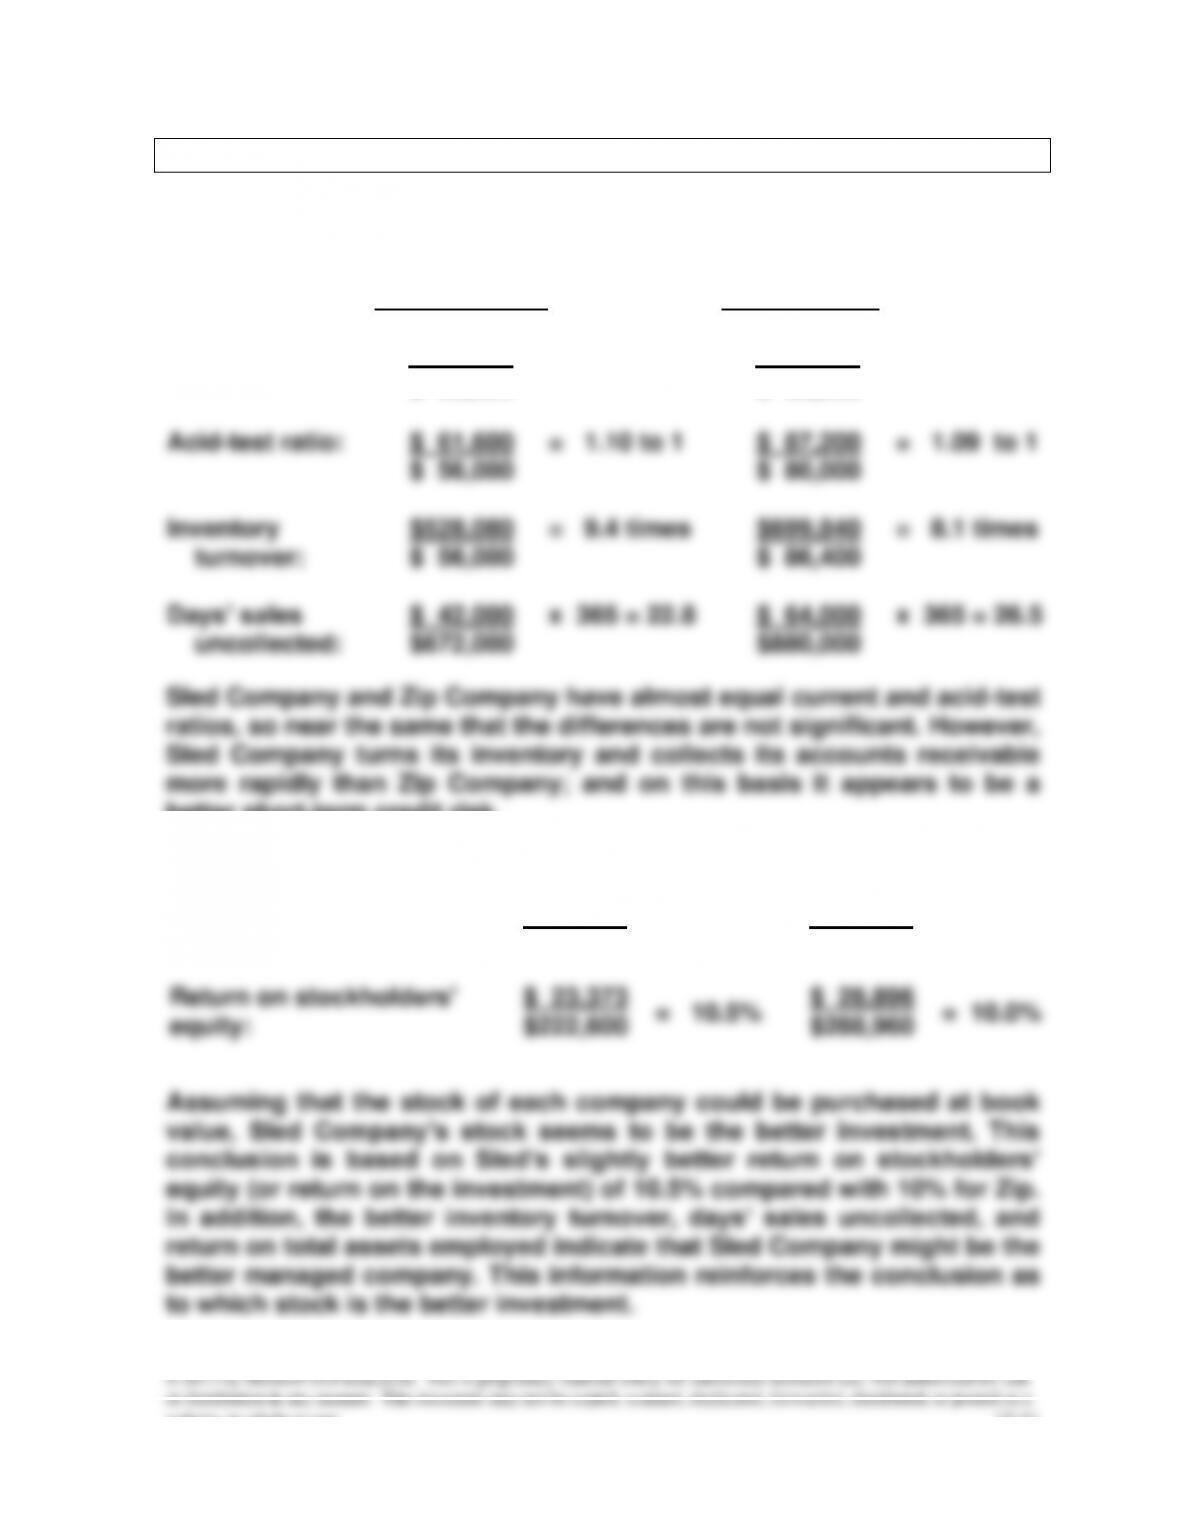
Acid-test ratio:
$ 61,600
$ 56,000
= 1.10 to 1
$ 87,200
$ 80,000
= 1.09 to 1
Inventory
turnover:
$528,080
$ 56,000
= 9.4 times
$699,840
$ 86,400
= 8.1 times
Days’ sales
uncollected:
$ 42,000
$672,000
x 365 = 22.8
$ 64,000
$880,000
x 365 = 26.5
Sled Company and Zip Company have almost equal current and acid-test
ratios, so near the same that the differences are not significant. However,
Sled Company turns its inventory and collects its accounts receivable
more rapidly than Zip Company; and on this basis it appears to be a
better short-term credit risk.
Part 2:
Return on total assets:
$ 23,373
$350,000
= 6.68%
$ 28,896
$448,000
= 6.45%
Return on stockholders’
equity:
$ 23,373
$222,600
= 10.5%
$ 28,896
$288,960
= 10.0%