Chapter 07 – Reporting and Interpreting Cost of Goods Sold and Inventory
E7–13.
Req. 1
Inventory turnover
=
Cost of Goods Sold
=
$48,260
=
35.68
Average Inventory
($1,301+$1,404)/2
Average days to sell inventory = 365 / inventory turnover = 365 / 35.68 = 10.2 days
Req. 2
Chapter 07 – Reporting and Interpreting Cost of Goods Sold and Inventory
E7–15.
Req. 1 The reported ending inventory for Ford was $5,901 million. If FIFO were used
exclusively, the ending inventory would have been $928 million higher than
Chapter 07 – Reporting and Interpreting Cost of Goods Sold and Inventory
E7–17.
Req. 1
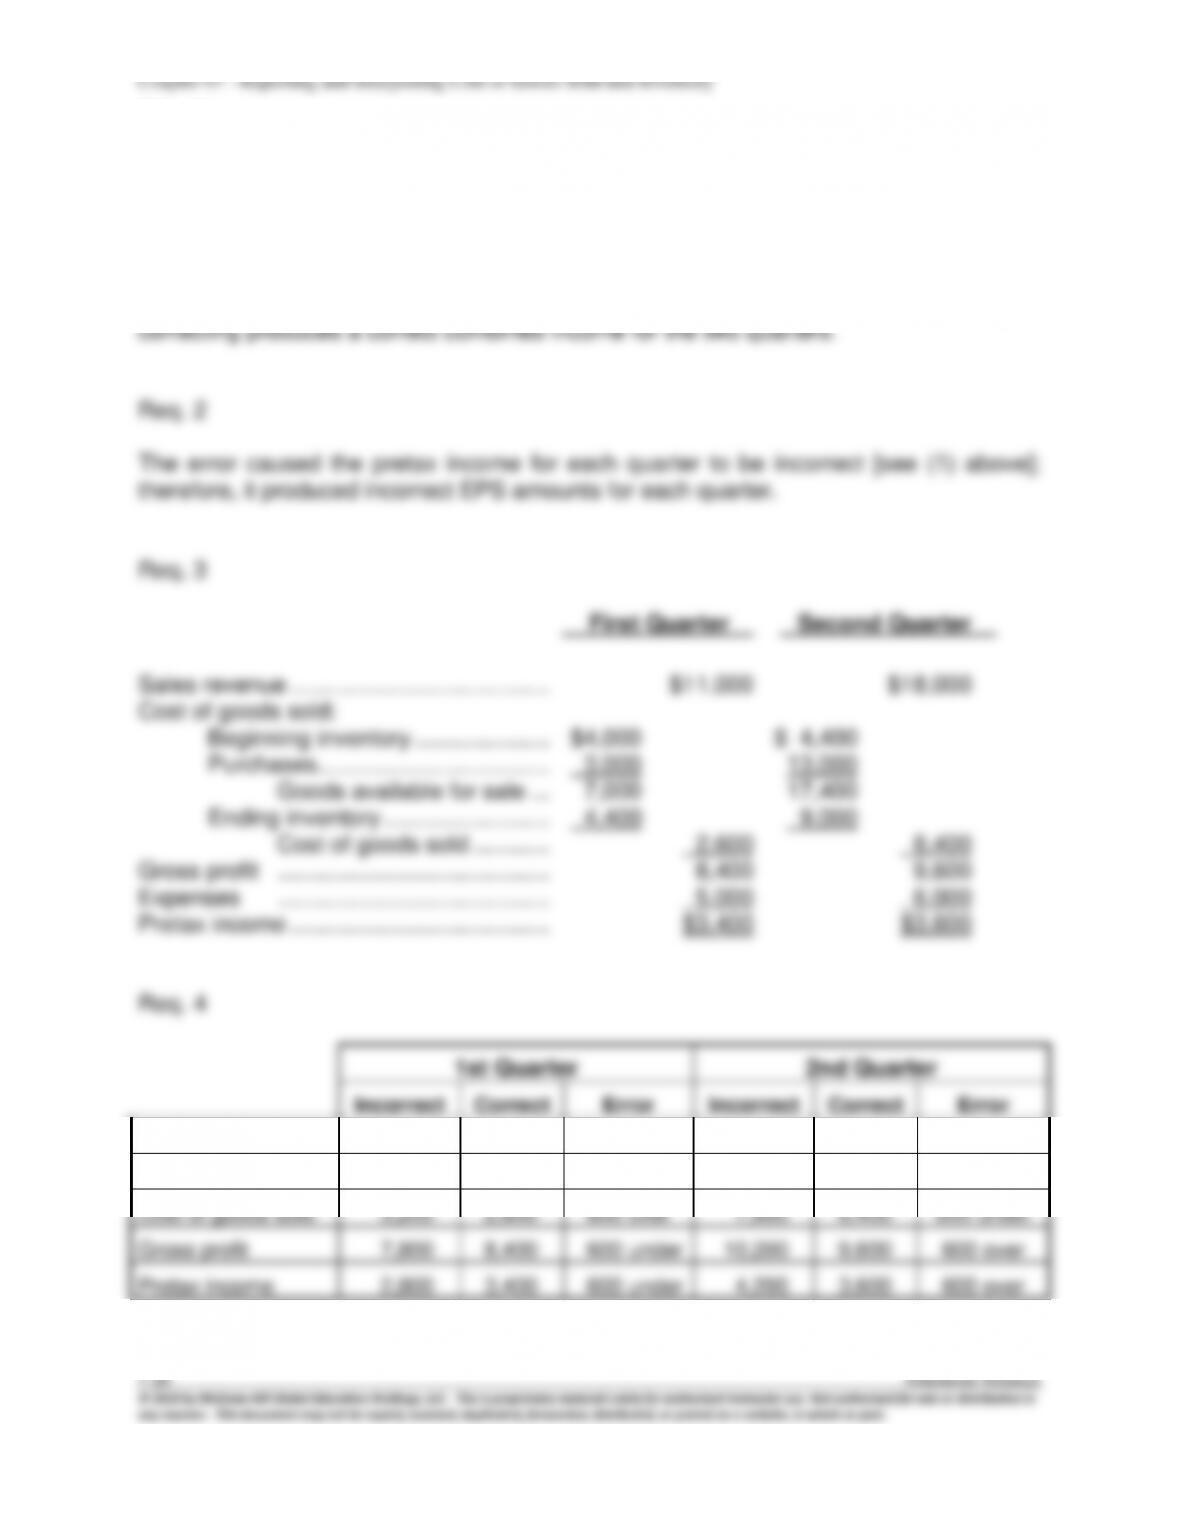
When the ending inventory is overstated, cost of goods sold is understated which in turn
results in an overstatement of net income. Gibson’s income from operations should be
reduced by $8,806,000 and tax expense should be reduced by $3,460,758 (i.e.,
$8,806,000 x 0.393). Therefore, net income should be:
Chapter 07 – Reporting and Interpreting Cost of Goods Sold and Inventory
E7–19.
Current Year Previous Year Change
Inventory $ 3,827 – $ 3,372 = $455
E7–20. (Supplement A)
Req. 1
This actual footnote from ConocoPhillips illustrates the impact of “dipping into a LIFO
layer.” Under LIFO, the cost of recently purchased items is assigned to cost of goods
sold. When prices are rising, cost of goods sold, under LIFO, will include unit costs that
7-28 Solutions Manual
© 2014 by McGraw-Hill Global Education Holdings, LLC. This is proprietary material solely for authorized instructor use. Not authorized for sale or distribution in
any manner. This document may not be copied, scanned, duplicated, forwarded, distributed, or posted on a website, in whole or part.
E7–21. (Supplement B)
Req. 1
a. First–In, First–Out (FIFO) Periodic Calculation:
Cost of Goods Sold
Units
Unit Cost
Total Cost
300
$7
$2,100
450
8
3,600
150
9
1,350
Total
$7,050
Cost of Goods Sold
Date
of Sale
Units
Unit Cost
Total Cost
Jan.
12
300
$7
$2,100
50
8
400
30
400
8
3,200
150
9
1,350
Total
$7,050
c. Last–In, First–Out (LIFO) Periodic Calculation:
Cost of Goods Sold
Units
Unit Cost
Total Cost
750
$9
$6,750
150
8
1,200
Total
$7,950
d. Last–In, First–Out (LIFO) Perpetual Calculation:
Cost of Goods Sold
Date
of Sale
Units
Unit Cost
Total Cost
Jan
12
350
$8
$2,800
30
550
9
4,950
Total
$7,750
Req. 2
You should recommend LIFO because the higher amount of cost of goods sold will
decrease income before taxes and taxes paid. You should recommend the periodic
calculation because it results in a higher amount for cost of goods sold which will

Chapter 07 – Reporting and Interpreting Cost of Goods Sold and Inventory
decrease income before taxes and taxes paid. In practice, it also substantially reduces
Chapter 07 – Reporting and Interpreting Cost of Goods Sold and Inventory
PROBLEMS
P7–1.
Item
Amount
Explanation
Ending inventory (physical count on
December 31, 2014)
$80,000
Per physical inventory.
a.
Goods out on trial to customer
+ 900
Goods held by a customer on trial
are still owned by the vendor; no
sale or transfer of ownership has
occurred.
b.
Goods in transit from supplier
Goods shipped by a supplier,
F.O.B. destination, are owned by
the supplier until delivery at
destination.
c.
Goods in transit to customer
Goods shipped to customers,
F.O.B. shipping point, are owned
by the customer because
ownership passed when they were
delivered to the transportation
company. The inventory correctly
excluded these items.
d.
Goods held for customer pickup
– 1,750
The goods sold, but held for
customer pickup, are owned by the
customer. Ownership has passed.
e.
Goods purchased and in transit
+ 3,550
Goods purchased and in transit,
F.O.B. shipping point, are owned
by the purchaser.
f.
Goods sold and in transit
+ 700
Goods sold and in transit, F.O.B.
destination, are owned by the seller
until they reach destination.
g.
Goods held on consignment
– 5,700
Goods held on consignment are
owned by the consignor (the
manufacturer), not by the
consignee.
Correct inventory, December 31, 2014
$77,700
Chapter 07 – Reporting and Interpreting Cost of Goods Sold and Inventory
P7–3.
Req. 1
DONNER COMPANY
Partial Income Statement
For the Month Ended January 31, 2014
(a) (b) (c) (d)
Average Specific
*620 units @ $16 = $9,920.
**Cost of goods sold:
Average Specific
Units Cost FIFO LIFO Identification
Beginning inventory 500 $2,365 $2,365 $2,365 $2,365
January 12 600 units @ $6 = $3,600
January 26 160 units @ $8 = 1,280
Totals 760 $4,880
****Ending inventory:
a. Average cost: Units Amount
Ending inventory:
Chapter 07 – Reporting and Interpreting Cost of Goods Sold and Inventory
P7–3. (continued)
Req. 2
FIFO reports a higher pretax income than LIFO because (1) prices are rising and (2)
FIFO allocates the old (lower) unit costs to cost of goods sold. For the same reason,
Chapter 07 – Reporting and Interpreting Cost of Goods Sold and Inventory
P7–5.
Req. 1
Prices Rising Prices Falling
A B C D
FIFO LIFO FIFO LIFO
Sales revenue (500 units) $15,000 $15,000 $15,000 $15,000
Cost of goods sold:
Cost of goods sold**
(500 units) 5,700 5,900 5,800 5,600
Gross profit 9,300 9,100 9,200 9,400
Expenses 4,000 4,000 4,000 4,000
Pretax income 5,300 5,100 5,200 5,400
(c) FIFO: 200 units @ $11.00 = 2,200
(d) LIFO: 200 units @ $12.00 = 2,400
** Cost of goods sold (direct computations):
(a) FIFO: [(300 units @ $11) + (200 units @ $12)] = $5,700
(b) LIFO: [(100 units @ $11) + (400 units @ $12)] = $5,900
goods sold but in the opposite direction. The difference in net income (i.e., after tax) is
Chapter 07 – Reporting and Interpreting Cost of Goods Sold and Inventory
P7–6.
Req. 1
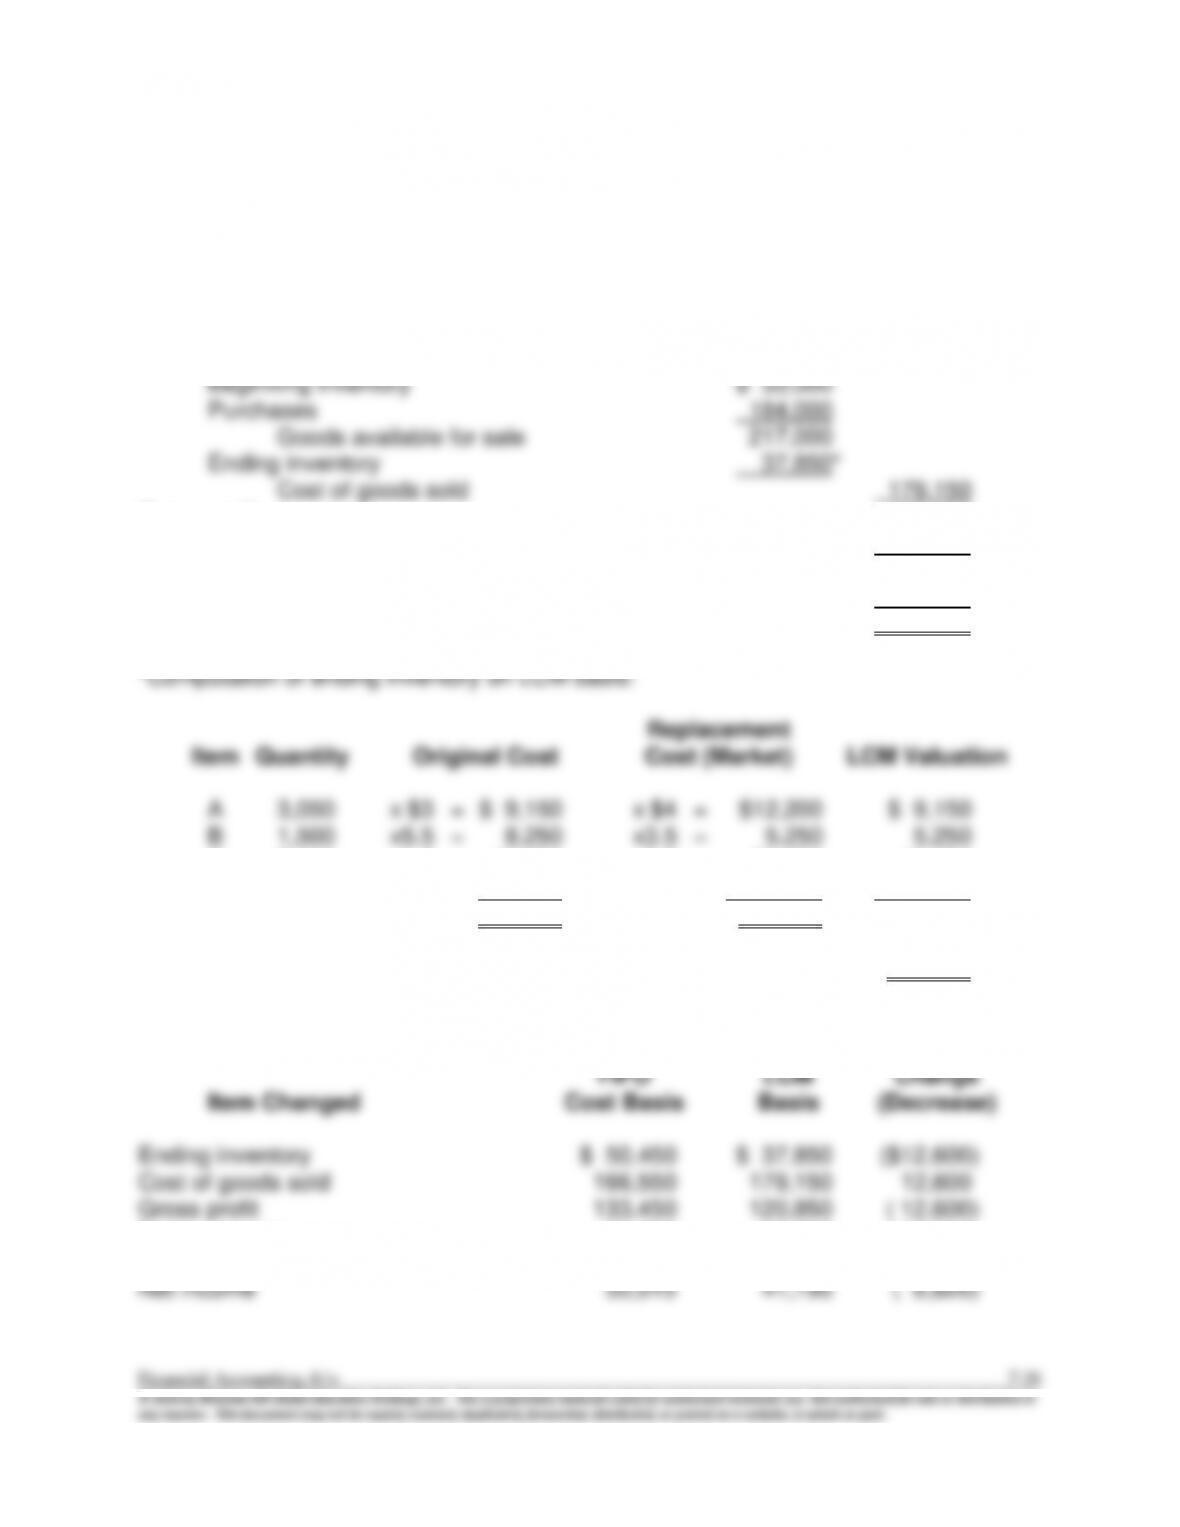
JAFFA COMPANY
Income Statement (LCM basis)
For the Year Ended December 31, 2014
Sales revenue $300,000
Cost of goods sold:
Gross profit 120,850
Operating expenses 62,000
Pretax income 58,850
Income tax expense ($58,850 x 30%) 17,655
Net income $ 41,195
C 7,100 x1.5 = 10,650 x3.5 = 24,850 10,650
D 3,200 x 7 = 22,400 x 4 = 12,800 12,800
Total $50,450 $55,100
LCM inventory valuation $37,850
Req. 2
Amount of
Pretax income 71,450 58,850 ( 12,600)
Income tax expense 21,435 17,655 ( 3,780)