Student Name:
Class:
(a) (b) (c) (d)
Average Specific
Cost FIFO LIFO Identification
9,920$ 9,920$ 9,920$ 9,920.00$
3,565 3,085 4,040 3,250.10
6,355$ 6,835$ 5,880$ 6,669.90$
Correct! Correct! Correct! Correct!
Note: See computations below
620
16$
9,920$
Correct!
Average Specific
Units Cast FIFO LIFO Identification
500 2,365$ 2,365$ 2,365$ 2,365.00$
760 4,880 4,880 4,880 4,880.00
1,260 7,245 7,245 7,245 7,245.00
640 3,680 4,160 3,205 3,994.90
620 3,565$ 3,085$ 4,040$ 3,250.10$
Correct! Correct! Correct! Correct! Correct!
*Sales revenue:
**Cost of goods sold:
Beginning inventory
Purchases (net)***
Goods available for sale
Ending inventory****
Cost of goods sold*****
Cost
Revenue
McGraw-Hill/Irwin
Instructor
For the Month Ended January 31, 2014
Partial Income Statement
DONNER COMPANY
Requirement 1:
Problem 07-03
Computations
DONNER COMPANY
Sales revenue*
Cost of goods sold**
Gross profit
Units
Student Name:
Class:
McGraw-Hill/Irwin
Instructor
Requirement 1:
Problem 07-03
Dollar
Units Cost Amount
600 $6 3,600$
160 $8 1,280
760 4,880$
Correct! Correct!
Units Amount
500 2,365$
760 4,880
1,260 7,245$
Correct! Correct!
5.75$ «- Good Job!
3,680$ «- Good Job!
Units Cost Total
160 $8 1,280$
480 $6 2,880
640 4,160$
Units Cost Total
500 $4.73 2,365$
140 $6 840
640 3,205$
Correct! Correct!
Units Cost Total
130 $4.73 614.90
350 $6 2,100.00
160 $8 1,280.00
640 3,994.90
Ending inventory
***Purchases:
****Ending inventory:
Ending inventory
(d) Specific identification:
(c) LIFO:
Ending inventory
Ending inventory
(b) FIFO:
Purchases
Totals
Average cost
Totals
(a) Average cost:
Beginning inventory
January 12
January 26

Student Name:
Class:
McGraw-Hill/Irwin
Instructor
Requirement 1:
Problem 07-03
Requirement 3:
Requirement 4:
Requirement 2:
FIFO reports a higher pretax income than LIFO because (1) prices are rising and (2) FIFO allocates the old
(lower) unit costs to cost of goods sold. For the same reason, FIFO will report a higher EPS amount because it
produces a higher pretax income than LIFO.
Because LIFO reports a lower pretax income than FIFO for the reasons given in Requirement (2), the former
will derive less income tax by ($6,835 – $5,880) X 30% = $286.50.
LIFO will provide a more favorable cash flow than FIFO of $286.50 because less cash will be paid for income
tax in the current year than would be paid under FIFO (for the reasons given in Requirements 2 and 3).

Units Amount
500 2,365$
600 3,600
160 1,280
(370)
(250)
16.00$
Purchase, January 12
Inventory, January 1, 2014
Transactions
DONNER COMPANY
Given Data P07-03:
Selling price per unit of each item
Sale
Sale
Purchase, January 26
Student Name:
Class:
Prices Rising Prices Falling
FIFO LIFO FIFO LIFO
15,000$ 15,000$ 15,000$ 15,000$
3,300 3,300 3,600 3,600
4,800 4,800 4,400 4,400
8,100 8,100 8,000 8,000
2,400 2,200 2,200 2,400
5,700 5,900 5,800 5,600
9,300 9,100 9,200 9,400
4,000 4,000 4,000 4,000
5,300 5,100 5,200 5,400
1,590 1,530 1,560 1,620
3,710$ 3,570$ 3,640$ 3,780$
Correct! Correct! Correct! Correct!
Units Cost Total
200 $12 2,400$ Correct!
200 $11 2,200 Correct!
200 $11 2,200 Correct!
200 $12 2,400 Correct!
(c) FIFO
(b) LIFO
(a) FIFO
Instructor
Requirement 1:
McGraw-Hill/Irwin
Problem 07-05
Cost of goods sold:
Beginning inventory (300 units)
Purchases (400 units)
Goods available for sale
Sales revenue (500 units)
Comparison Income Statements
INVENTORY
Ending inventory (200 units)*
Cost of goods sold (500 units)
Gross profit
Expenses
Pretax income
Income tax expense (30%)
Net income
*Inventory computations:
(d) LIFO

Student Name:
Class:
Instructor
McGraw-Hill/Irwin
Problem 07-05
Requirement 2:
Requirement 3:
Requirement 4:
The above tabulation demonstrates that when prices are rising, FIFO gives a higher net income than LIFO.
When prices are falling, the opposite effect results. The difference in pretax income (as between FIFO and
LIFO) is the same as the difference in cost of goods sold but in the opposite direction. The difference in net
income (i.e., after tax) is equal to the difference in cost of goods sold multiplied by one minus the income tax
rate.
When prices are rising, LIFO derives a more favorable cash position (than FIFO) equal to the difference in
income tax. In contrast, when prices are falling, FIFO derives a more favorable cash position equal to the
difference in income tax.
Either method can be defended reasonably. If one focuses on current income and EPS, FIFO derives a more
favorable result (higher than LIFO when prices are rising). Alternatively, if one focuses on income tax expense
and cash position, when prices are rising, LIFO derives more favorable results (lower taxes, better cash
position). However, these comparative results will reverse if prices fall. FIFO provides a better balance sheet
valuation (higher current asset value) but on the income statement does not match current expense (cost of
goods sold) with current revenues. Alternatively, LIFO better matches expenses with revenues but produces a
less relevant inventory valuation on the balance sheet.
Prices Rising Prices Falling
Situation A Situation B Situation C Situation D
FIFO LIFO FIFO LIFO
$15,000 $15,000 $15,000 $15,000
3,300 ? ? ?
4,800 ? ? ?
8,100 ? ? ?
2,400 ? ? ?
5,700 ? ? ?
9,300 ? ? ?
4,000 4,000 4,000 4,000
5,300 ? ? ?
1,590 ? ? ?
$3,710 ? ? ?
500
15,000$
300
400
200
4,000$
Per Number
Unit of Units Total
11$ 300 3,300$
12$ 400 4,800$
Per Number
Unit of Units Total
12$ 300 3,600$
Purchases
Beginning inventory
Beginning inventory
Data for Situations A and B (Prices Rising)
Data common to all 4 situations:
Operating expenses
Sales in units
Dollar amount of sales
Beginning inventory in units
Purchases in units
Ending inventory in units
Expenses
Pretax income
Income tax expense (30%)
Net income
Purchases
Data for Situations C and D (Prices Falling)
Gross profit
Given Data P07-05:
Sales revenue
Cost of goods sold:
Beginning inventory
Purchases
Goods available for sale
Ending inventory
Cost of goods sold
Student Name:
Class:
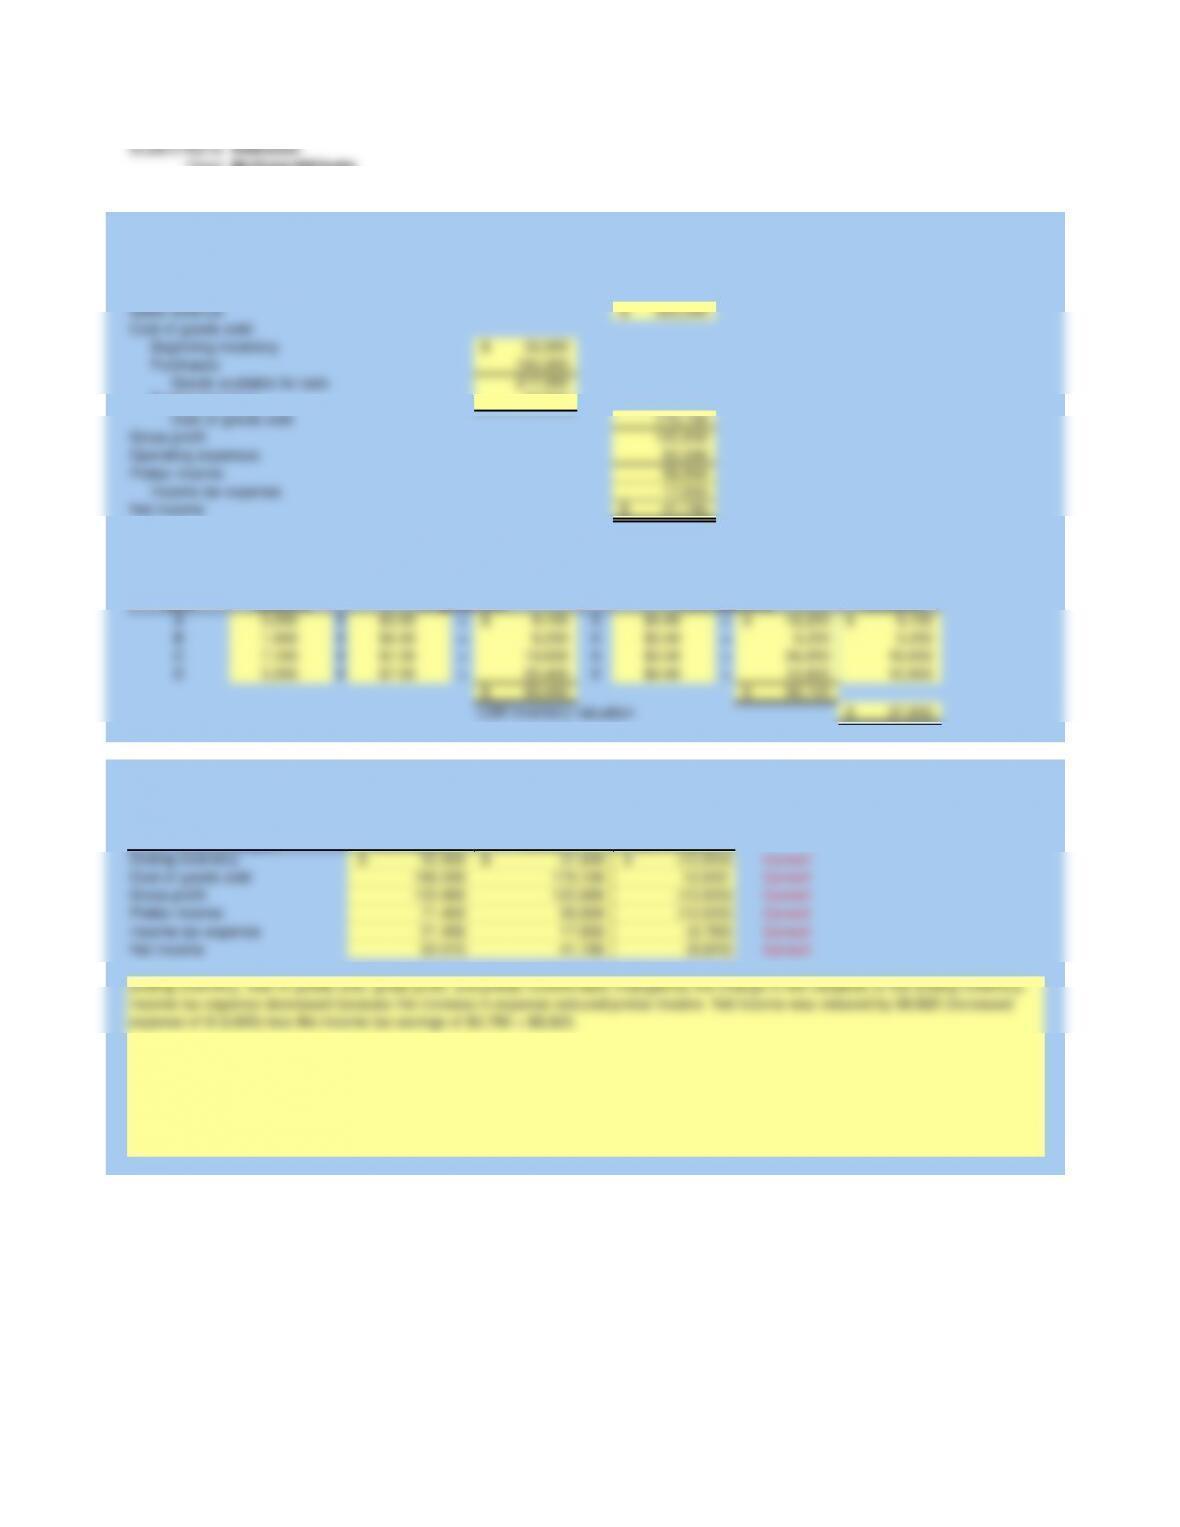
300,000$
33,000$
184,000
217,000
37,850
179,150
120,850
62,000
58,850
17,655
41,195$
Correct!
LCM
Item Quantity Valuation
A 3,050 X $3.00 = 9,150$ X $4.00 = 12,200$ 9,150$
B 1,500 X $5.50 = 8,250 X $3.50 = 5,250 5,250
C 7,100 X $1.50 = 10,650 X $3.50 = 24,850 10,650
Gross profit
Cost of goods sold
Ending inventory
Requirement 2:
Net income
Income tax expense
Pretax income
Operating expenses
Original cost
Pretax income
Income tax expense
Net income
Problem 07-06
McGraw-Hill/Irwin
Instructor
Cost of goods sold
Gross profit
Requirement 1:
Sales revenue
Cost of goods sold:
Beginning inventory
Income Statement (LCM basis)
JAFFA COMPANY
For the Year Ended December 31, 2014
Ending inventory
Purchases
Goods available for sale
Computation of ending inventory on LCM basis:
Cost (Market)
Replacement

LCM reduced pretax income and income tax expense. There was a cash savings of $3,780 for 2014 (assuming the LCM results are
included on the income tax return). In subsequent periods pretax income will be greater by the $12,600 and hence, income tax and cash
outflow will be more. The only real gain to the company would be the time value of money between 2014 and the subsequent periods when
increased income taxes must be paid (of course, a change in tax rates would affect this analysis).
Requirement 4:
Requirement 3:
The inventory costing methods (average cost, FIFO, LIFO, and specific identification) apply the cost and matching principles. Cost of goods
sold, under these principles, is the actual cost incurred for the merchandise sold during the period; this cost is matched with sales revenue of
the period. LCM is an exception to the cost principle. Conceptually, LCM is based on the view that when replacement is less than the
cost incurred for the merchandise, any such goods on hand should be valued at the lower replacement (market) price. The effect is to
include the holding loss (i.e., the drop from cost to market) in the cost of goods sold amount for the period in which the replacement cost
dropped. LCM recognizes holding losses in this manner; however, it does not recognize holding gains.
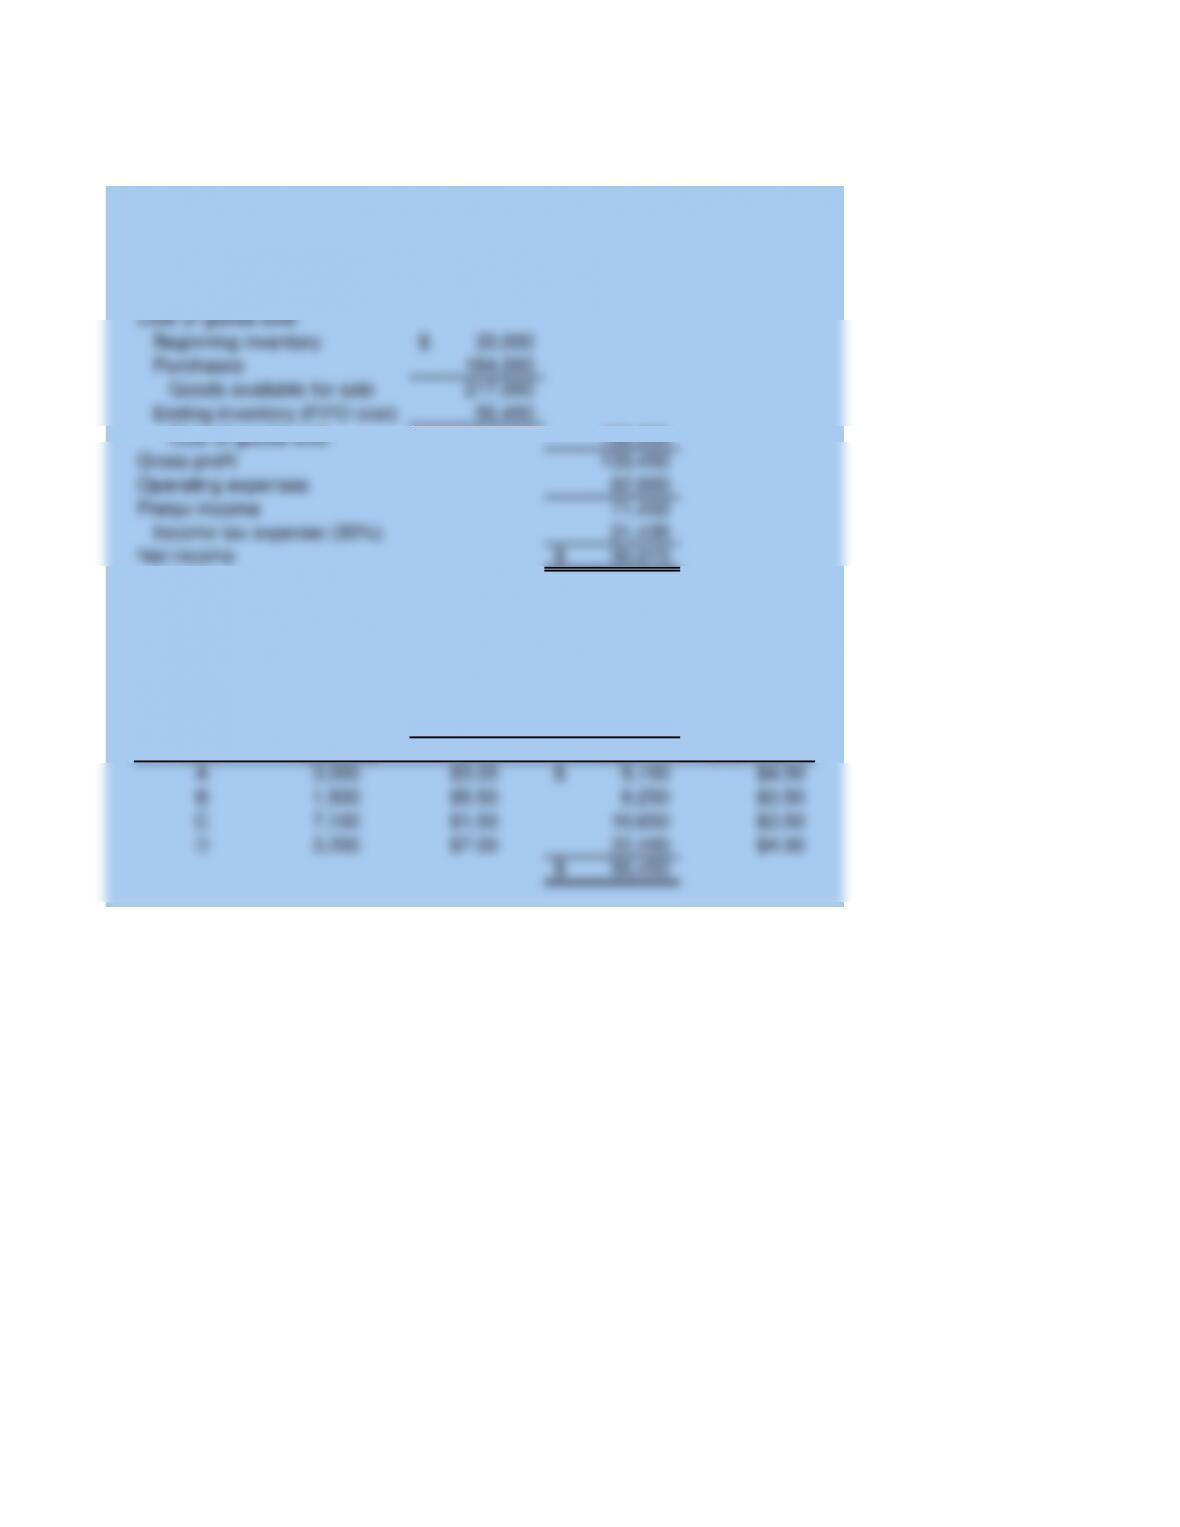
300,000$
33,000$
184,000
217,000
50,450
166,550
133,450
62,000
71,450
21,435
50,015$
Current
Replacement
Unit Cost
Item Quantity Unit Total (Market)
A3,050 $3.00 9,150$ $4.00
B1,500 $5.50 8,250 $3.50
C7,100 $1.50 10,650 $3.50
D3,200 $7.00 22,400 $4.00
50,450$
Cost of goods sold
Gross profit
Operating expenses
Pretax income
Income tax expense (30%)
Given Data P07-06:
Acquisition
2014 Ending Inventory
Cost
JAFFA COMPANY
Income Statement
December 31, 2014
JAFFA COMPANY
Net income
Sales Revenue
Cost of goods sold
Beginning inventory
Purchases
Goods available for sale
Ending inventory (FIFO cost)
Student Name:
Class:
2014 2015 2016 2017
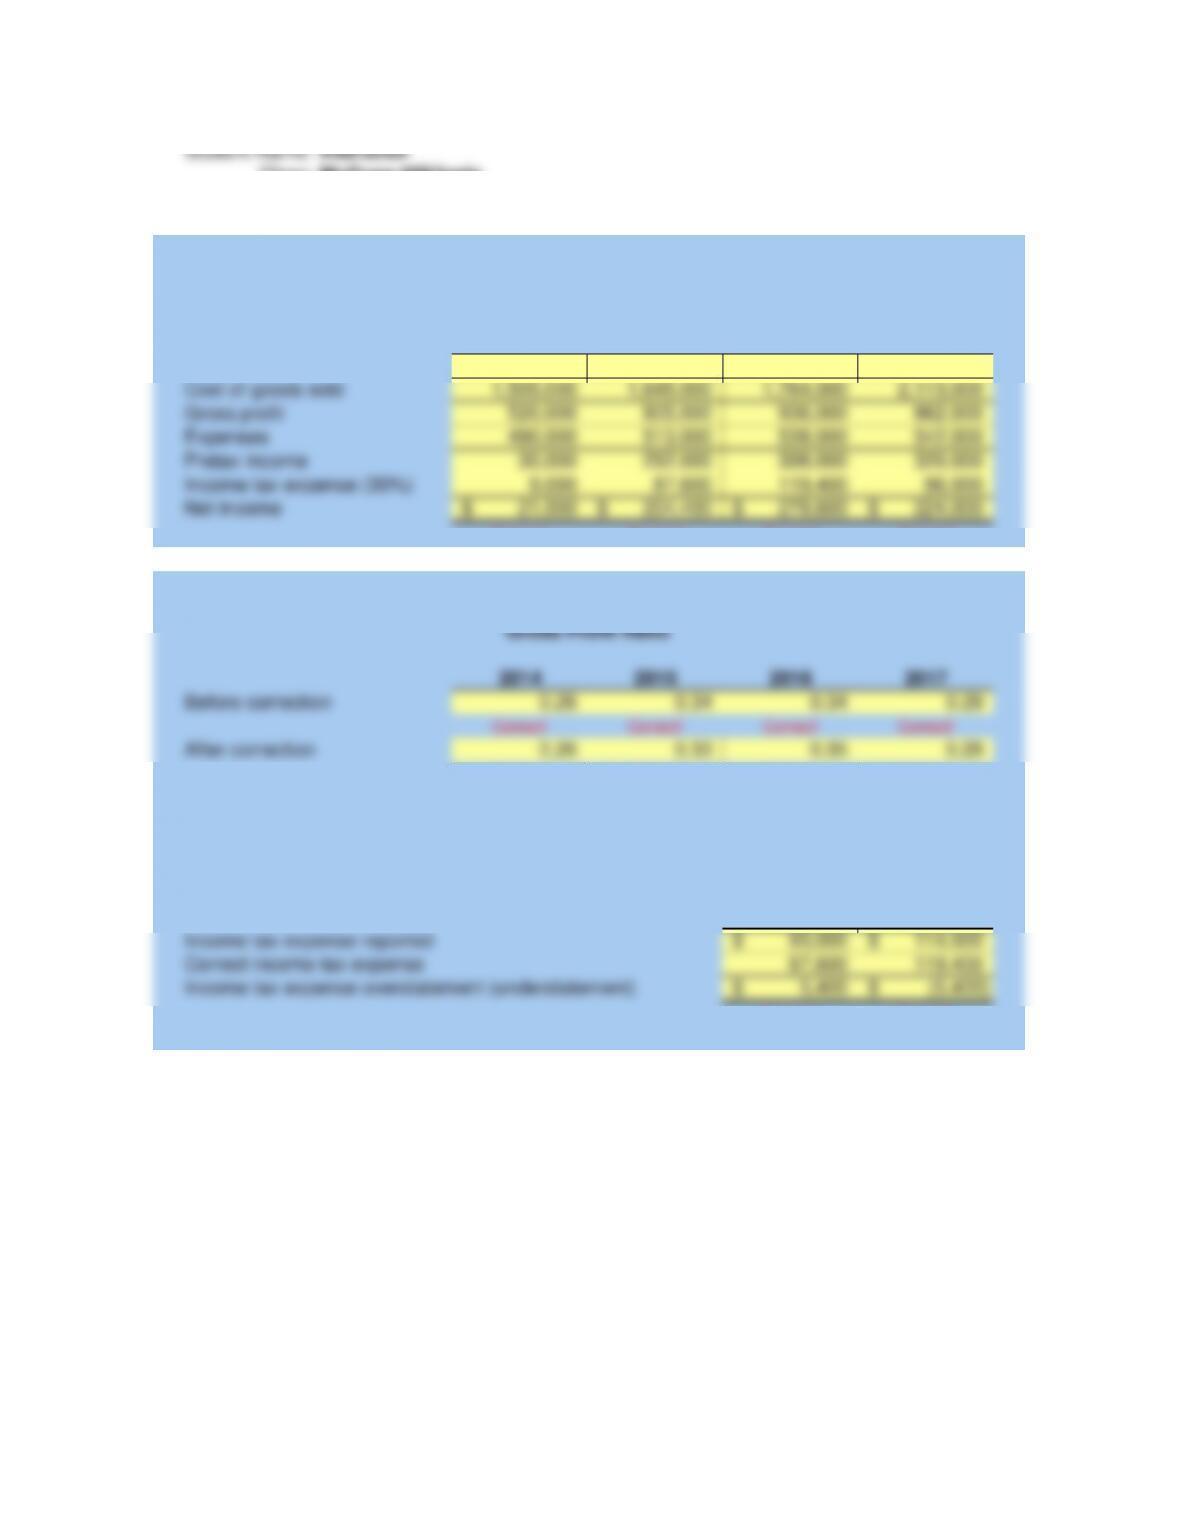
2,025,000$ 2,450,000$ 2,700,000$ 2,975,000$
1,505,000 1,645,000 1,764,000 2,113,000
520,000 805,000 936,000 862,000
490,000 513,000 538,000 542,000
30,000 292,000 398,000 320,000
9,000 87,600 119,400 96,000
21,000$ 204,400$ 278,600$ 224,000$
Correct! Correct! Correct! Correct!
2014 2015 2016 2017
0.26 0.34 0.34 0.29
Correct! Correct! Correct! Correct!
0.26 0.33 0.35 0.29
Correct! Correct! Correct! Correct!
Requirement 3:
Income tax expense overstatement (understatement)
Correct income tax expense
Income tax expense reported
After correction
Net income
Problem 07-09
McGraw-Hill/Irwin
Instructor
Requirement 2:
Requirement 1:
Sales revenue
Income Statement Corrected
PRUITT COMPANY
Cost of goods sold
Gross profit
Expenses
Pretax income
Income tax expense (30%)
PRUITT COMPANY
PRUITT COMPANY
Before correction
2014 2015 2016 2017
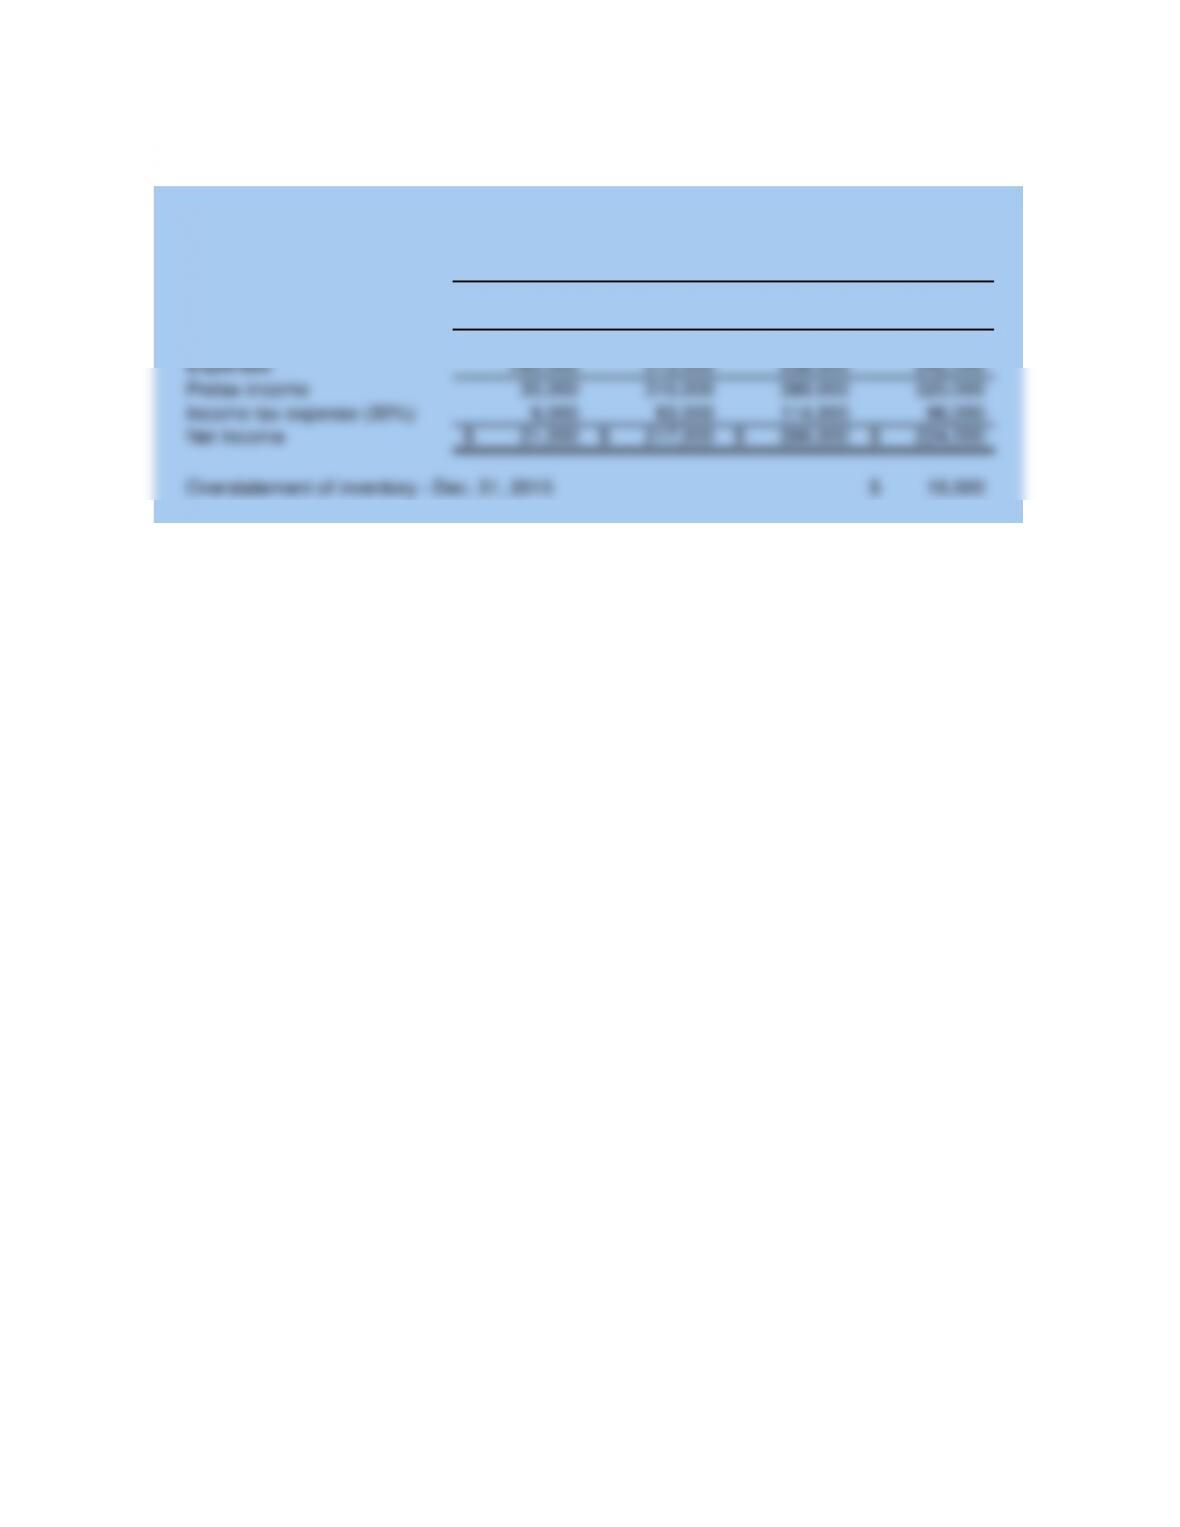
2,025,000$ 2,450,000$ 2,700,000$ 2,975,000$
1,505,000 1,627,000 1,782,000 2,113,000
520,000 823,000 918,000 862,000
490,000 513,000 538,000 542,000
30,000 310,000 380,000 320,000
9,000 93,000 114,000 96,000
21,000$ 217,000$ 266,000$ 224,000$
18,000$
Sales revenue
Overstatement of inventory – Dec. 31, 2015
Net Income
Given Data P07-09:
Cost of goods sold
Gross profit
Expenses
Pretax income
Income tax expense (30%)
Income Statement – Uncorrected
PRUITT COMPANY