Financial Accounting, 8/e 13–19
P13–7.
Req. 1
.
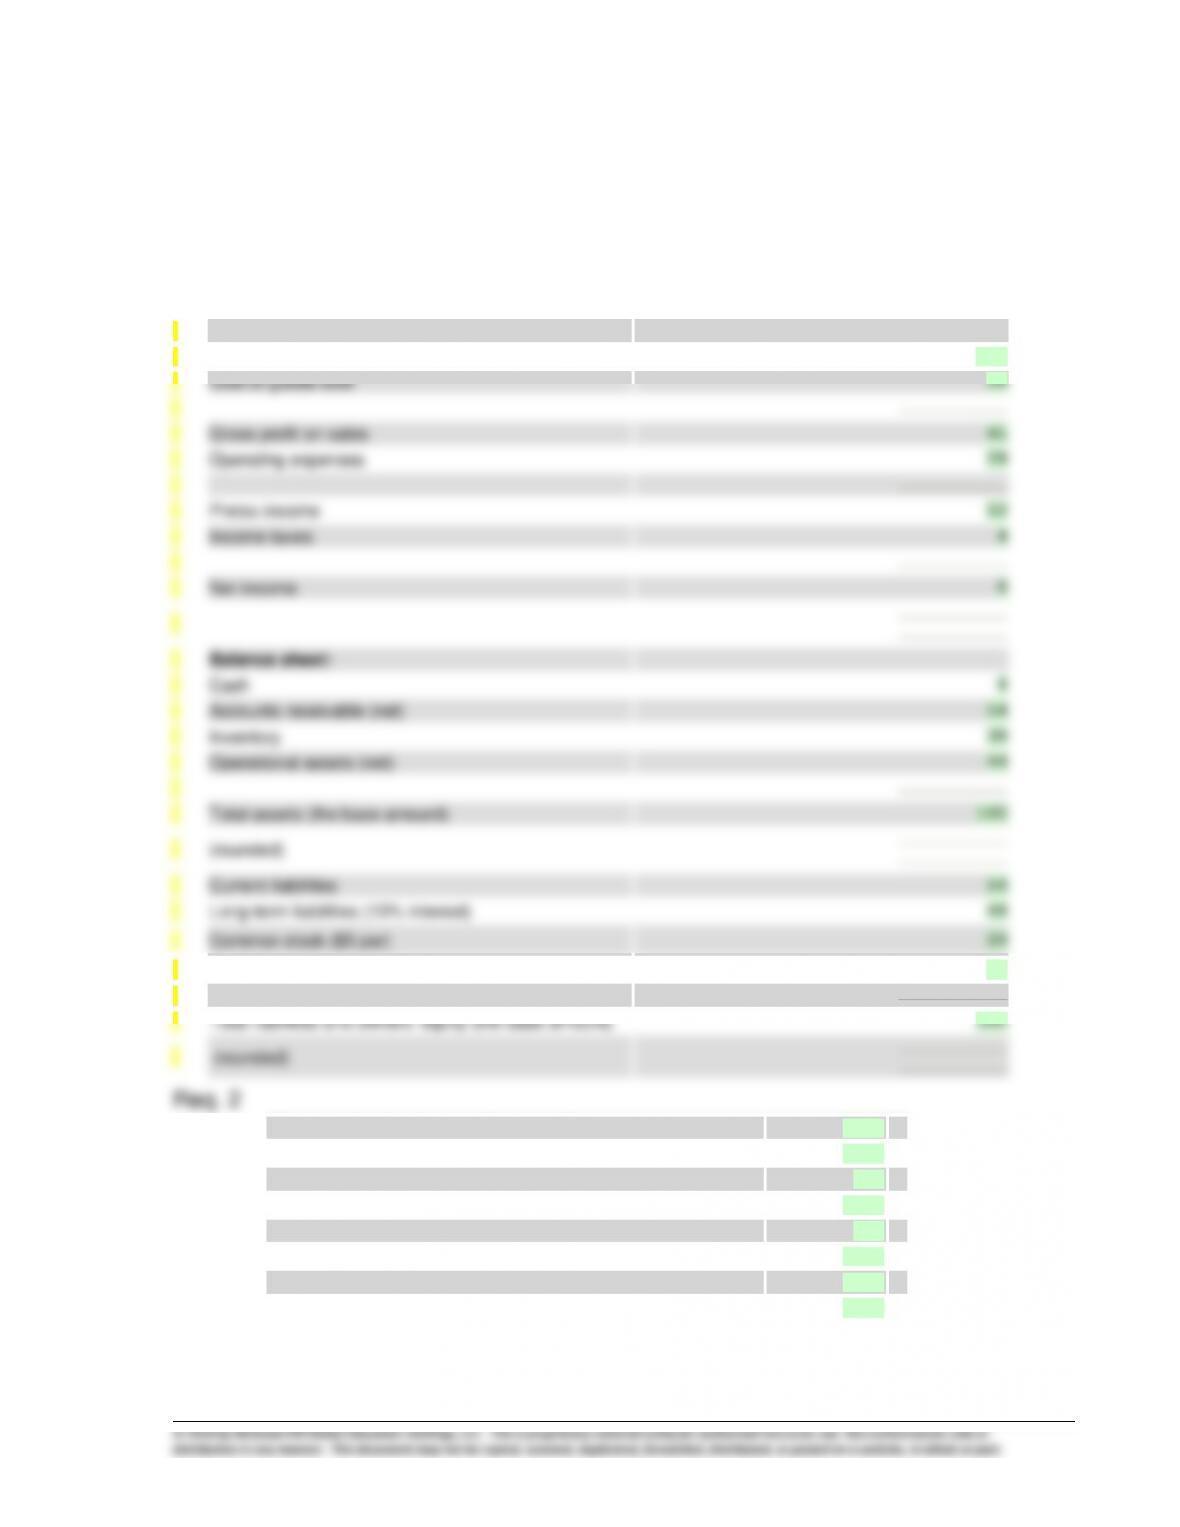
Component Percentages 2015
Income statement:
Sales revenue (the base amount)
100
Cost of goods sold
59
Gross profit on sales
Operating expenses
Pretax income
Income taxes
Net income
Balance sheet:
Cash
Accounts receivable (net)
Inventory
Operational assets (net)
Total assets (the base amount)
Current liabilities
16
44
Retained earnings
12
Total liabilities and owners’ equity (the base amount)
100
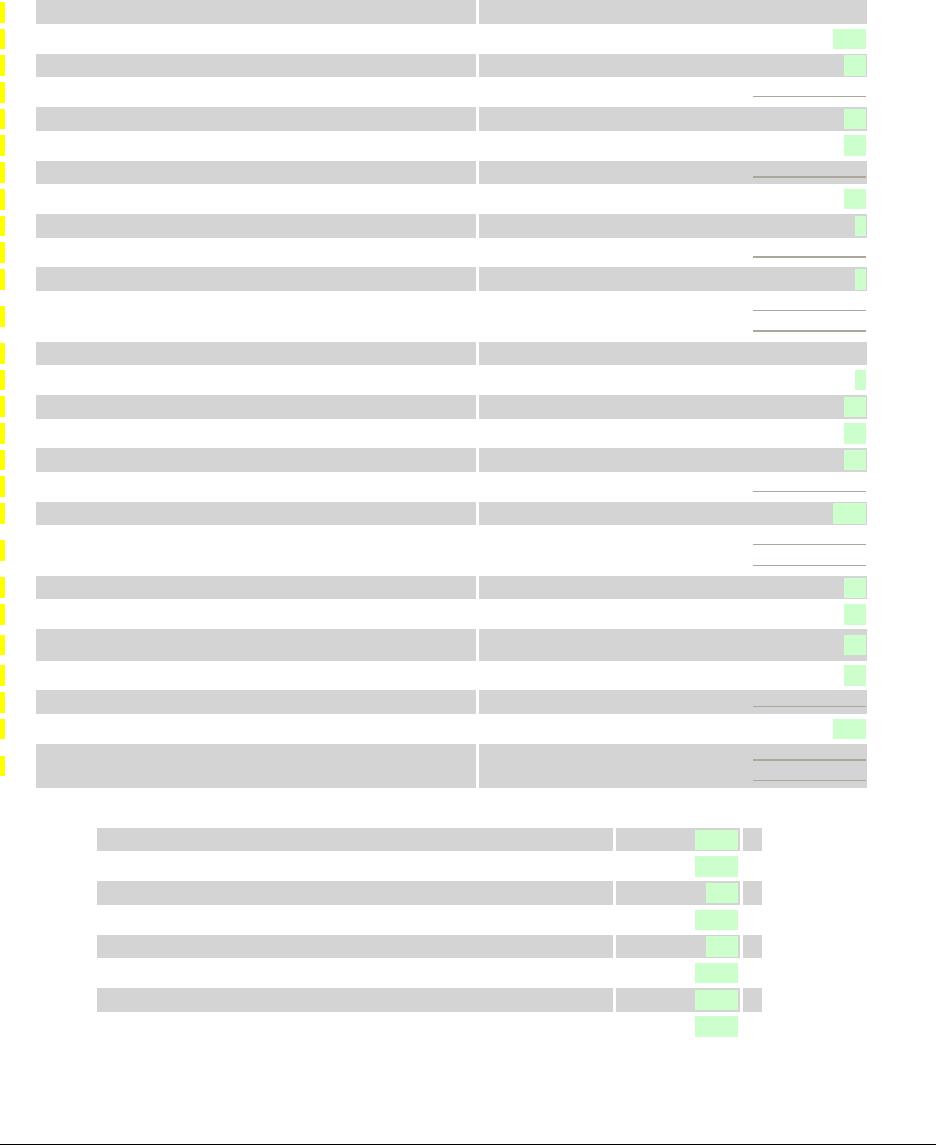
a.
The average percentage markup on sales
41.0
%
b.
The average income tax rate
36.4
%
c.
The profit margin (net)
7.4
%
d.
The investment in operational assets
43.7
%
e.
The debt-to-equity
1.5
f.
The return on equity
36.4
%
g.
The return on assets
16.9
%
h.
The financial leverage percentage
19.5
%

P13–8.
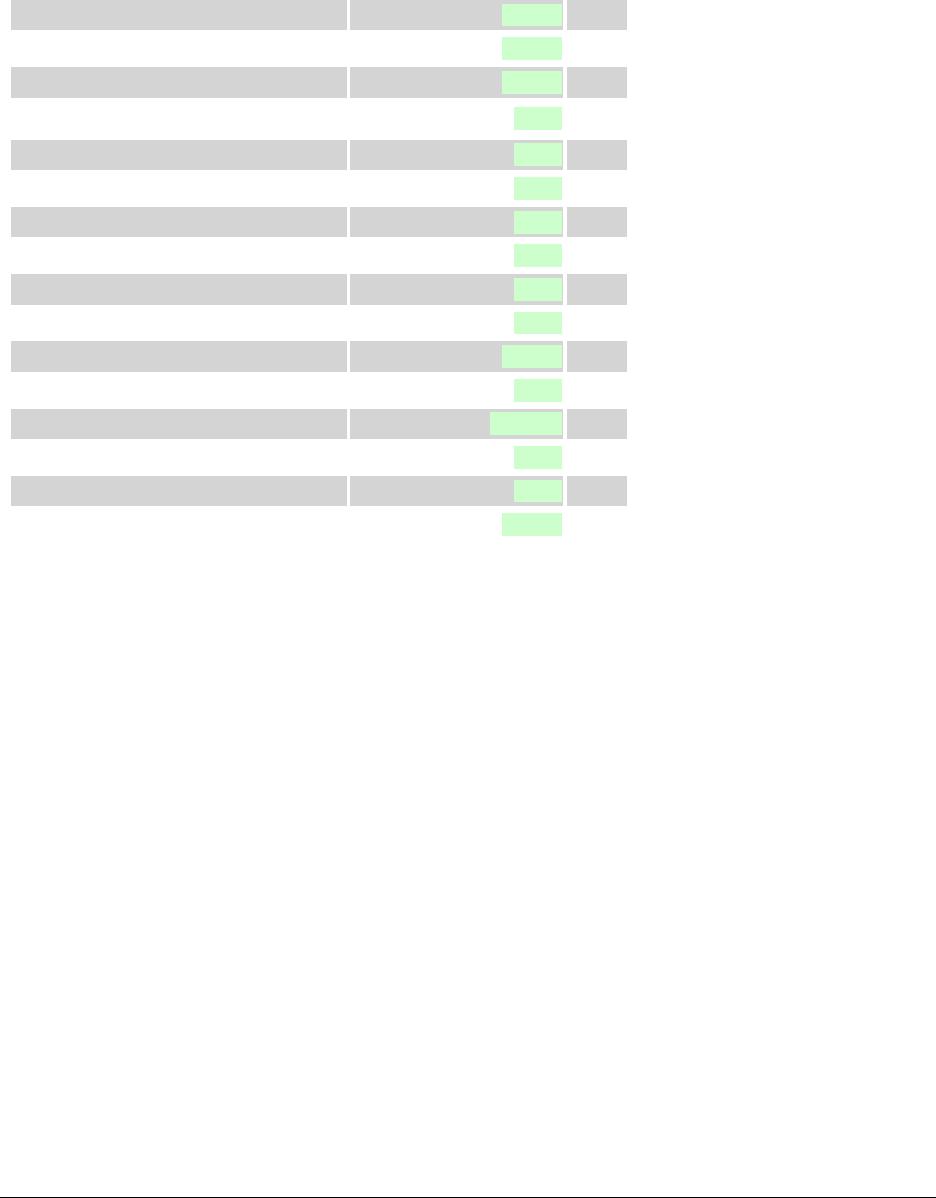
Ratio
Return on Equity
36.37
%
Return on Assets
16.86
%
Financial Leverage Percentage
19.51
%
Earnings Per Share
2.33
Fixed Asset Turnover
4.58
Profit Margin
7.37
%
Cash Ratio
0.25
Current Ratio
3.63
Quick Ratio
1.13
Receivable Turnover
3.96
times
Average Collection Period
92.17
days
Inventory Turnover
3.03
times
Average Days’ Supply
120.46
days
Times Interest Earned
5.89
Debt/Equity Ratio
1.45
Price/Earnings Ratio
12.02

Financial Accounting, 8/e 13–21
P13–9.
Analysis
The case states that both companies are exactly alike except for the impact of
the alternative methods to cost inventory. Use of LIFO (compared to FIFO),
1. Current ratio—Company A will have a higher ratio because the inventory
amount is higher under FIFO. The cash balance for Company A is less than
4. Return on equity—The analyst cannot be certain which company will report
a higher ratio. The numerator of the ratio reflects differences for the current
5. EPS—Company A will have a higher ratio because of reporting higher net
income.

P13–10.
Current ratio:
$49,625
=
0.53
$93,151
0.35

ALTERNATE PROBLEMS
AP13–1.
1. Company A shows a high EPS but a low ROA. There are a number of
2. The low level of liquidity for Company A is a concern given its high
debt/equity ratio.
3. Despite a high EPS, Company A has a low price/earnings multiple. This
is often an indication of limited growth opportunities or concern in the
market.
4. The dividend yield for Company A is high. The company may be paying
significant dividends or its stock price may be currently depressed.
AP13–2.
1. Company A appears to be very profitable based on both ROA and profit
margin. The use of leverage has enhanced the ROA.
2. Company A’s solvency and liquidity are potential areas of concern.
3. The price/earnings multiple for Company A suggests a profitable
company with good growth prospects.
AP13–3.
Coca-Cola is the stronger company and probably is the better investment.
The biggest differences between the two companies are the P/E ratio, ROA,
AP13–4.
Req. 1
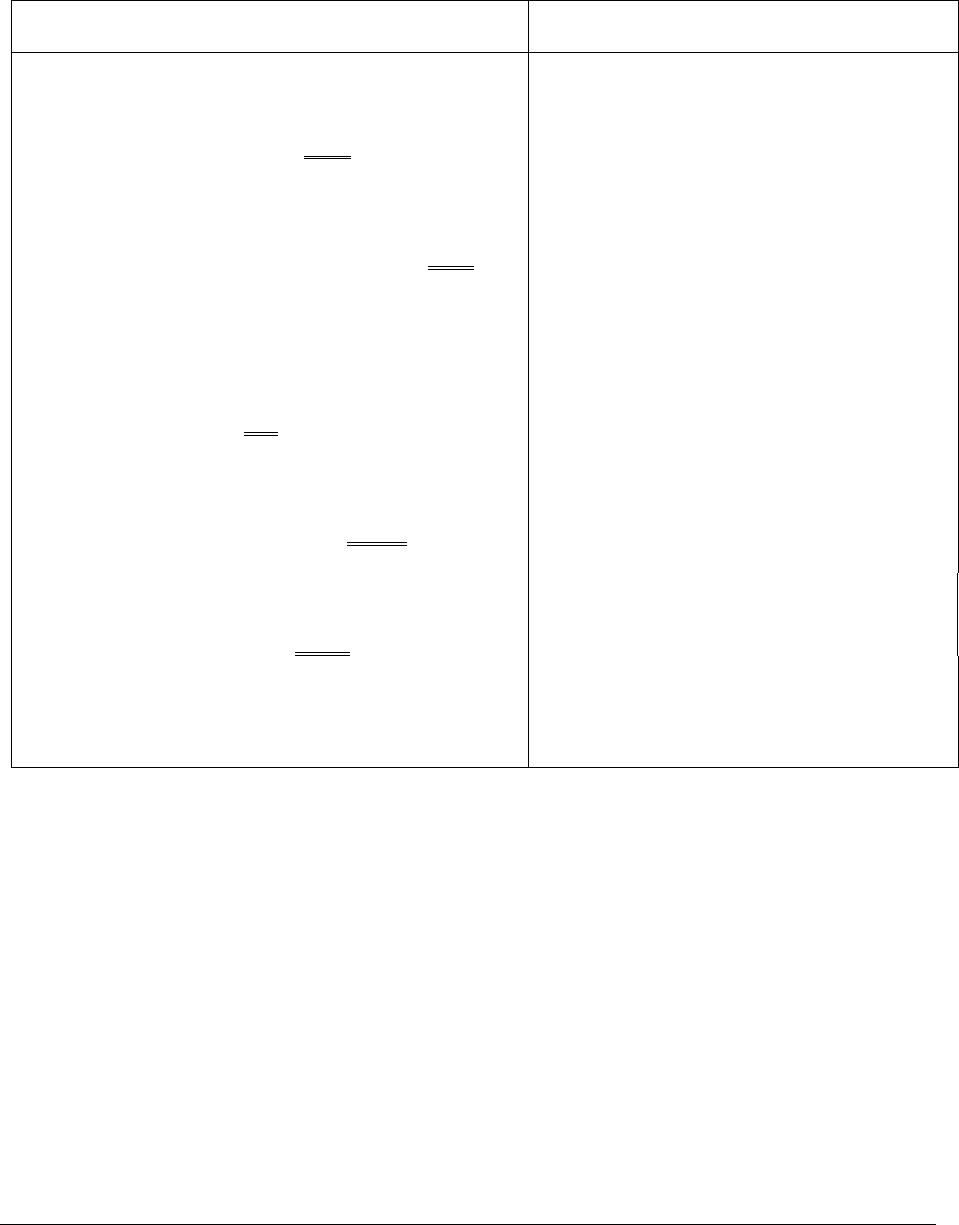
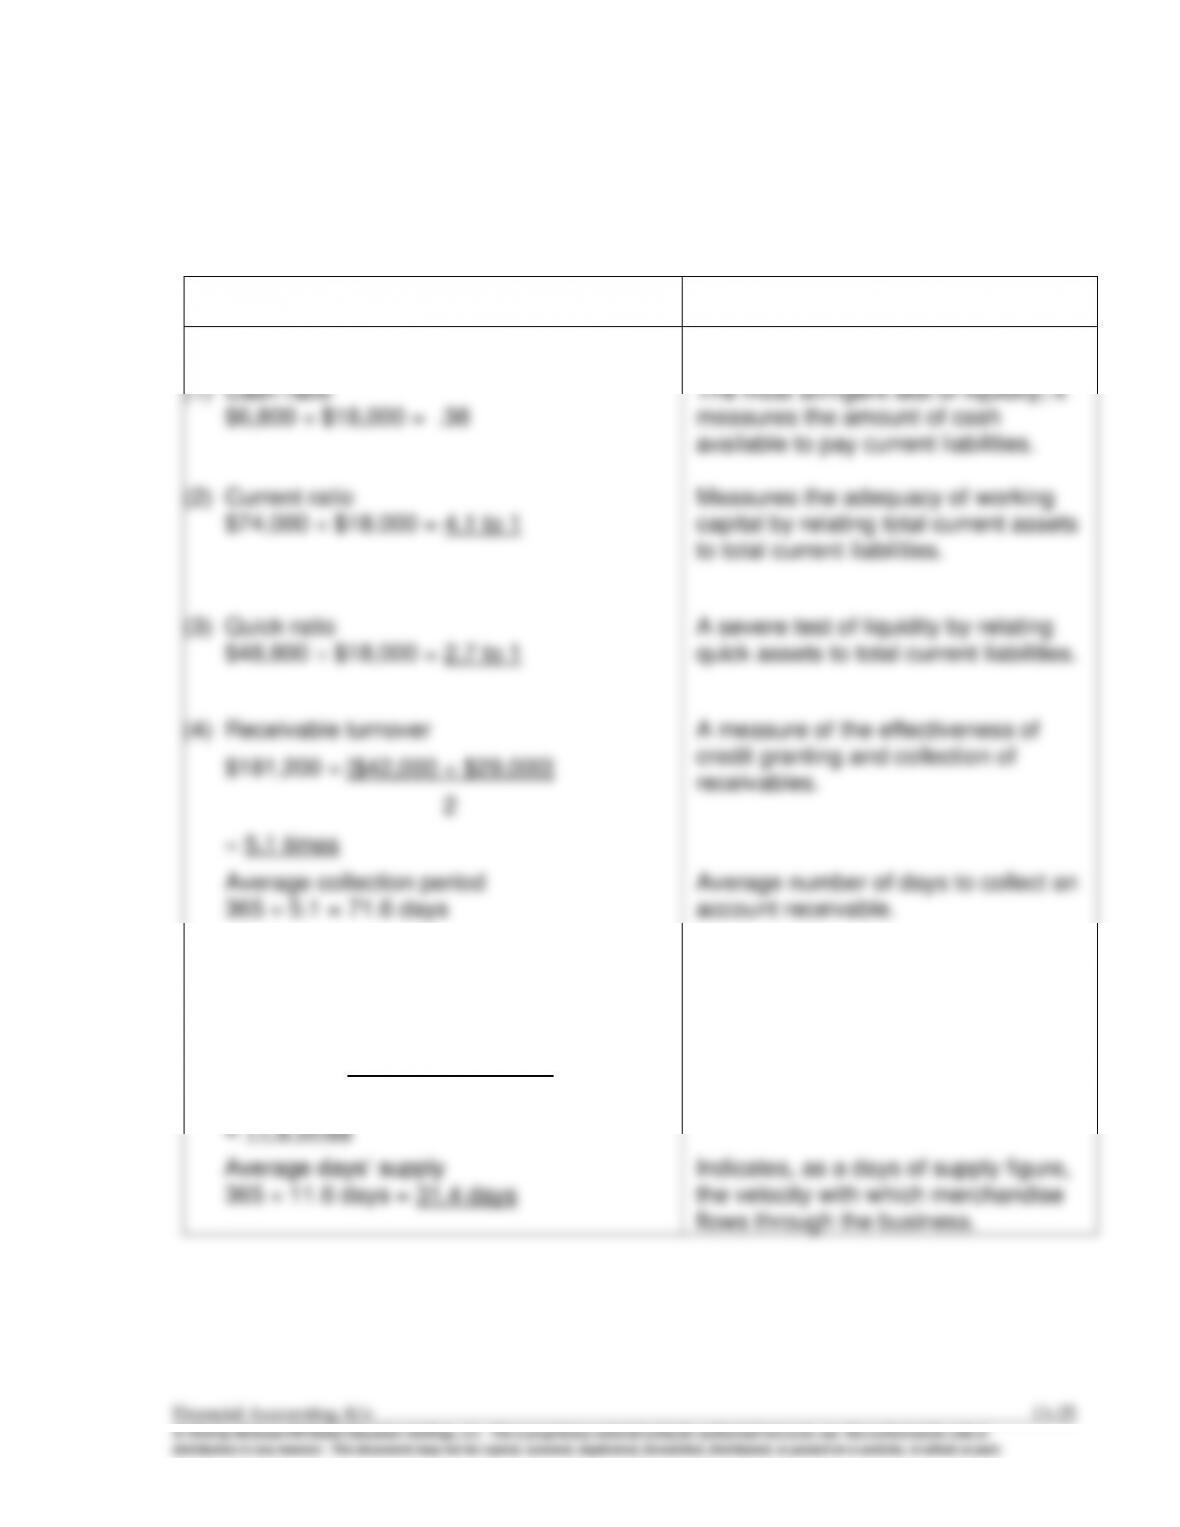
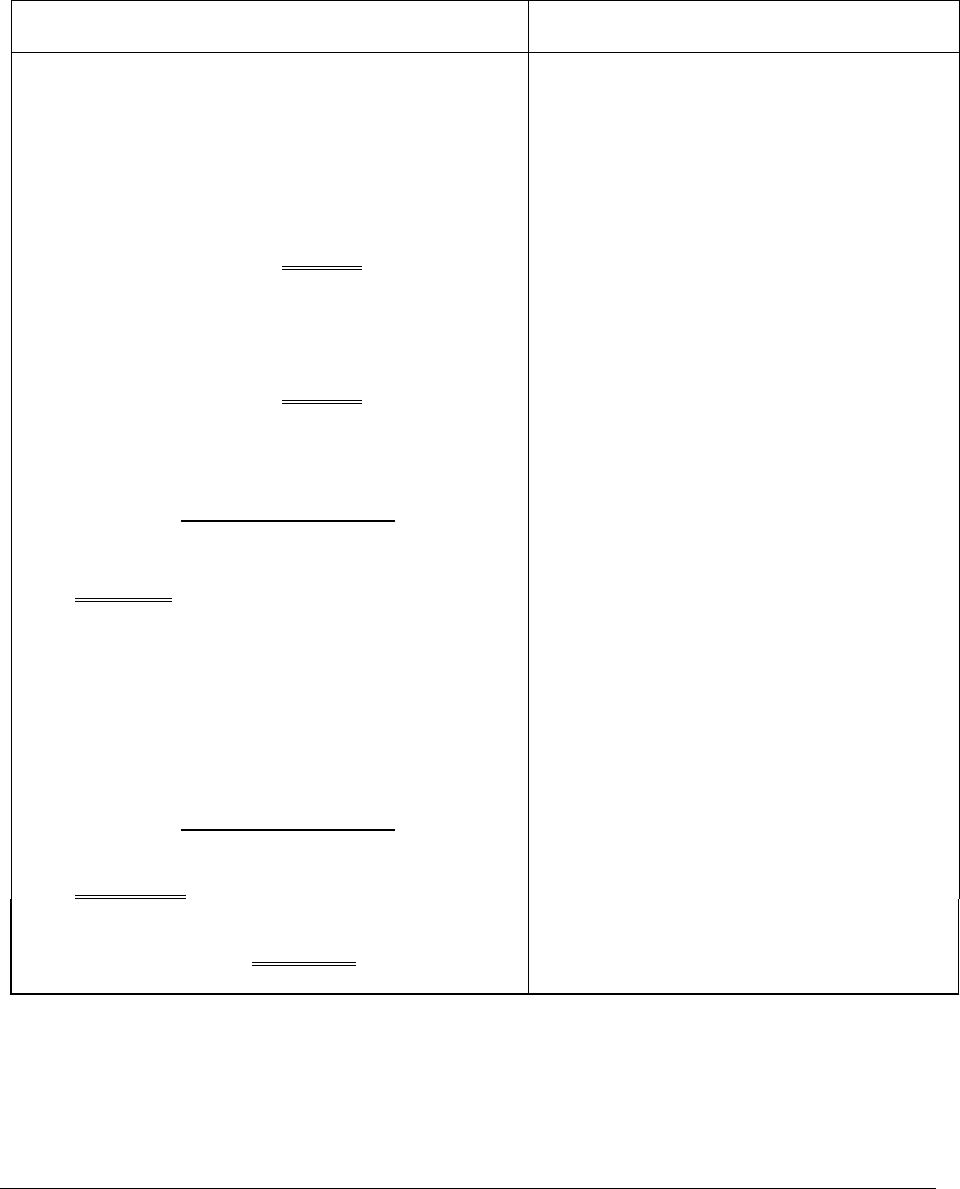
Name and Computation of the 2015 Ratio
Brief Explanation of the Ratio
Tests of profitability:
(1)
Return on equity:
*($116,000 + $102,000) ÷ 2 = $109,000
Measures return earned for owners
retained earnings) in the business.
(3)
Financial leverage percentage:
23.1% – 16.1% = 7.0% positive
The advantage to be gained by
investors when the interest rate (net of
tax) is less than the return on assets.
(4)
Earnings per share
A measure of the return earned on
outstanding.
$25,200 ÷ $453,000 = 5.6%
that was represented by income.
(6)
Fixed asset turnover
3.6
An indication of how efficiently
AP13–4. (continued)
Req. 1 (continued)
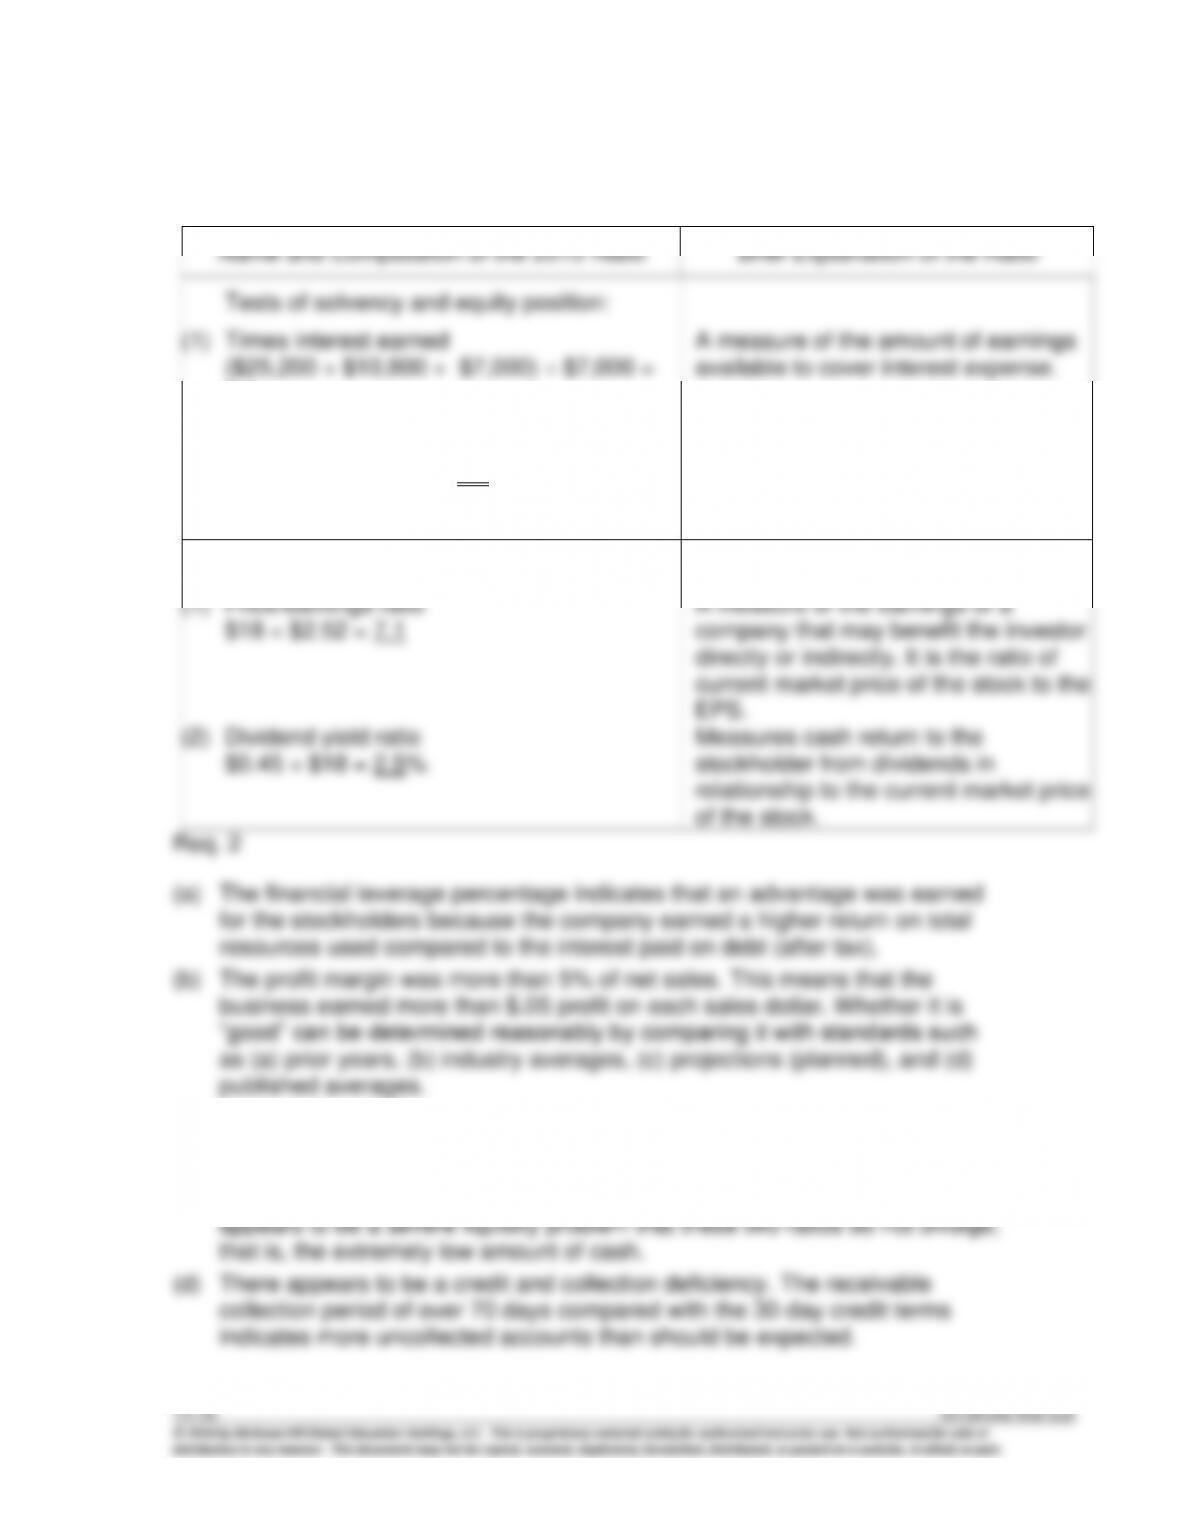
Name and Computation of the 2015 Ratio
Brief Explanation of the Ratio
Tests of liquidity:
(1)
Cash ratio
The most stringent test of liquidity; it
measures the amount of cash
available to pay current liabilities.
(2)
Current ratio
Measures the adequacy of working
capital by relating total current assets
to total current liabilities.
$48,800 ÷ $18,000 = 2.7 to 1
A severe test of liquidity by relating
quick assets to total current liabilities.
2
365 ÷ 5.1 = 71.6 days
Average number of days to collect an
account receivable.
(5)
Inventory turnover
An indication of the velocity with which
merchandise flows through the
business.
$250,000 ÷ [$25,000 + $18,000]
2
Indicates, as a days of supply figure,
the velocity with which merchandise
flows through the business.

AP13–4. (continued)
Req. 1 (continued)
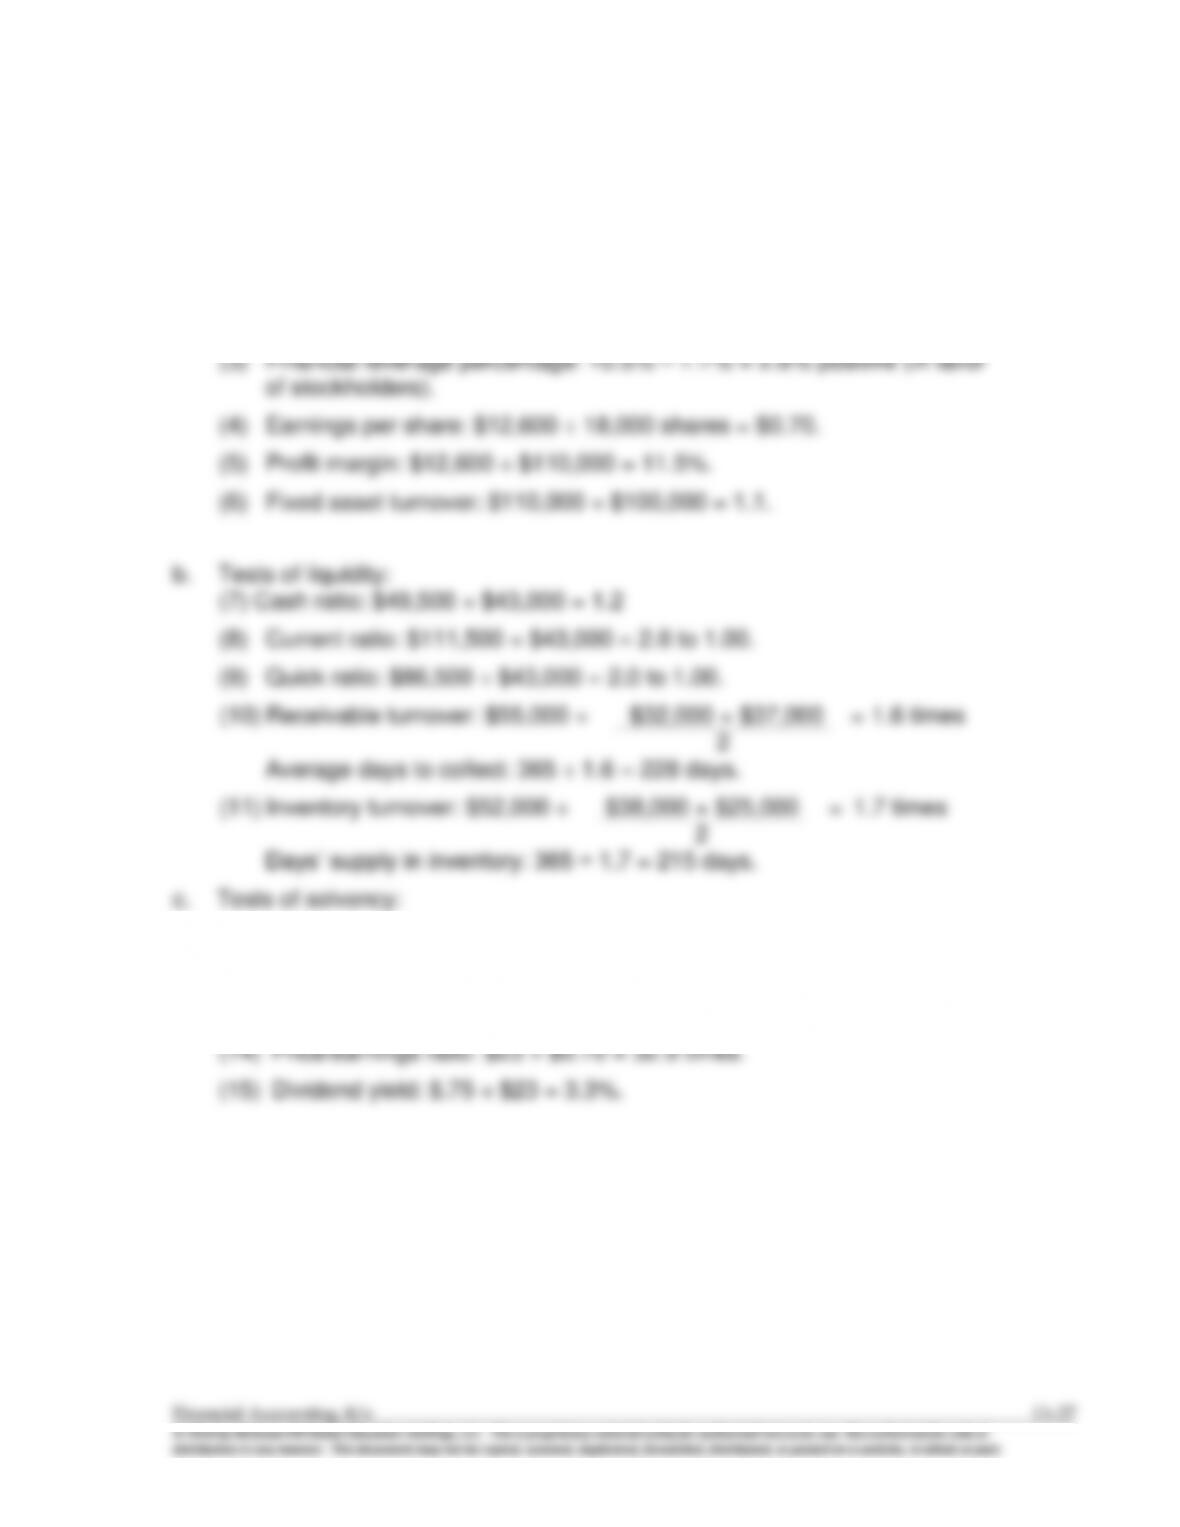
Tests of solvency and equity position:
6.1
(2)
Debt/equity ratio
$88,000 ÷ $116,000 = .76
Measures relationship between
resources provided by owners versus
resources provided by creditors.
Market tests:
(c) The current ratio is high and is more than the quick ratio because the latter
ratio is a much more severe test of liquidity (it omits inventory and prepaid
expenses). Each of these ratios probably would be “good” when compared
with some standard (such as those listed in (b) above). However, there

AP13–5.
Req. 1
a. Tests of profitability:
(1) Return on equity: $12,600 ÷ $120,500 = 10.5%.
(2) Return on assets: [$12,600 + ($4,000 x .70)] ÷ $199,750 = 7.7%.
(12) Times interest earned: ($12,600 + $4,000 + $5,400) ÷ $4,000 = 5.5
(13) Debt/equity ratio: $83,000 ÷ $123,500 = .67.
d. Market tests:

AP13–5. (continued)
Req. 2
a.
Sales revenue
($110,000 – $99,000) ÷ $99,000 = 11.1%
gt
Net income
Cash
($49,500 – $18,000) ÷ $18,000 = 175%
Inventory
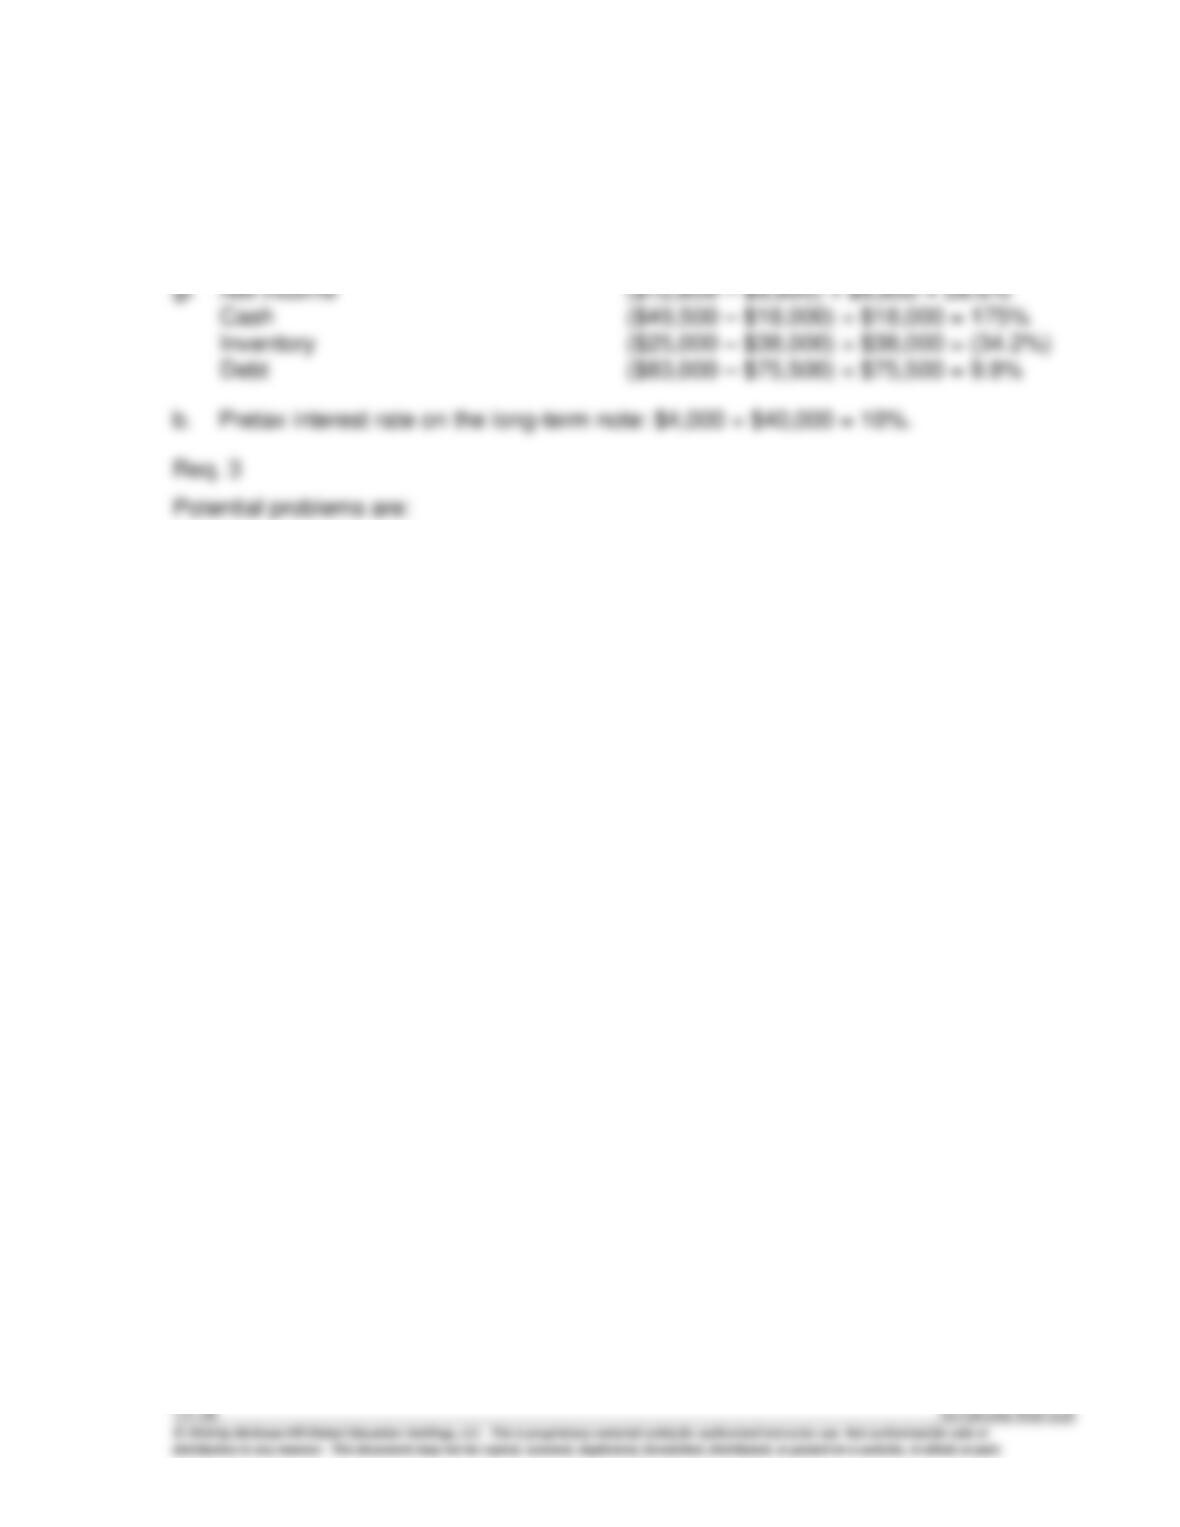
($25,000 – $38,000) ÷ $38,000 = (34.2%)
Debt
($83,000 – $75,500) ÷ $75,500 = 9.9%
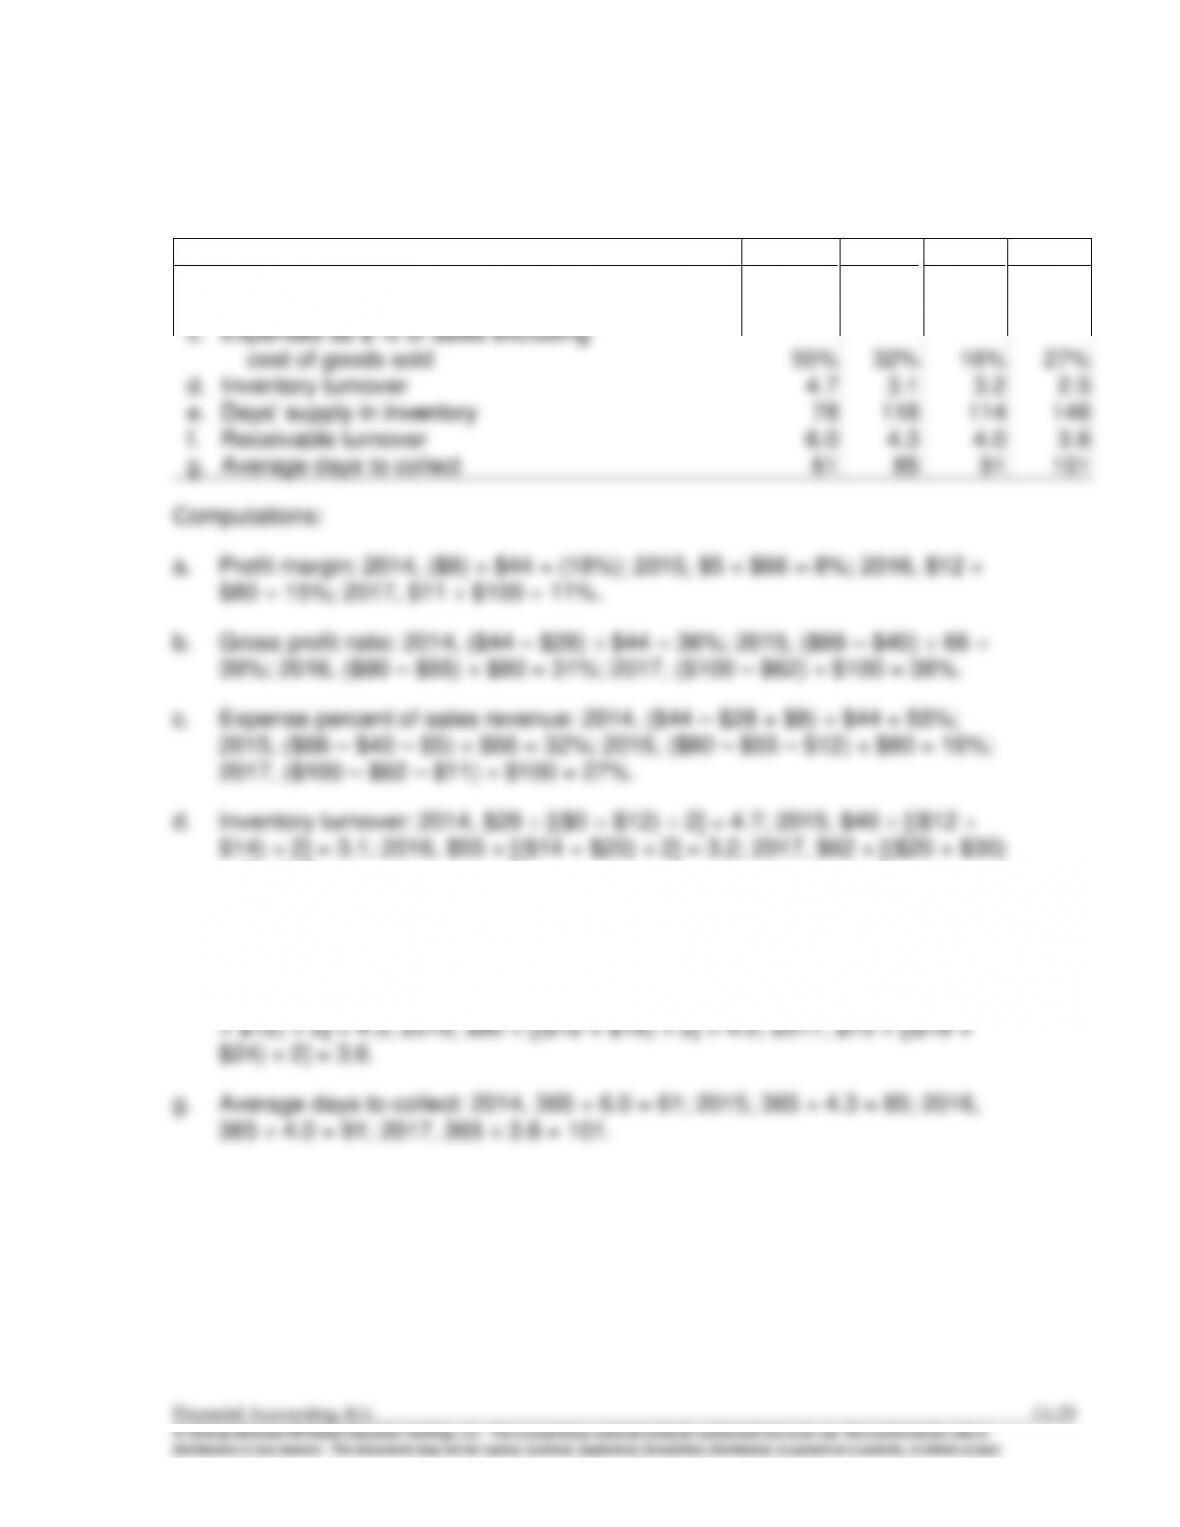
1. Average collection period of 228 days—long compared with the 30-day
credit period.
2. Inventory turnover 1.7 (i.e., 215 days)—long shelf life for most businesses.
3. Increase in accounts payable, nearly 20% from 2014 to 2015, is material in
amount; investigate the cause.
4. There was a significant increase in the amount of cash reported on the
balance sheet. Investigate why management wants to hold extra cash.

AP13–6.
Req. 1
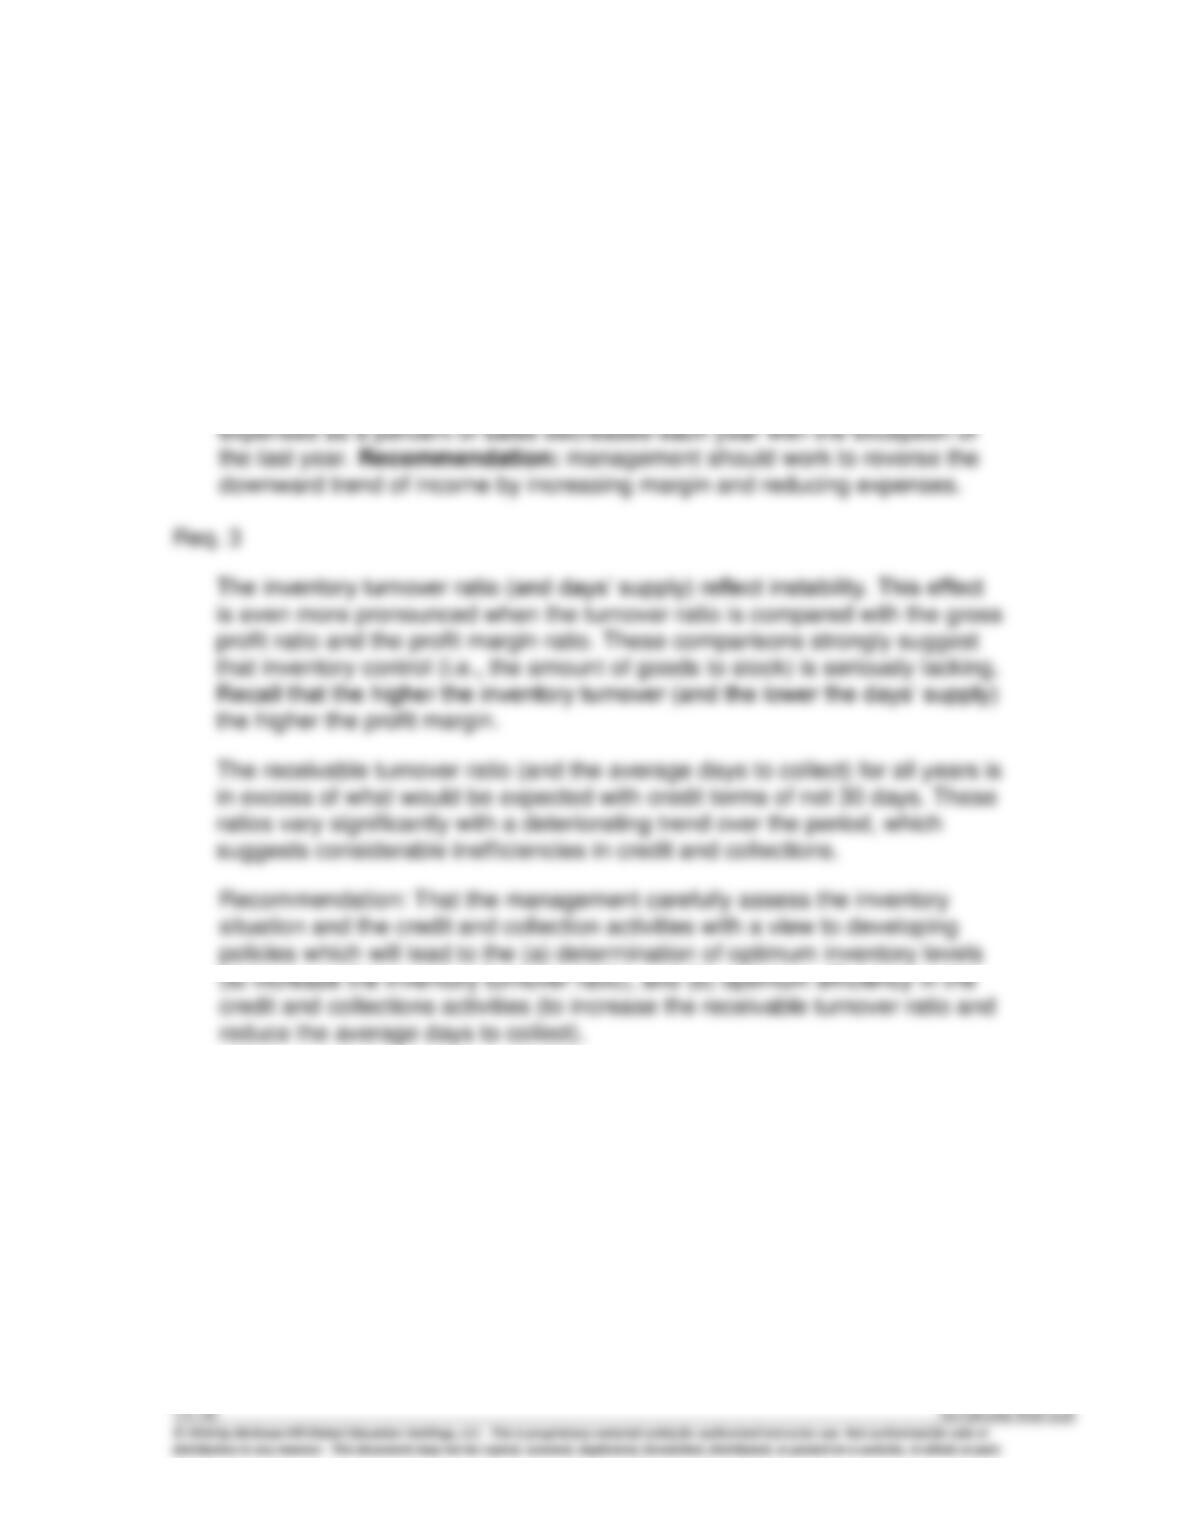
Ratio
2014
2015
2016
2017
a.
Profit margin %
(18%)
)
8%
15%
11%
b.
Gross profit ratio
36%
39%
31%
38%
55%
32%
16%
27%
d.
Inventory turnover
e.
Receivable turnover
÷ 2] = 2.5.
e. Days’ supply in inventory: 2014, 365 ÷ 4.7 = 78; 2015, 365 ÷ 3.1 = 118;
2016, 365 ÷ 3.2 = 114; 2017, 365 ÷ 2.5 = 146.
f. Receivable turnover: 2014, $33 ÷ [($0 + $11) ÷ 2] = 6.0; 2015, $49.5 ÷ [($11

AP13–6. (continued)
Req. 2
Revenue increased steadily each year. During the first years, profit margin
increased, but it decreased in the last year. Gross profit changed each year,
but increased the final year. Average markup changed each year, but

CASES AND PROJECTS
FINANCIAL REPORTING AND ANALYSIS CASES
CP13–1.
American Eagle
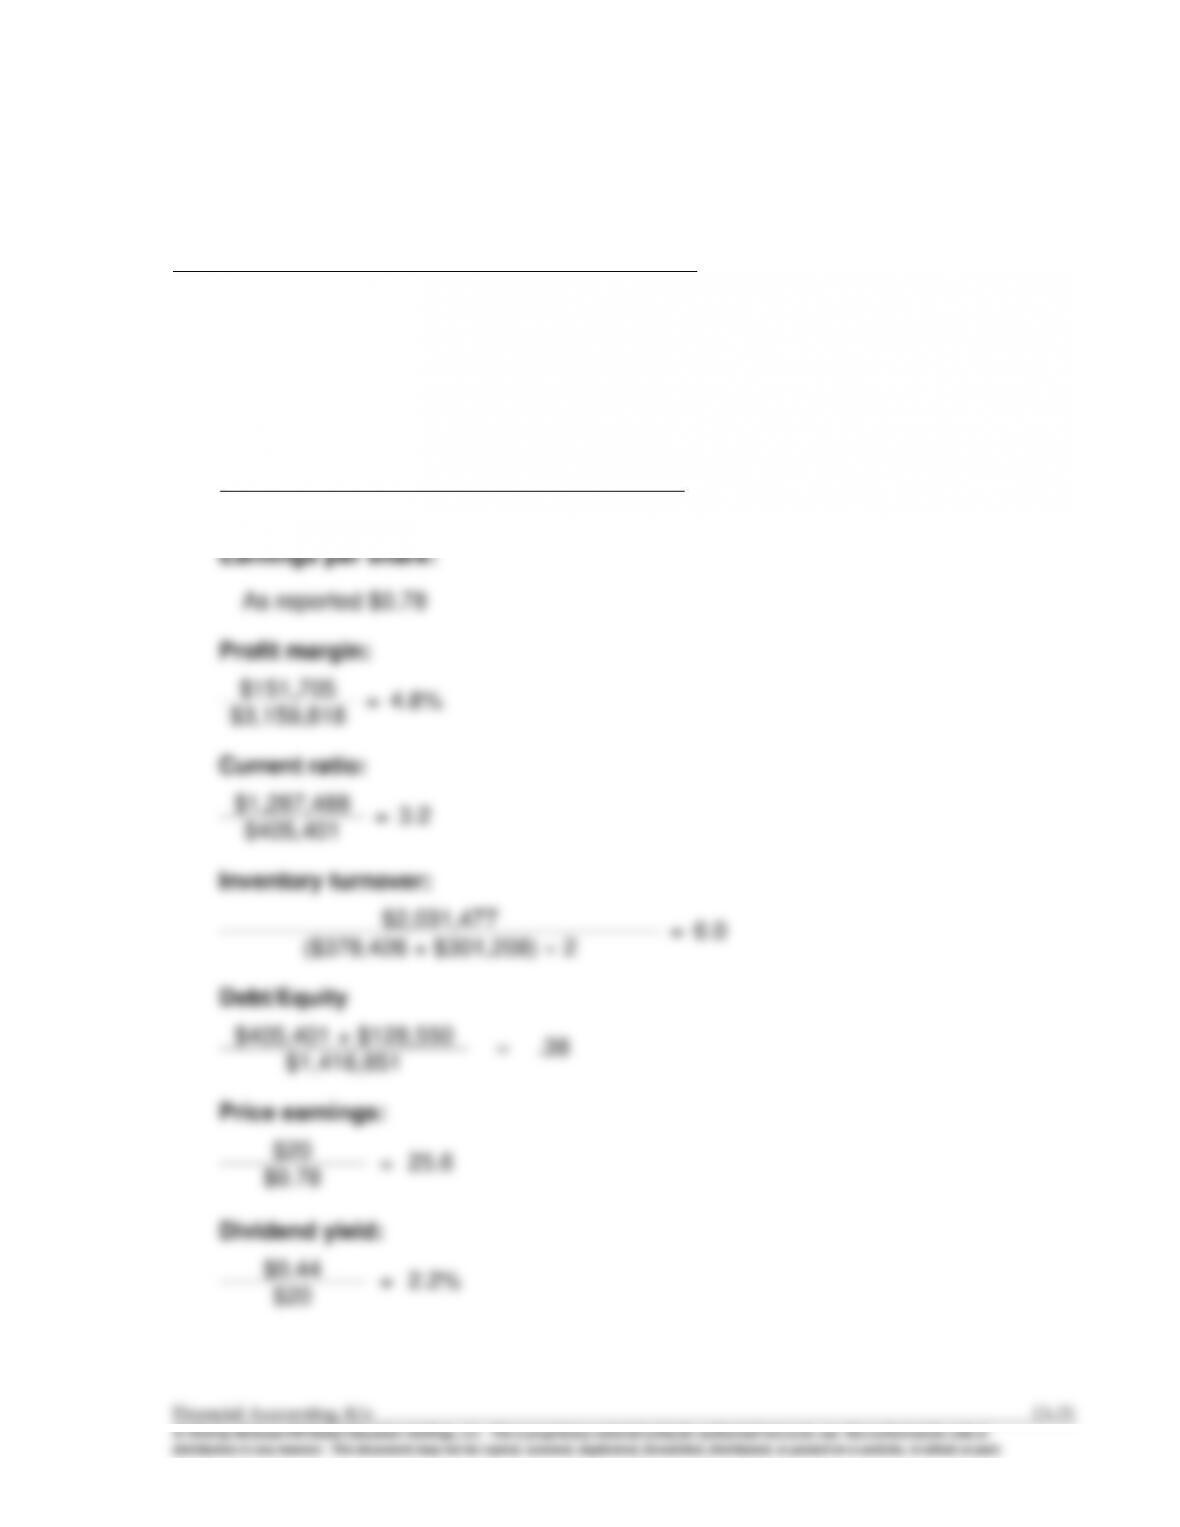
Return on equity:
$151,705
=
11.0%
($1,416,851 + $1,351,071) ÷ 2
4.8%
3.2
.38
25.6
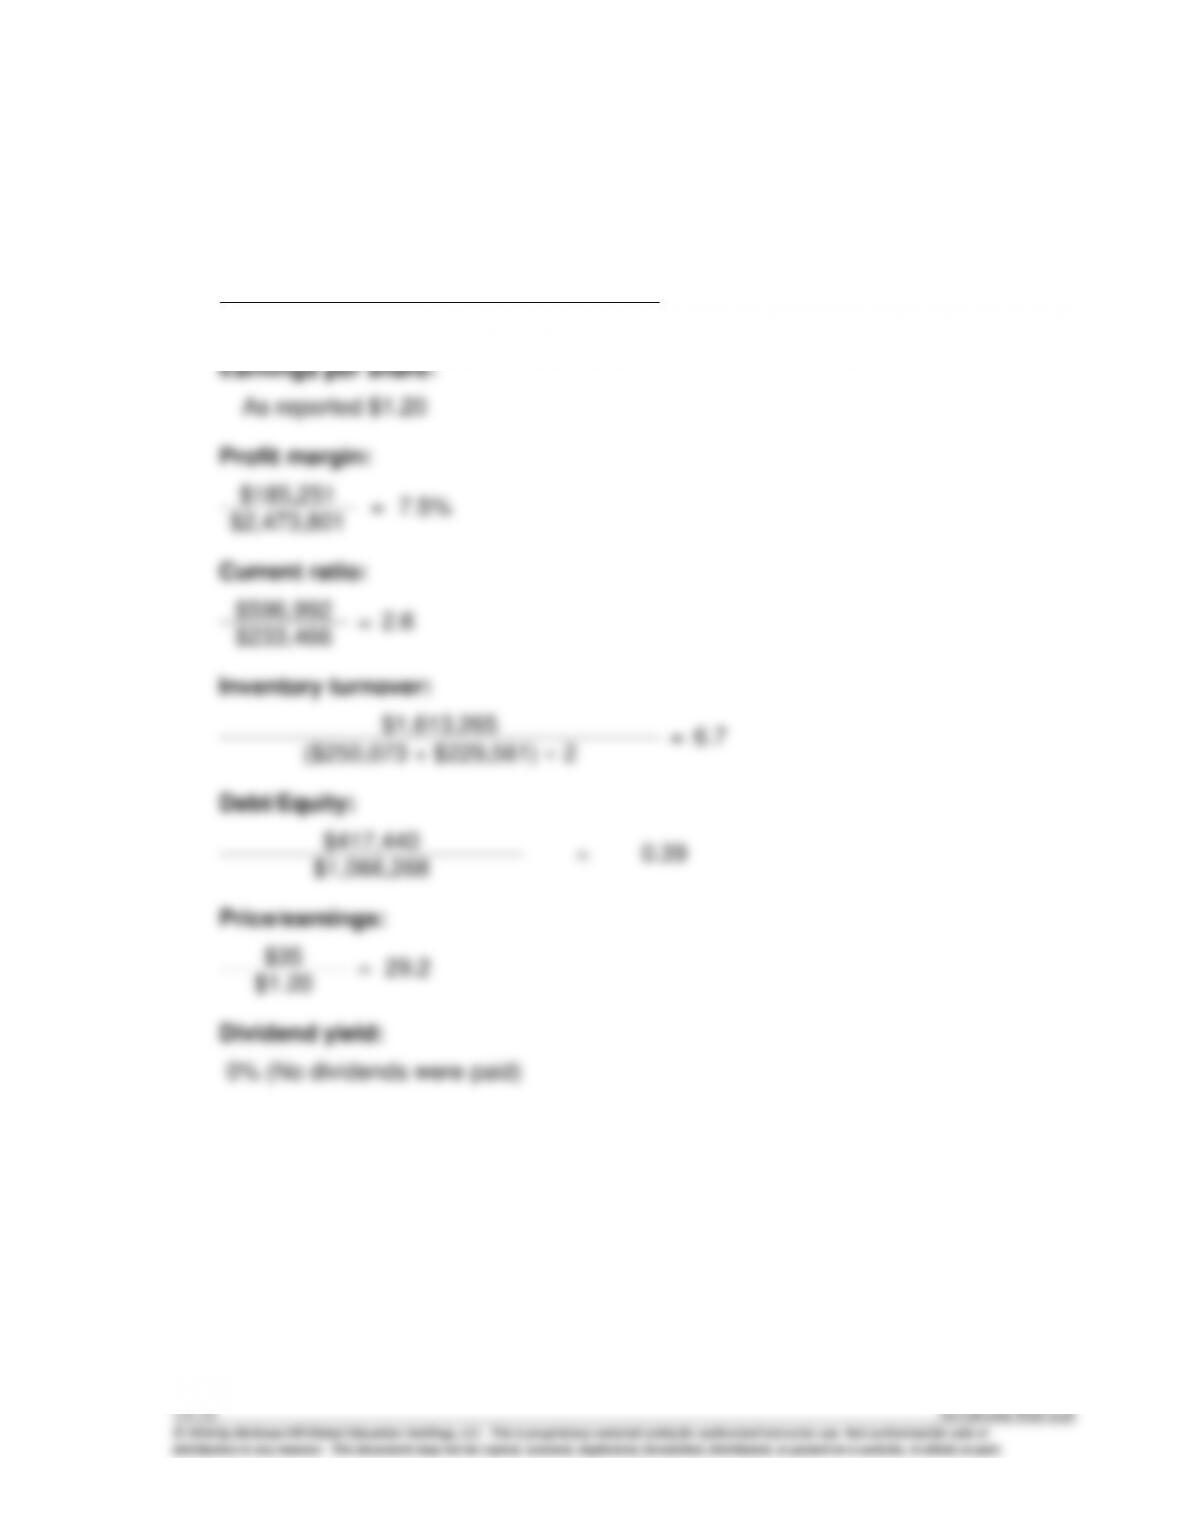

CP13–2.
Urban Outfitters
Return on equity:
$185,251
=
15.0%
($1,066,268 + $1,411,548) 2
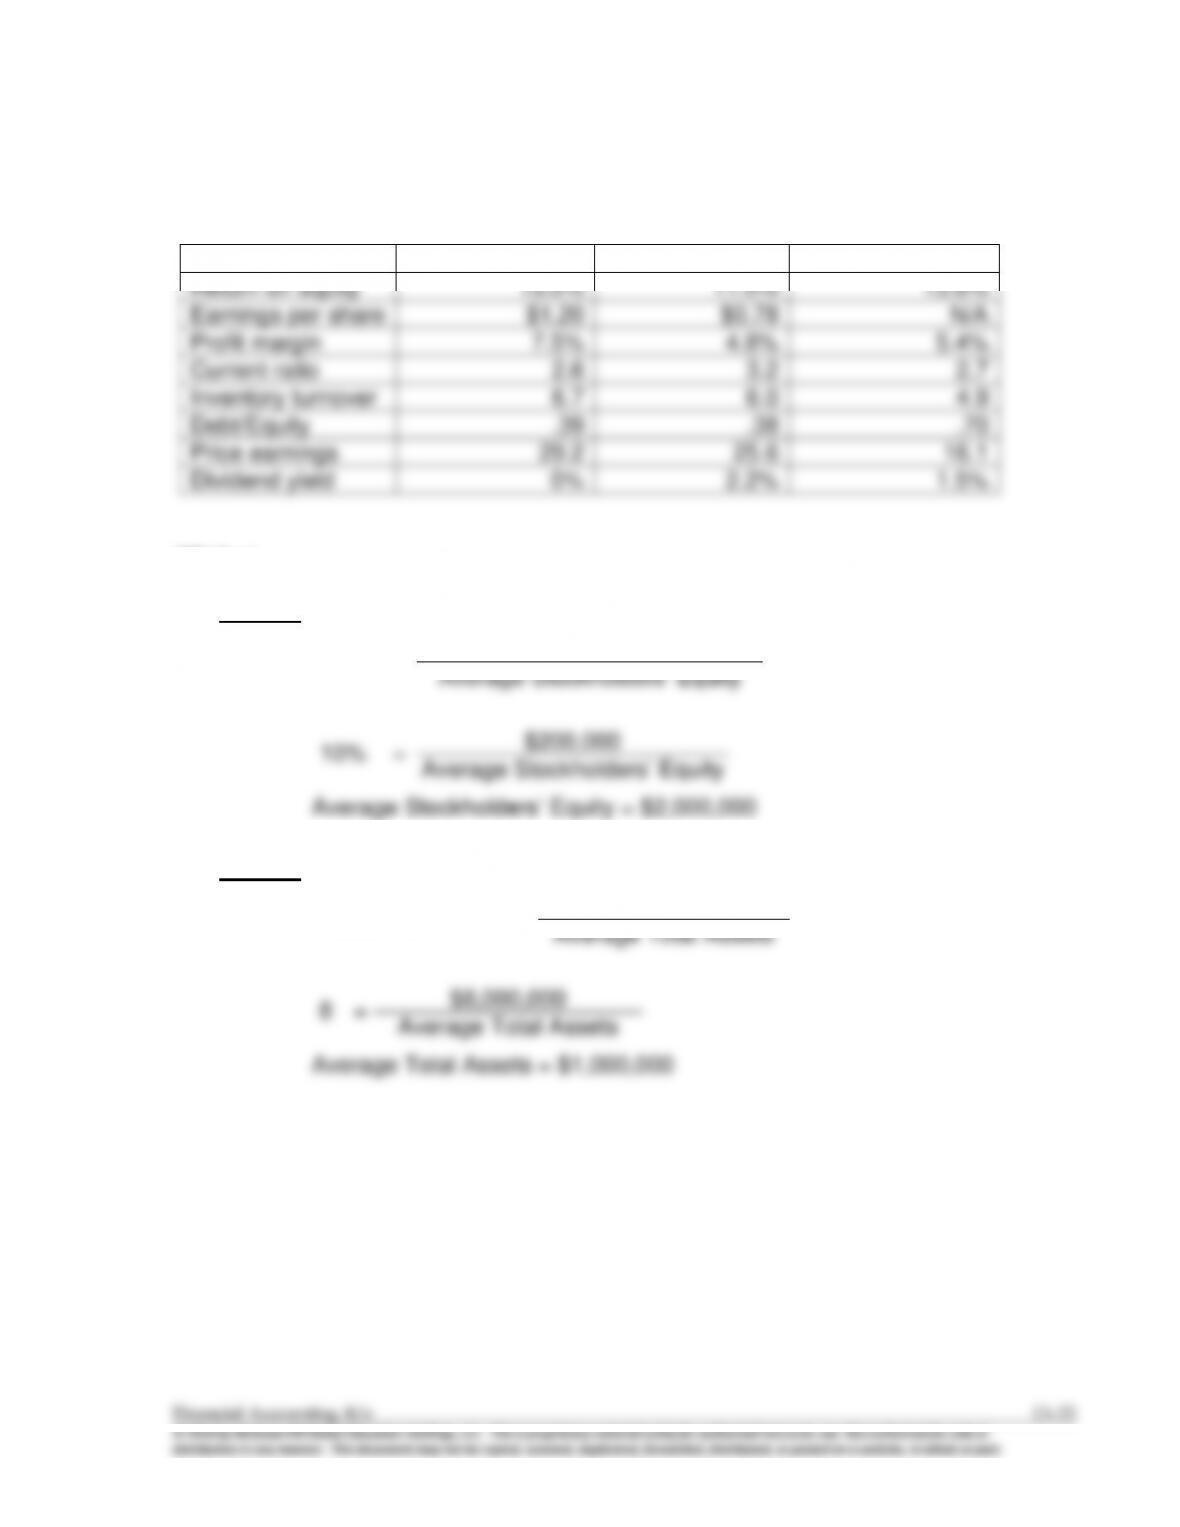

CP13–3.
For calculations, see CP13–1, CP13–2, and Appendix D.
Urban Outfitters
American Eagle
Industry Average
CP13–4.
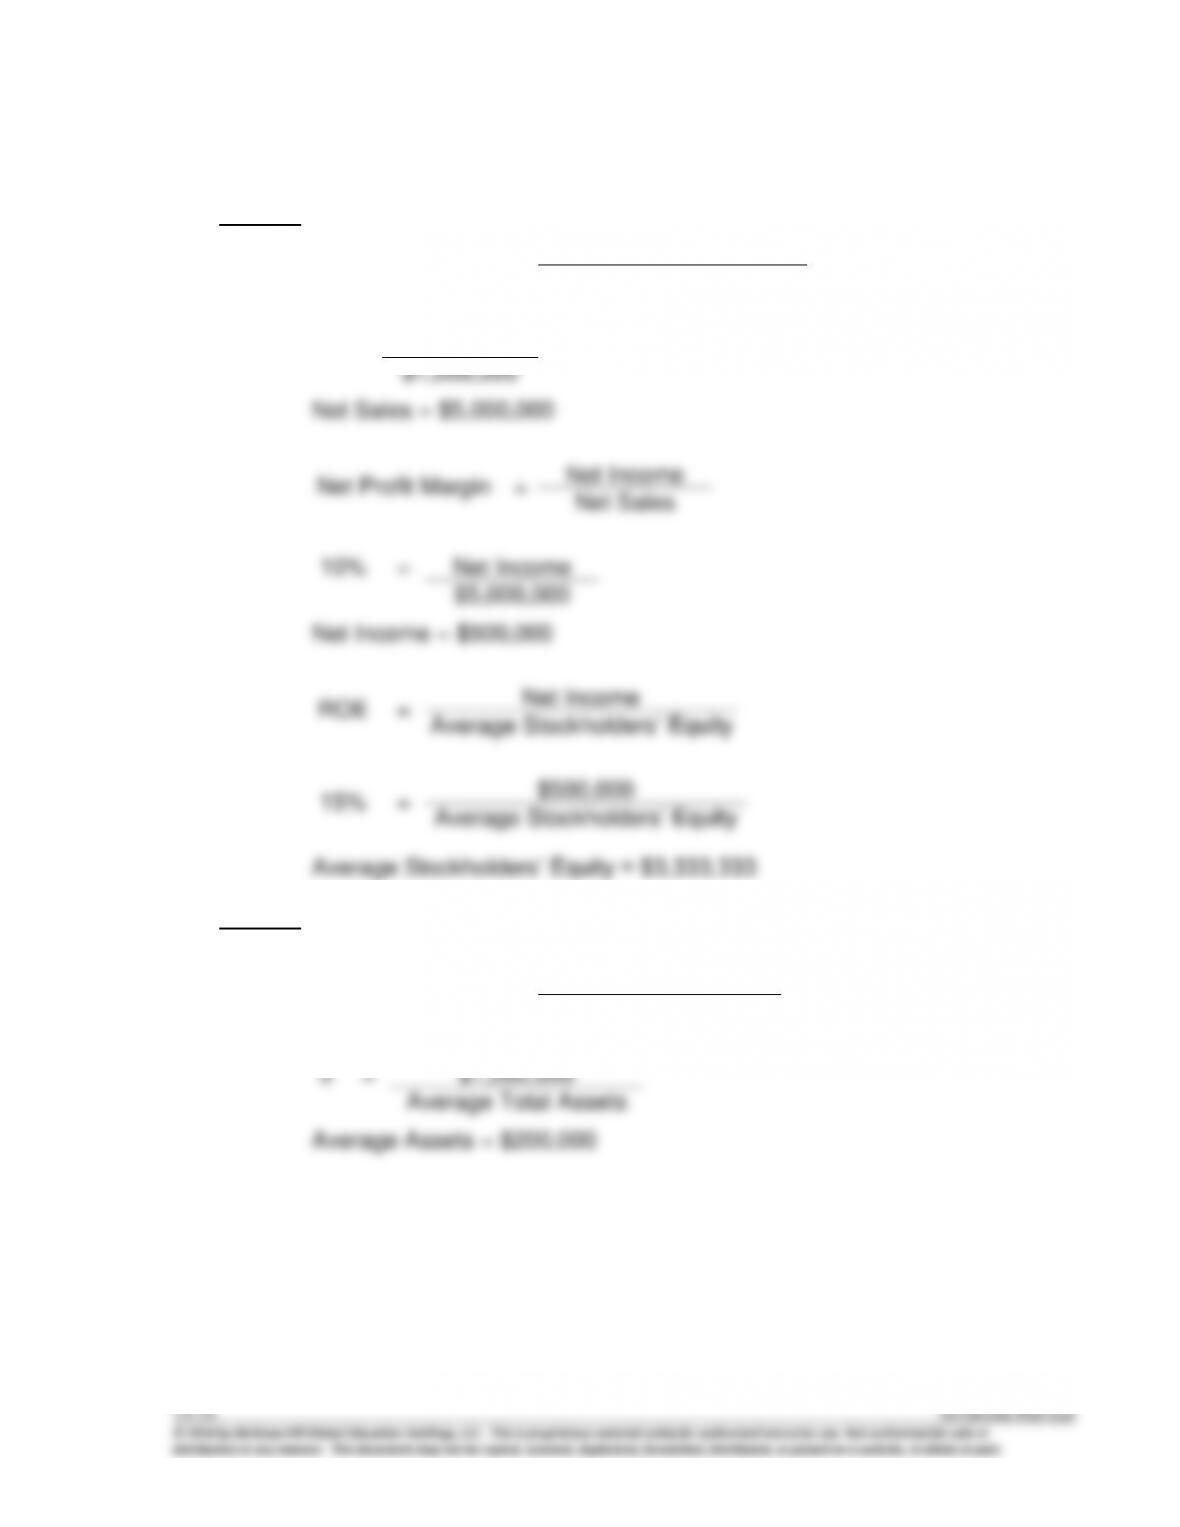
Case 1:
ROE
=
Net Income
=
Case 2:
Asset Turnover
=
Net Sales

CP13–4. (continued)
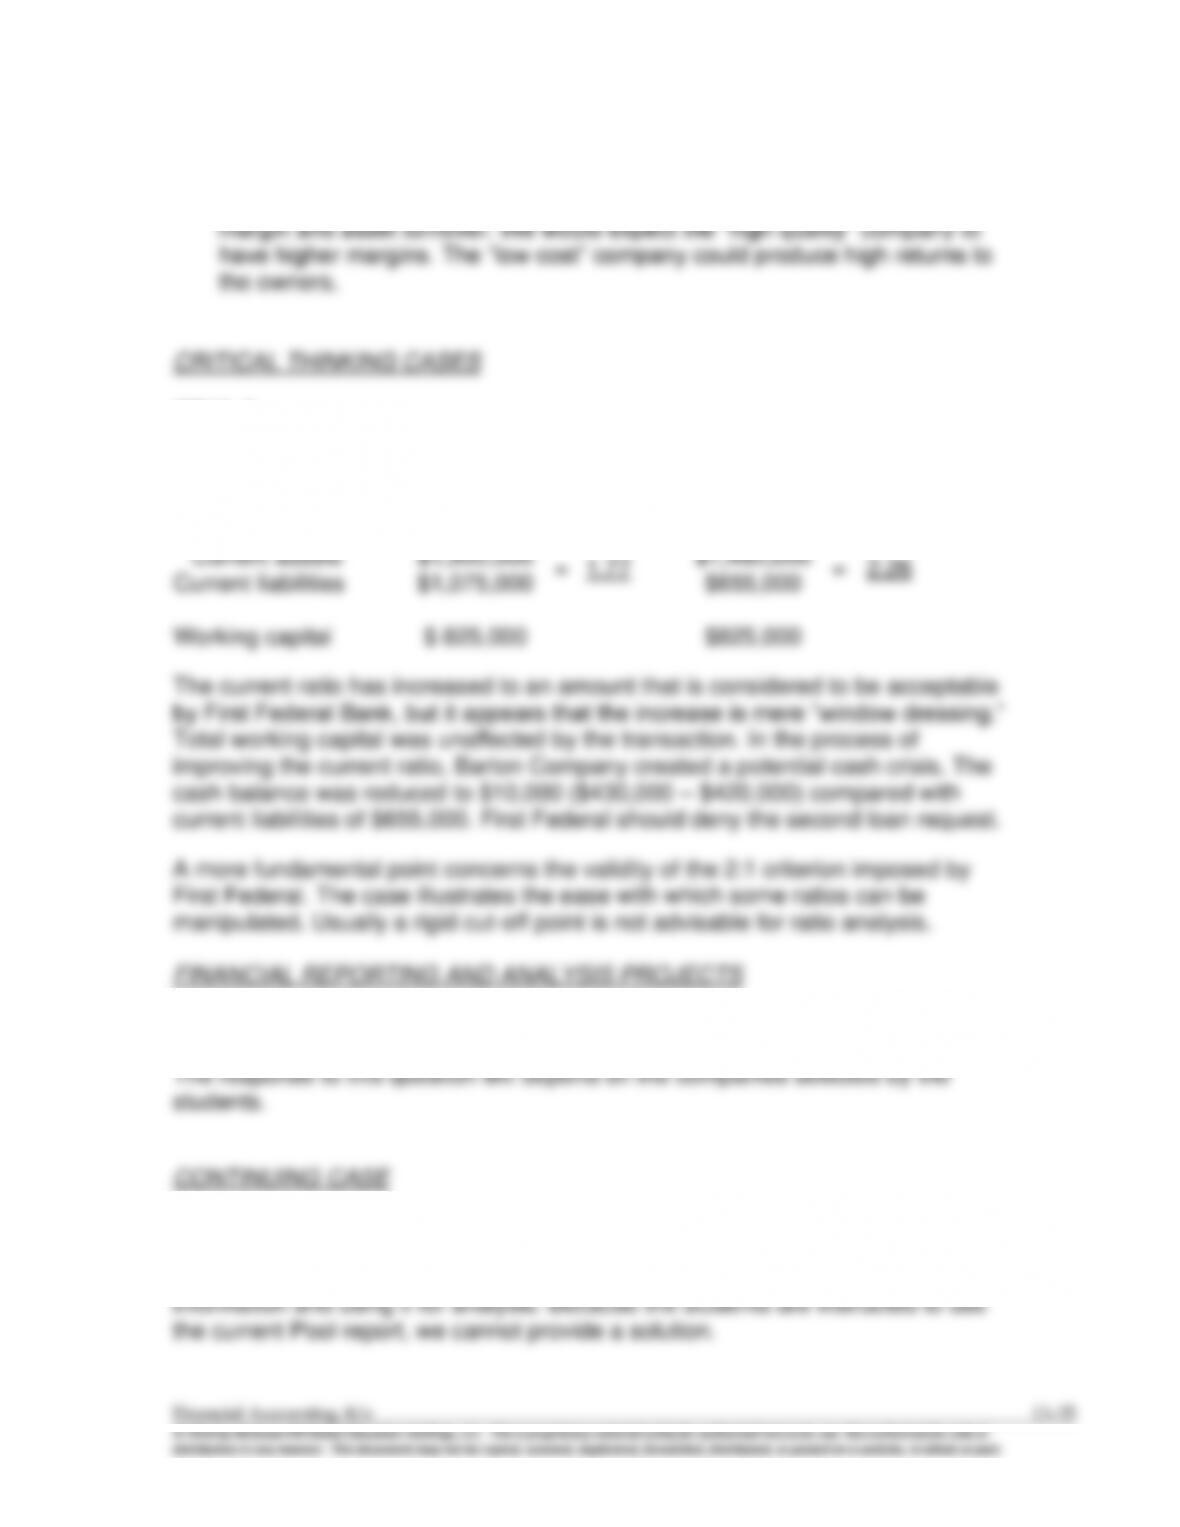
Case 3:
Asset Turnover
=
Net Sales
Average Total Assets
5
=
Net Sales
=
=
=
Case 4:
Asset Turnover
=
Net Sales
Average Total Assets

CP13–5.
The two areas where we would expect the largest difference are profit
CP13–6.
Although the amount of working capital was unchanged, the current ratio for
Barton Company increased as a result of paying $420,000 to the trade creditors:
Before
After
CP13–7.
CC13–1.
This case is designed to give students experience in looking up financial