Chapter 13
Analyzing Financial Statements
ANSWERS TO QUESTIONS
1. Primary items on the financial statements about which creditors usually are
2. The notes to the financial statements are particularly important to decision
makers because they explain, usually in narrative fashion, circumstances
3. The primary purpose of comparative financial statements is to provide the
user with information on the short-term trends of the various financial
factors reported in the financial statements. For example, the trends of such
4. Statement users are interested especially in financial summaries covering
several years because the long-term trends of the business are revealed.
Statement users must make projections of the future performance of the
5. Ratio analysis is a technique for computing and pinpointing certain
significant relationships in the financial statements. A ratio or percent
expresses a proportionate relationship between two different amounts
13–2 Solutions Manual
© 2014 by McGraw-Hill Global Education Holdings, LLC. This is proprietary material solely for authorized instructor use. Not authorized for sale or
distribution in any manner. This document may not be copied, scanned, duplicated, forwarded, distributed, or posted on a website, in whole or part.
reported on the financial statements. A ratio is computed by dividing one
amount by another amount; the divisor is known as the base amount. For
example, the profit margin ratio is computed by dividing net income by net
sales. Ratio analysis is particularly useful because it may reveal critical
relationships that are not readily apparent from absolute dollar amounts.
6. Component percentages are representations, as ratios or percents, of the
relationships between each of the several individual amounts that make up a
7. Fundamentally, return on investment is income divided by investment. The
two concepts of return on investment are:
(a) Return on equity (net income divided by owners’ investment). This rate
reflects the return earned for the owners after deducting the return to
8. Financial leverage percentage is measured as the difference between the
rate of return on equity and the rate of return on assets. This difference is
9. Profit margin is the ratio between net income and net sales. It reflects
performance in respect to the control of expenses to net sales but is
Financial Accounting, 8/e 13–3
current liabilities. The current ratio tends to measure liquidity and to indicate
11. A debt/equity ratio reflects the portion of total assets or resources used by a
business that was provided by creditors versus owners. In some companies,
the amount of debt is approximately 70 percent of the total assets which
12. Market tests are intended to measure the “market worth” per share of stock.
Market tests relate some amount to a share of stock (such as EPS or
13. The primary limitations associated with using ratios are:
ANSWERS TO MULTIPLE CHOICE
Authors’ Recommended Solution Time
(Time in minutes)
Mini-exercises
Exercises
Problems
Alternate
Problems
Cases and
Projects
No.
Time
No.
Time
No.
Time
No.
Time
No.
Time
1
5
1
20
1
60
1
60
1
50
2
5
2
20
2
45
2
45
2
50
3
5
3
20
3
60
3
20
3
60
4
5
4
25
4
20
4
60
4
45
5
5
5
15
5
60
5
60
5
20
6
5
6
20
6
30
6
30
6
30
7
5
7
20
7
60
7
*
8
5
8
20
8
30
9
5
9
20
9
20
10
5
10
20
10
50
11
20
12
25
13
25
* Due to the nature of this project, it is very difficult to estimate the amount of
time students will need to complete the assignment. As with any open-ended
MINI-EXERCISES
M13–1.
Gross Profit ÷ $1,665,000
=
44%
Gross Profit
=
$732,600
Revenue
$1,665,000
Cost of Goods Sold
(X)
Gross Profit
$732,600
Cost of Goods Sold
$932,400
M13–2.
2015
Sales
$31,198 *
Cost of Goods Sold
($9,107)
Gross Profit
$22,091
Gross Profit %: $22,091 ÷ $31,198 = 70.8%
M13–3.
M13–4.
M13–5.
If the average sales volume remains the same, then the cost of goods sold
M13–6.
Current Assets X
+ Noncurrent Assets $480,000
M13–7.
Current Ratio
=
Current Assets
Current Liabilities
Quick Ratio
=
Quick Assets
Current Liabilities
M13–8.
M13–9.
M13–10.
In most circumstances, a change from FIFO to LIFO will cause inventory to
decrease and cost of goods sold to increase.
Profit Margin
Will decrease
Fixed Asset Turnover
Will not be affected
Current Ratio
Will decrease
Quick Ratio
Will not be affected
EXERCISES
E13–1.
E13–2.
1. Meat packer (high inventory turnover)
E13–3.
1. Cable T.V. Company (no gross profit; high property & equipment)
E13–4.
Financial Accounting, 8/e 13–9
E13–5.
1.
A
Profit margin
2.
H
Inventory turnover ratio
3.
B
Average days to collect
4.
L
Dividend yield ratio
5.
C
Return on equity
6.
G
Current ratio
7.
K
Debt/equity ratio
8.
M
Price/earnings ratio
9.
E
Financial leverage percentage
10.
I
Receivable turnover ratio
11.
J
Average days’ supply in inventory
12.
D
Earnings per share
13.
N
Return on assets
14.
F
Quick ratio
15.
Q
Times interest earned
16.
O
Cash coverage ratio
17.
P
Fixed asset turnover ratio
E13–6.
Lowe’s Companies, Inc.
Consolidated Statements of Earnings
(In millions, except per share and
percentage data)
Feb 3,
2012
%
Jan 28,
2011
%
Jan 29,
2010
%
Fiscal years ended on
Sales
Sales
Sales
Net sales
$
50,208
100.00
%
$
48,815
100.00
%
$
47,220
100.00
%
Cost of sales
32,858
65.44
31,663
64.86
30,757
65.14
Gross margin
17,350
34.56
17,152
35.14
16,463
34.86
Expenses:
Selling, general and
administrative
12,593
25.08
12,006
24.60
11,737
24.85
Depreciation
1,480
2.95
1,586
3.25
1,614
3.42
Interest – net
371
0.74
332
0.68
287
0.61
Total expenses
14,444
28.77
13,924
28.53
13,638
28.88
Pre-tax earnings
2,906
5.79
3,228
6.61
2,825
5.98
Income tax provision
1,067
2.13
1,218
2.49
1,042
2.20
Net earnings
$
1,839
3.66
%
$
2,010
4.12
%
$
1,783
3.78
%
There is a decline in net earnings as a percent of sales and gross margin from
E13–7.
Current Assets
(1)
Current Liabilities
(2)
Current
Ratio
(1 ÷ 2)
Start
$120,000
($120,000 ÷ 1.5)
$80,000
1.50
Transaction (1)
Inventory
+ 40,000
Accts. Pay.
+ 40,000
Subtotal
160,000
120,000
1.33
Transaction
(2)*
Cash
– 3,000
$157,000
$120,000
1.31
E13–8.
Effect on Current Ratio
1.
Increase, assuming that cash was collected from sale
2.
Will decrease
3.
Will decrease
4.
Will increase
E13–9.
Turnover:
Accounts receivable $75,312* ÷ [($6,275 + $6,068) ÷ 2]
=
12.2
Inventory ($83,608 x 0.48) ÷ [($7,379 + $6,721) ÷ 2]
=
5.7
*$83,680 x 90% = $75,312
=
=
64.0
E13–10.
Cost of Goods Sold = 5.0 x $1,456,414,000
E13–11.
Turnover:
Accounts receivable $700,000* ÷ [($45,000 + $60,000) ÷ 2]
=
13.3
Inventory ($1,000,000 x 0.6) ÷ [($70,000 + $25,000) ÷ 2]
=
12.6
*$1,000,000 x 70% = $700,000
Days:
Accounts receivable (365 days ÷ 13.3)
=
27.4
Inventory (365 days ÷ 12.6)
=
29.0
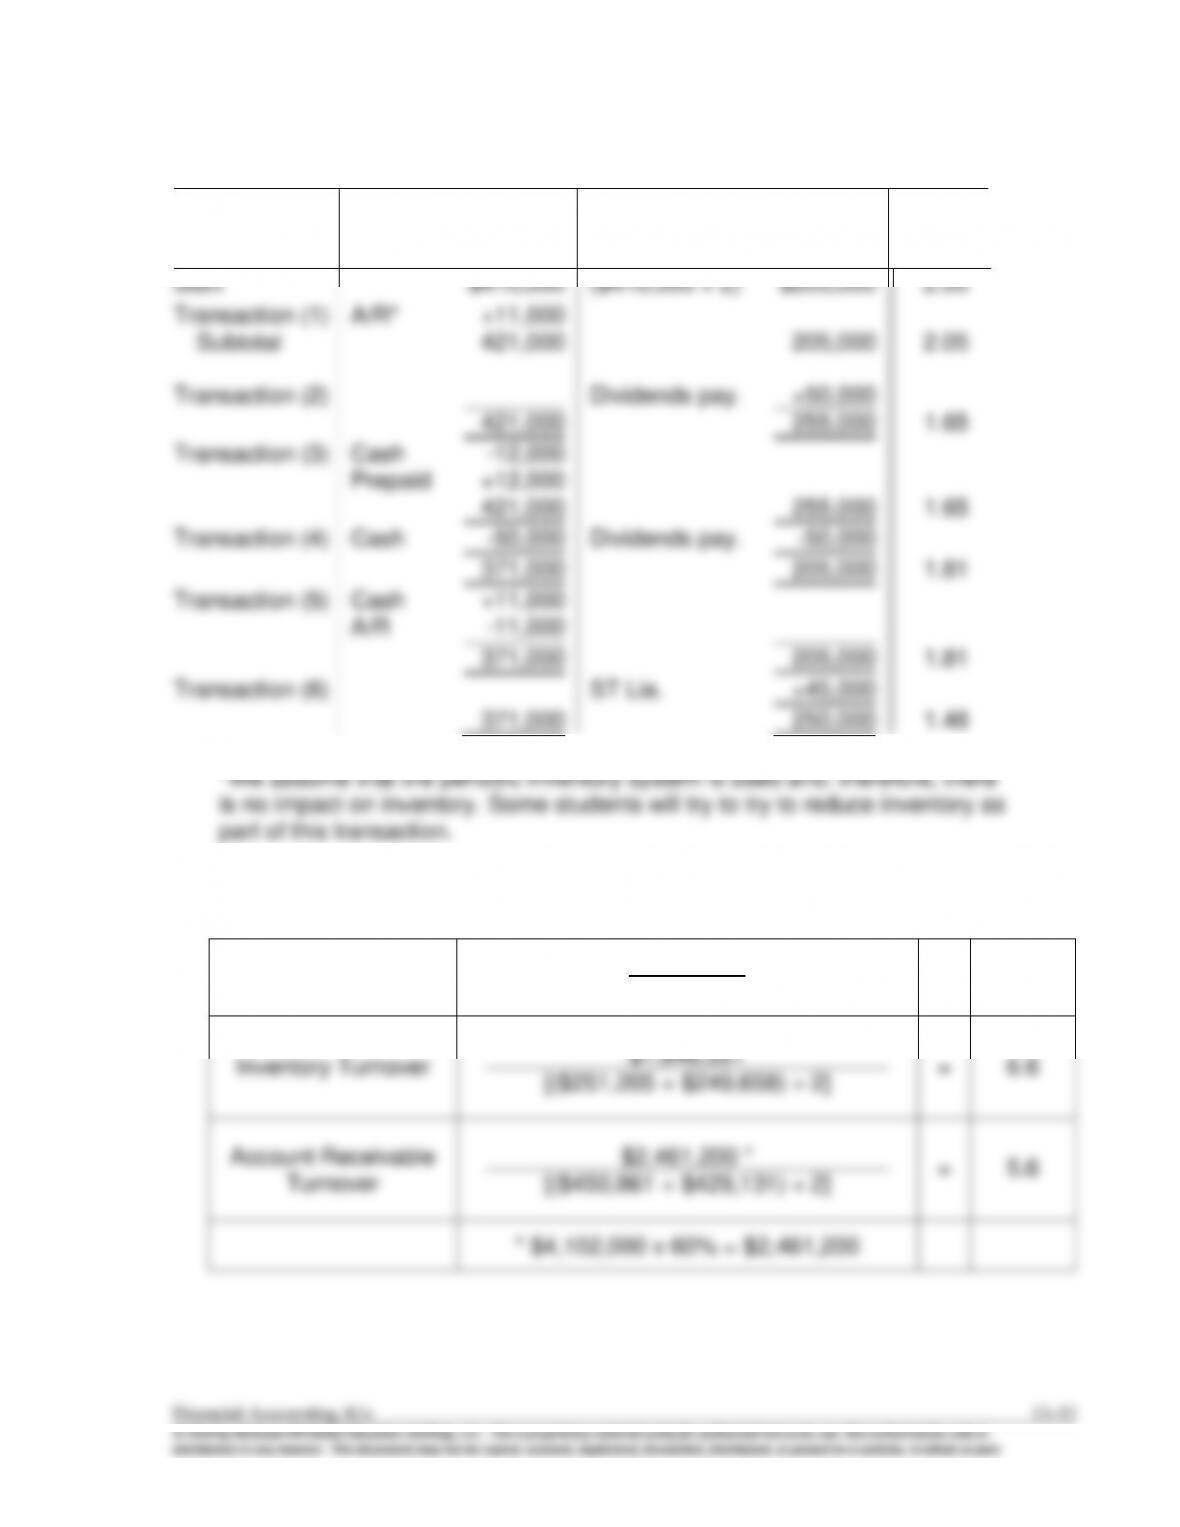
E13–12.
Current Assets
(1)
Current Liabilities
(2)
Current
Ratio
(1 ÷ 2)
Start
$410,000
($410,000 ÷ 2)
$205,000
2.00
Transaction (1)
A/R*
+11,000
Subtotal
421,000
205,000
2.05
Transaction (2)
Dividends pay.
+50,000
421,000
255,000
1.65
Transaction (3)
Cash
Prepaid
-12,000
+12,000
421,000
255,000
1.65
Transaction (4)
Cash
-50,000
Dividends pay.
-50,000
371,000
205,000
1.81
Transaction (5)
Cash
+11,000
-11,000
A/R
371,000
205,000
1.81
Transaction (6)
ST Lia.
+45,000
371,000
250,000
1.48
E13–13.
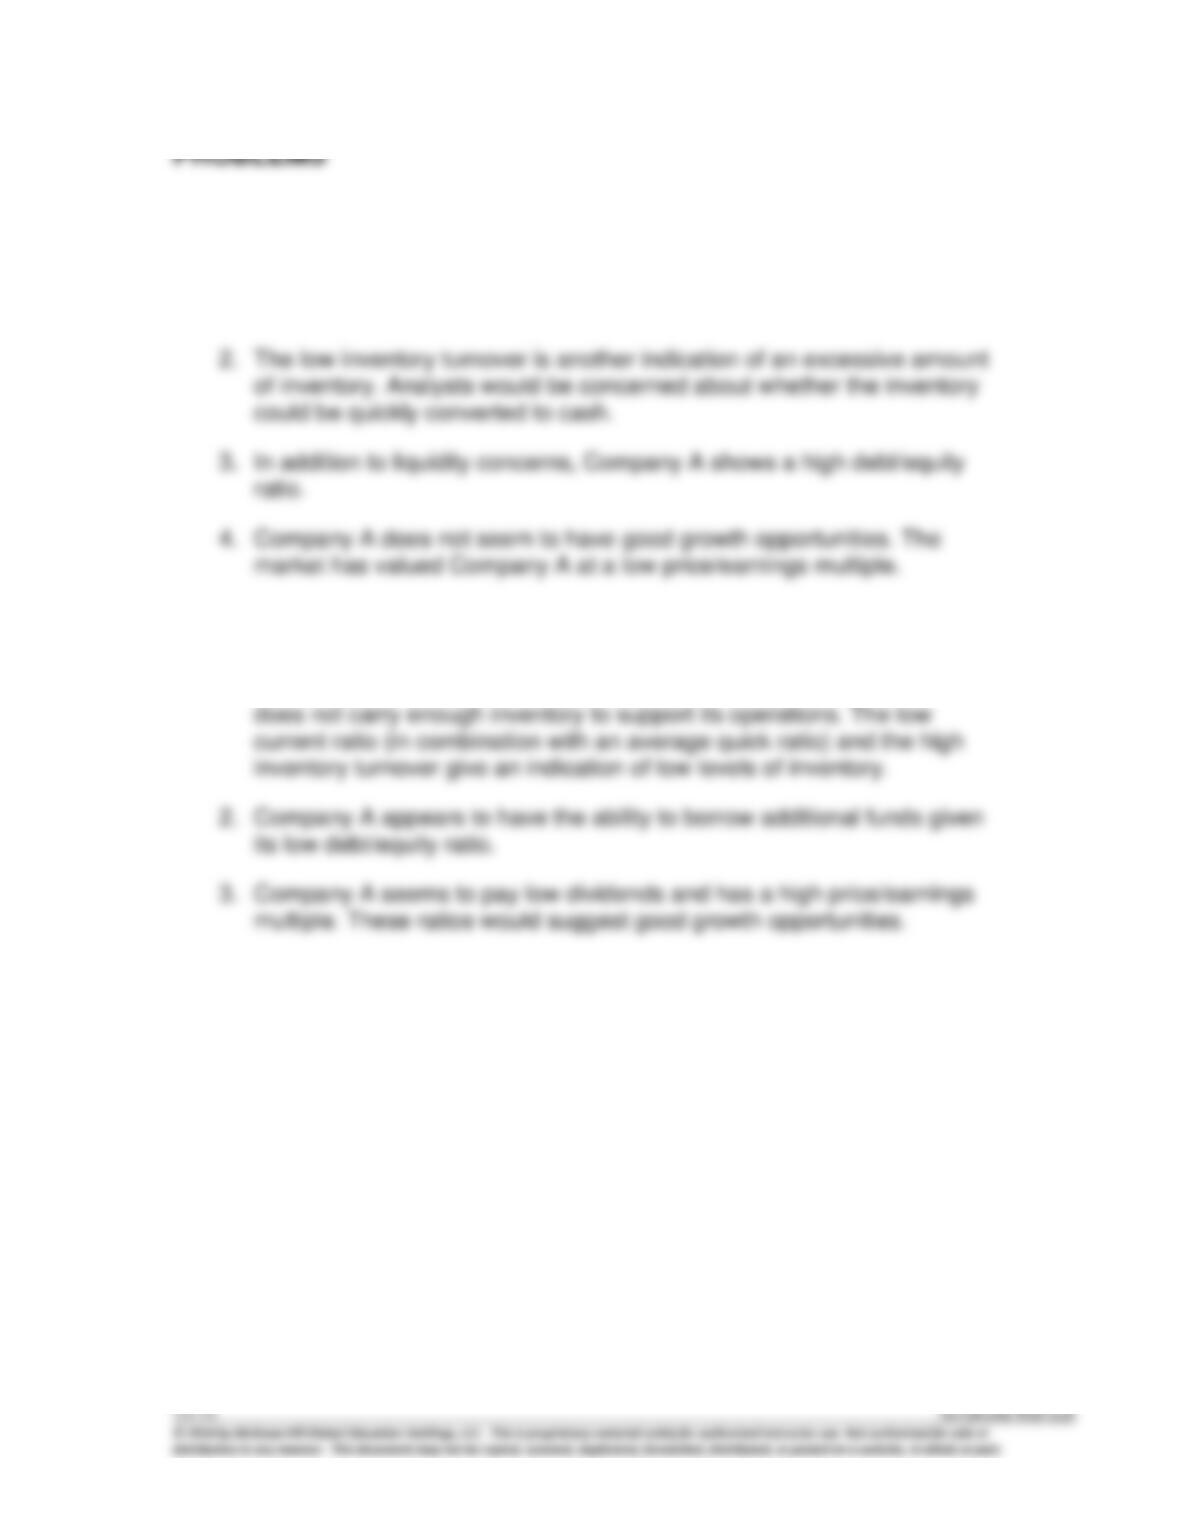
Current Ratio
$1,066,595
$670,891
=
1.6
Inventory Turnover
$1,648,551
=
6.6
[($251,205 + $249,658) ÷ 2]
Account Receivable
Turnover
$2,461,200 *
=
5.6
[($450,861 + $429,131) ÷ 2]
* $4,102,000 x 60% = $2,461,200
13–14 Solutions Manual
© 2014 by McGraw-Hill Global Education Holdings, LLC. This is proprietary material solely for authorized instructor use. Not authorized for sale or
distribution in any manner. This document may not be copied, scanned, duplicated, forwarded, distributed, or posted on a website, in whole or part.
PROBLEMS
P13–1.
1. Company A has a high level of liquidity as shown by the current ratio but
the low quick ratio indicates that much of the liquidity is tied up in
inventory.
P13–2.
1. Company A is either extremely efficient at inventory management or it
P13–3.
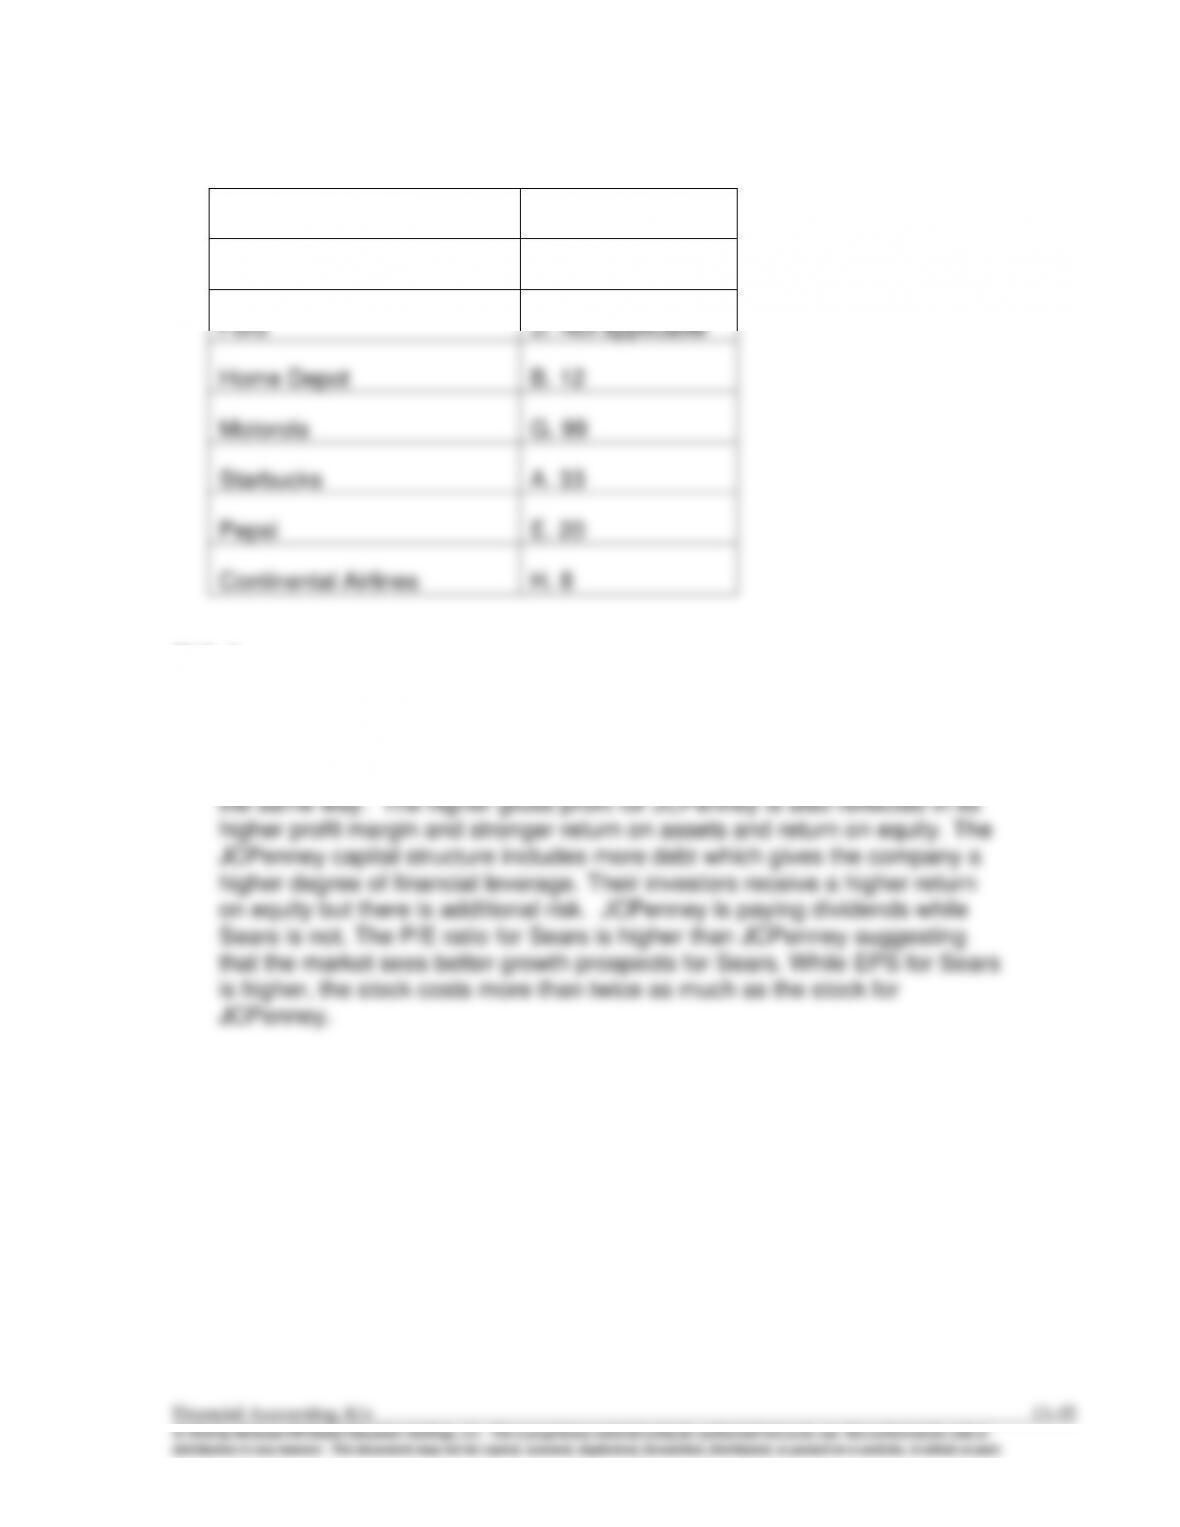
Commerce Bank
C. 15
Duke Energy
F. 13
Ford
D. Not applicable
Home Depot
B. 12
Motorola
G. 99
Starbucks
A. 33
Pepsi
E. 20
Continental Airlines
H. 8
P13–4.
JCPenney is the stronger company and probably the better investment.
JCPenney has a higher gross profit margin, which means that they make
more gross profit on each dollar of sales than does Sears. This is very
significant since the two companies are in the same business, and operate in
P13–5.
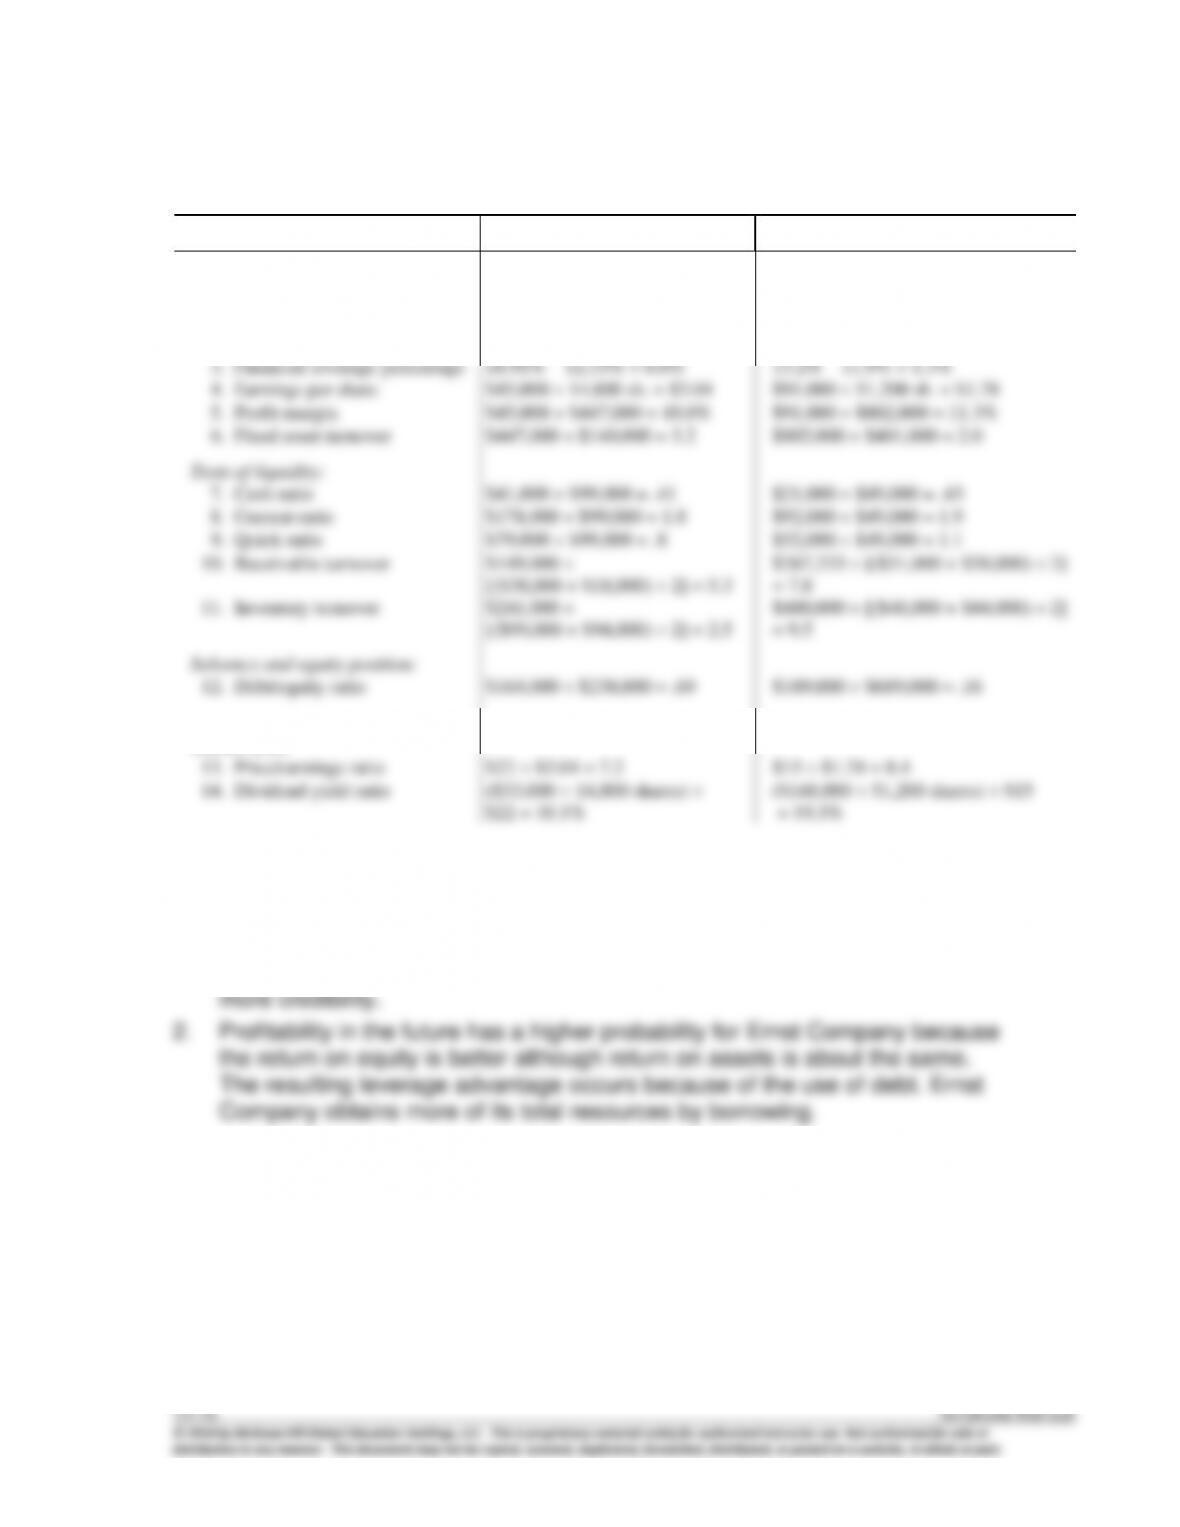
Req. 1
Ratio
Ernst Company
Young Company
Tests of profitability:
1.
Return on equity
$45,000 ÷ $238,000 = 18.9%
$91,000 ÷ $689,000 = 13.2%
2.
Return on assets
[$45,000 + ($65,000 x 10% x.70)]
÷ $402,000 = 12.3%
[$91,000 + ($60,000 x 10% x .70)]
÷ $798,000 = 11.9%
3.
Financial leverage percentage
18.91% – 12.33% = 6.6%
13.2% – 11.9% = 1.3%
4.
Earnings per share
$45,000 ÷ 14,800 sh. = $3.04
$91,000 ÷ 51,200 sh. = $1.78
5.
Profit margin
$45,000 ÷ $447,000 = 10.0%
$91,000 ÷ $802,000 = 11.3%
6.
Fixed asset turnover
$447,000 ÷ $140,000 = 3.2
$802,000 ÷ $401,000 = 2.0
Tests of liquidity:
7.
Cash ratio
$41,000 ÷ $99,000 = .41
$21,000 ÷ $49,000 = .43
8.
Current ratio
$178,000 ÷ $99,000 = 1.8
$92,000 ÷ $49,000 = 1.9
9.
Quick ratio
$79,000 ÷ $99,000 = .8
$52,000 ÷ $49,000 = 1.1
10.
Receivable turnover
$149,000 ÷
[($38,000 + $18,000) ÷ 2] = 5.3
$267,333 ÷ [($31,000 + $38,000) ÷ 2]
= 7.8
11.
Inventory turnover
$241,000 ÷
[($99,000 + $94,000) ÷ 2] = 2.5
$400,000 ÷ [($40,000 + $44,000) ÷ 2]
= 9.5
Solvency and equity position:
12.
Debt/equity ratio
$164,000 ÷ $238,000 = .69
$109,000 ÷ $689,000 = .16
Market tests:
13.
Price/earnings ratio
$22 ÷ $3.04 = 7.2
$15 ÷ $1.78 = 8.4
14.
Dividend yield ratio
($33,000 ÷ 14,800 shares) ÷
$22 = 10.1%
($148,000 ÷ 51,200 shares) ÷ $15
= 19.3%
Req. 2
Recommended choice: Ernst Company
Basis for recommendation:
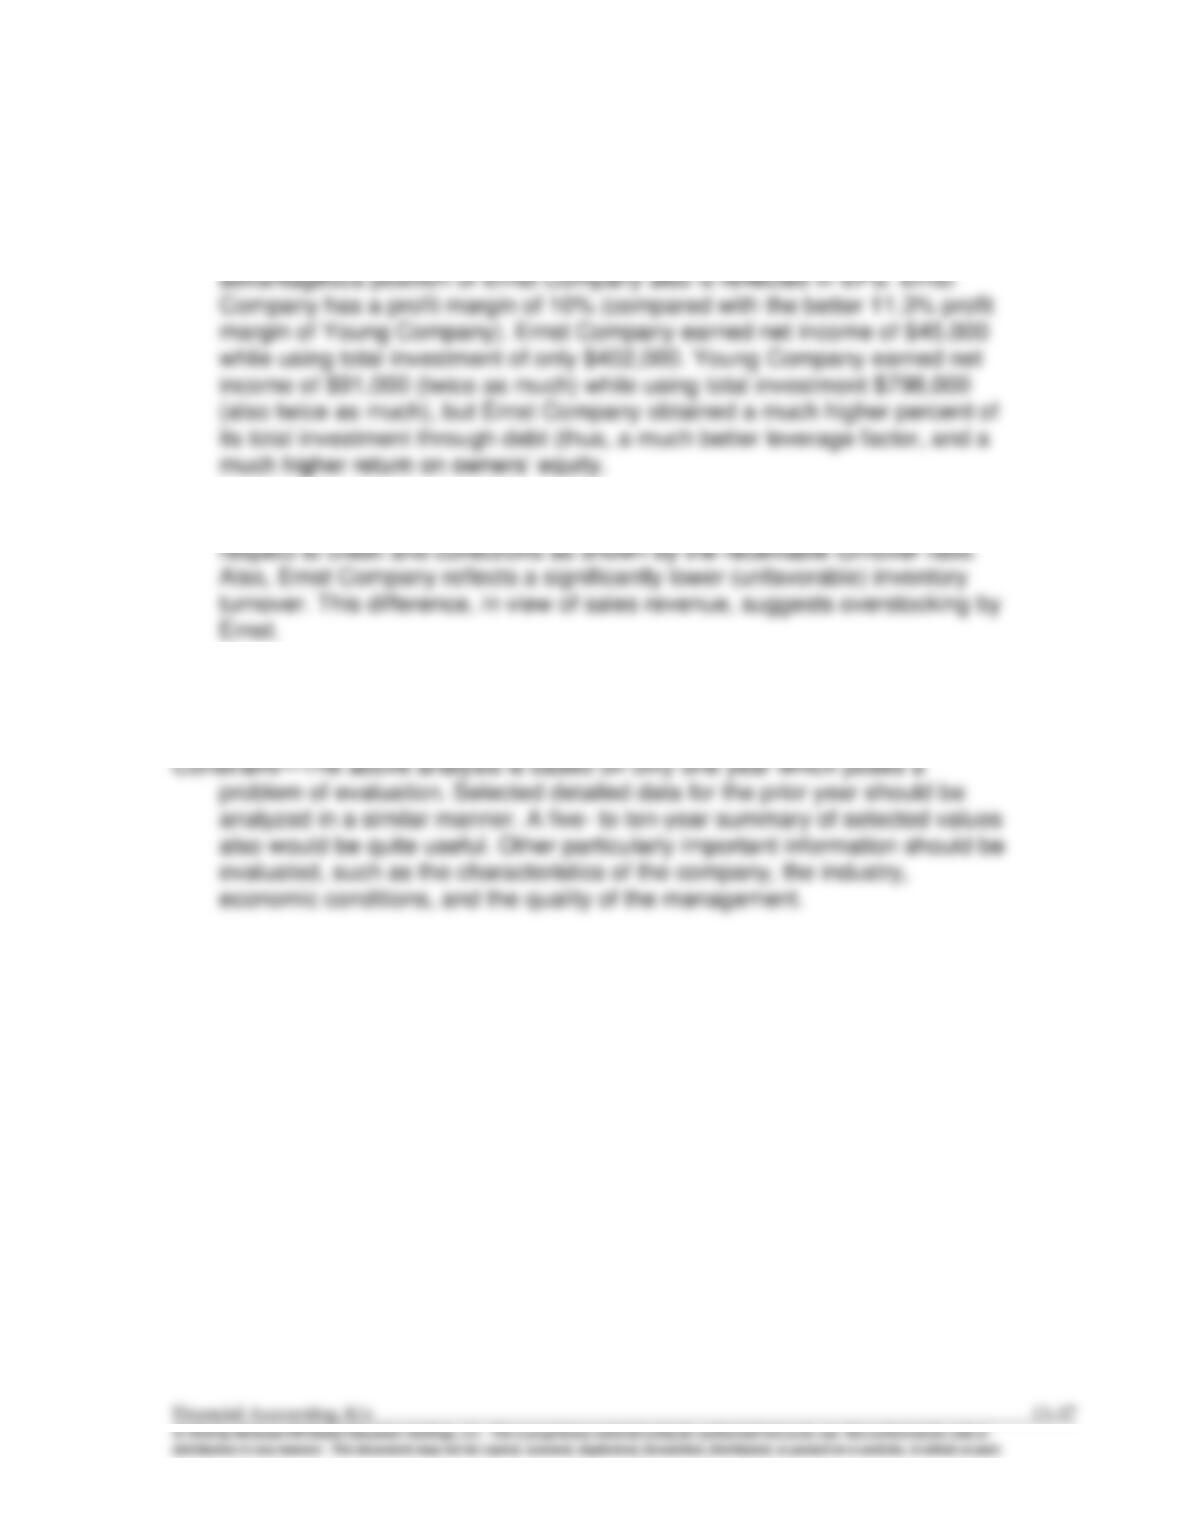
1. The reported information for Ernst Company is audited; therefore, it has
P13–5. (continued)
Req. 2 (continued)
Ernst Company is taking better advantage of this leverage. The
3. Young Company has a better liquidity position measured in terms of the
current ratio and the quick ratio. Young Company is in a better position in
4. The market tests favor Young Company but the company declared and paid
a dividend in excess of its profits. This pattern cannot be continued. This
payout should cause concern because Young Company is low on cash.
P13–6.
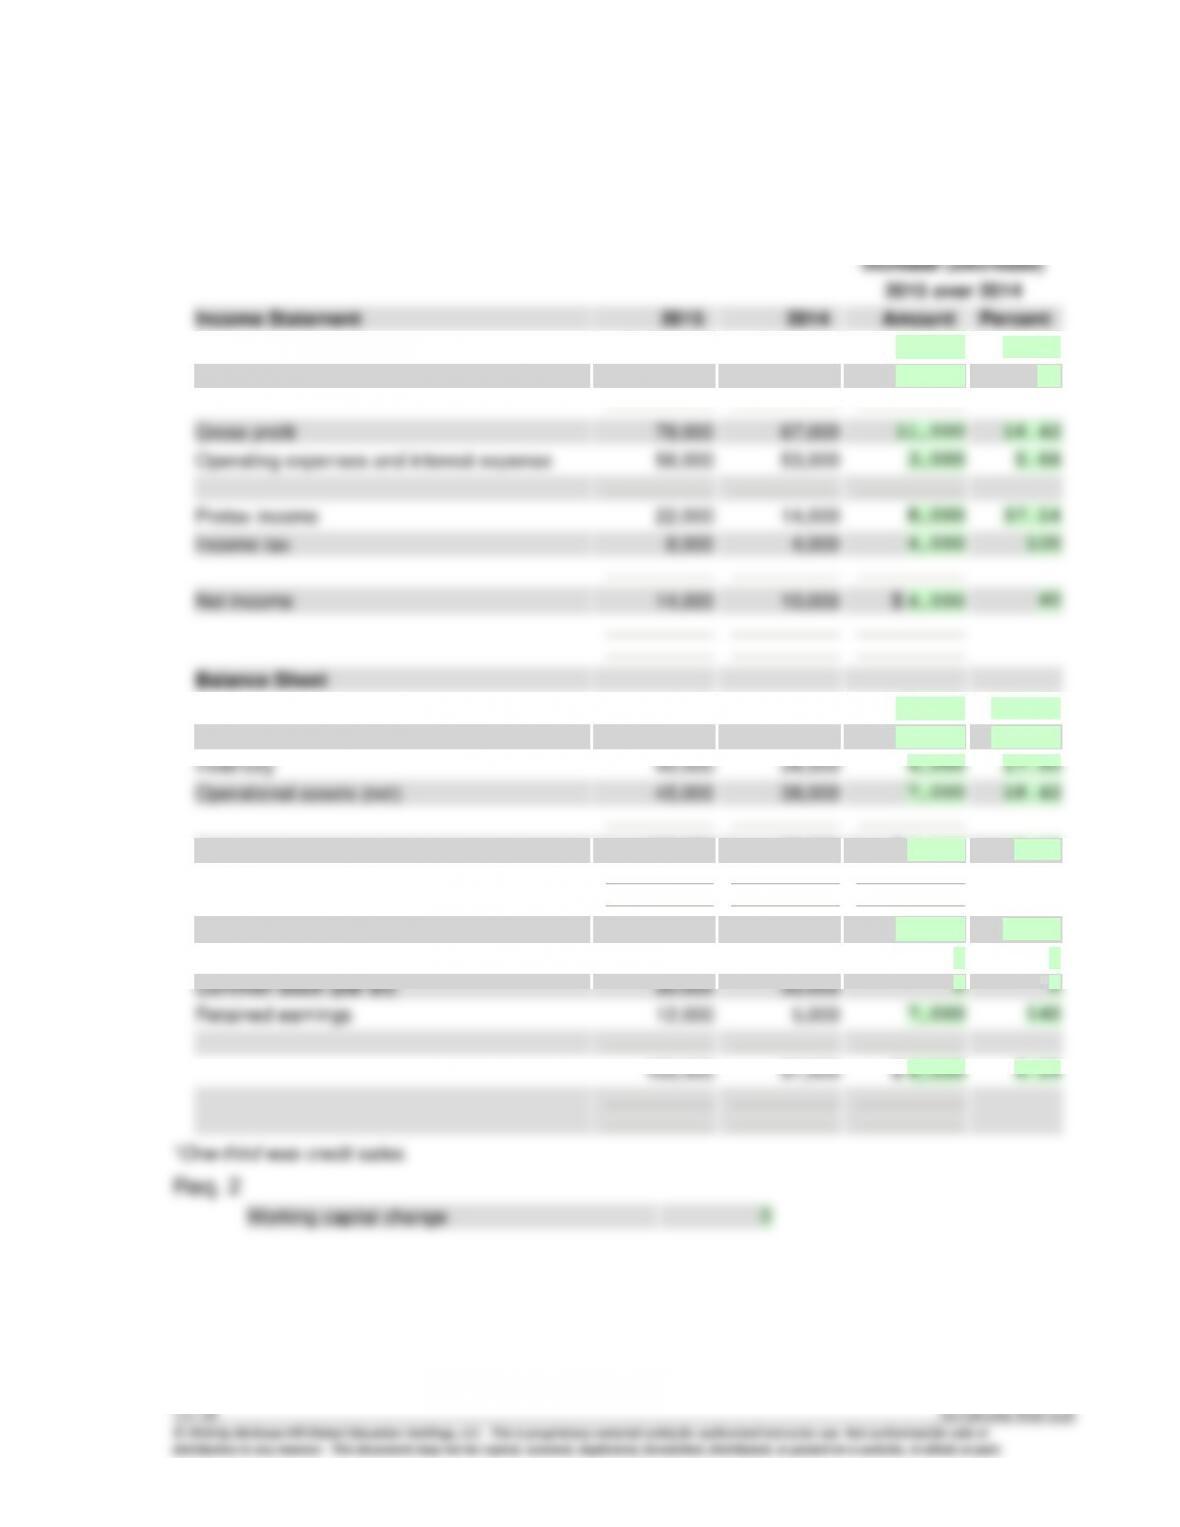
Req. 1
Increase (Decrease)
2015 over 2014
Income Statement
2015
2014
Amount
Percent
Sales revenue
$190,0001
$167,000
$ 23,000
13.77
Cost of goods sold
112,000
100,000
12,000
12
Gross profit
78,000
67,000
11,000
16.42
Operating expenses and interest expense
56,000
53,000
3,000
5.66
Pretax income
22,000
14,000
8,000
57.14
Income tax
8,000
4,000
4,000
100
Net income
14,000
10,000
$ 4,000
40
Balance Sheet
Cash
$4,000
$7,000
$ -3,000
-42.86
Accounts receivable (net)
14,000
18,000
-4,000
-22.22
Inventory
40,000
34,000
6,000
17.65
Operational assets (net)
45,000
38,000
7,000
18.42
103,000
97,000
$ 6,000
6.19
Current liabilities (no interest)
$16,000
$17,000
$ -1,000
-5.88
Long-term liabilities (10% interest)
45,000
45,000
0
0
Common stock (par $5)
30,000
30,000
0
0
Retained earnings
12,000
5,000
7,000
140
103,000
97,000
$ 6,000
6.19
1One-third was credit sales.
Req. 2
Working capital change
0